. 2017 Apr 6;544(7648):53-58.
doi: 10.1038/nature21693. Epub 2017 Mar 29.

Myeloid progenitor cluster formation drives emergency and leukaemic myelopoiesis

Affiliations

Myeloid progenitor cluster formation drives emergency and leukaemic myelopoiesis

Aurélie Hérault et al. Nature. .

Abstract

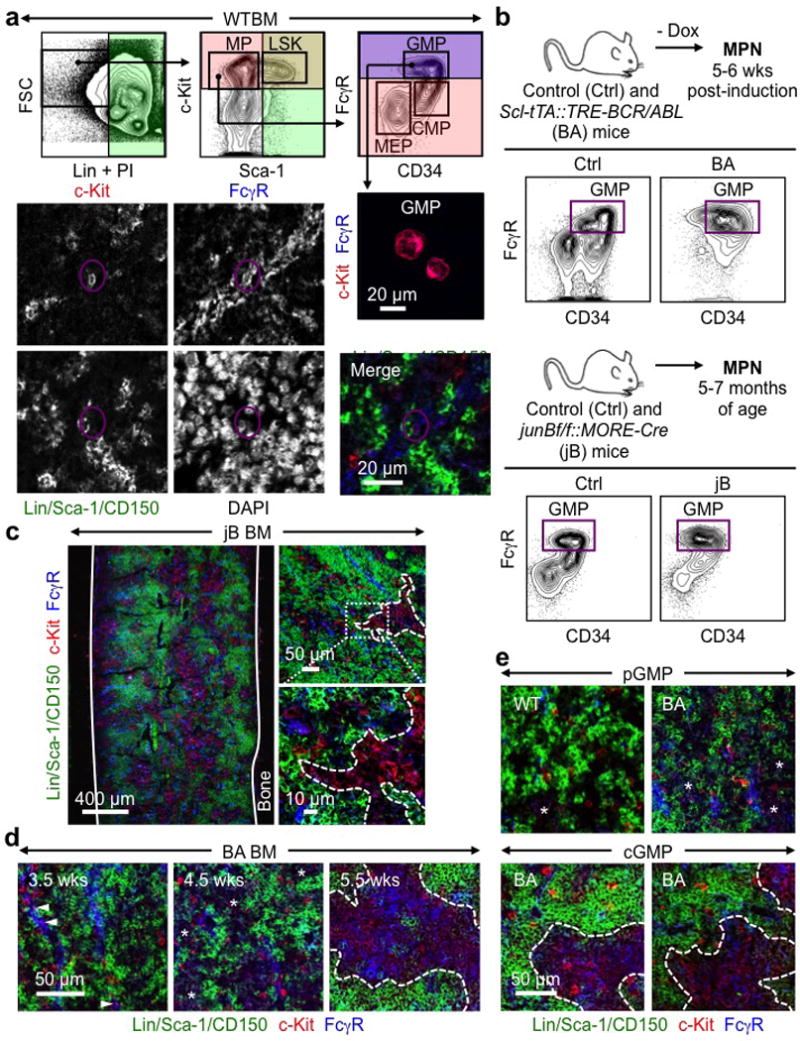
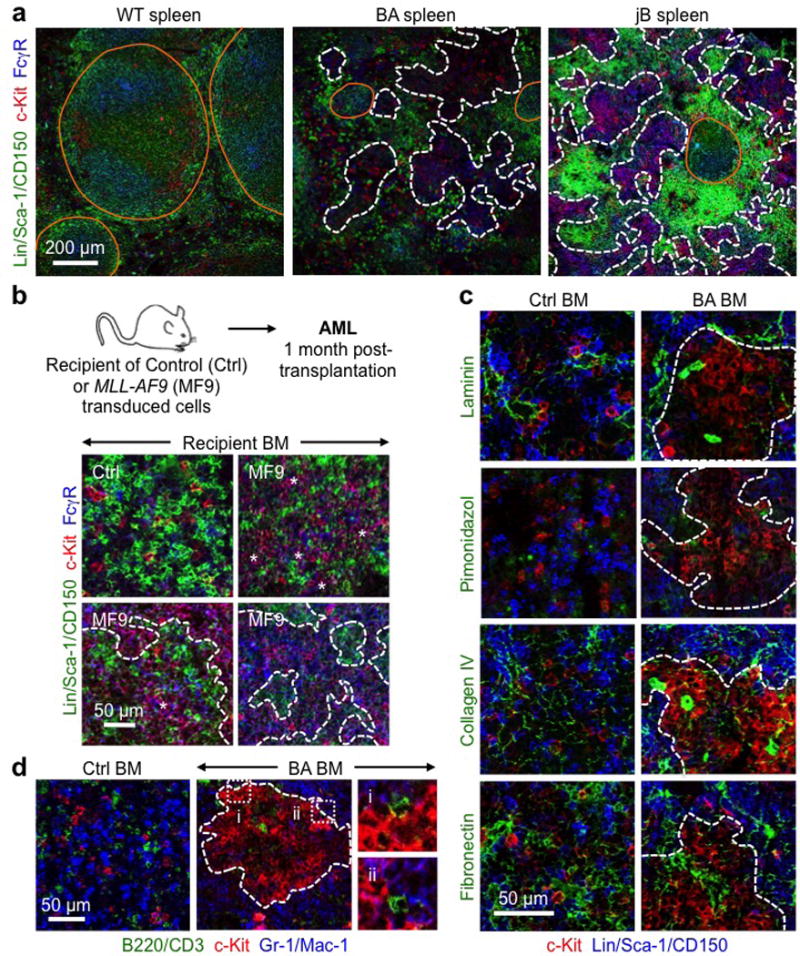
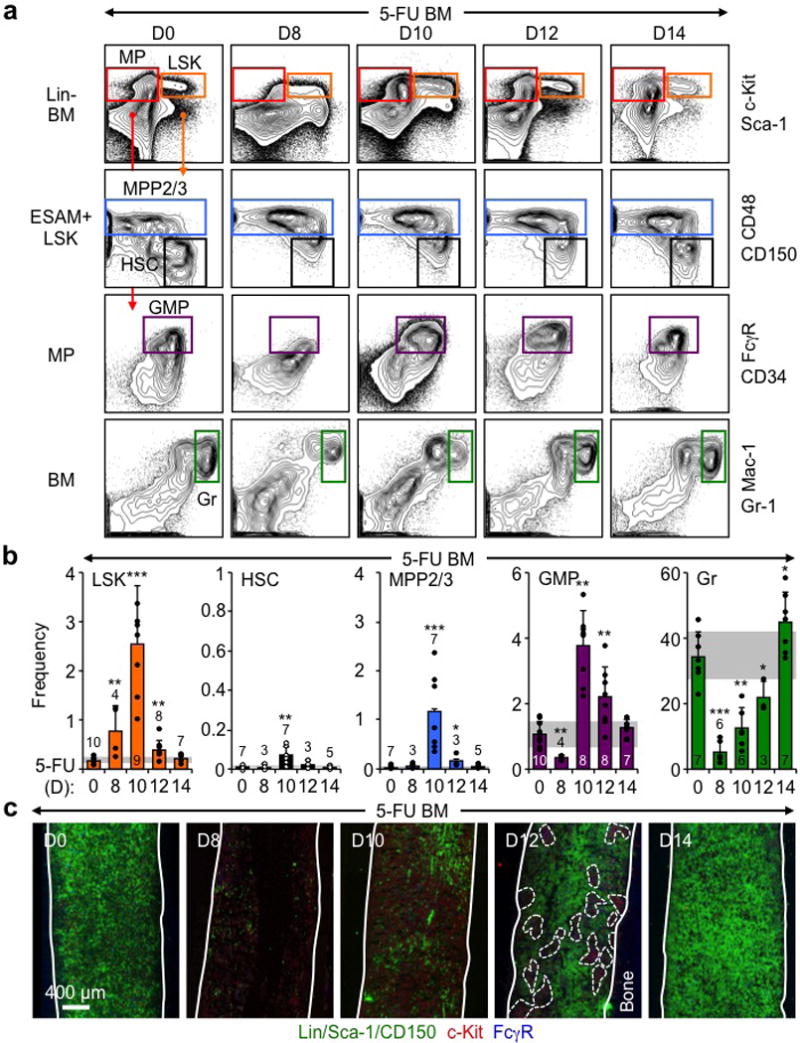
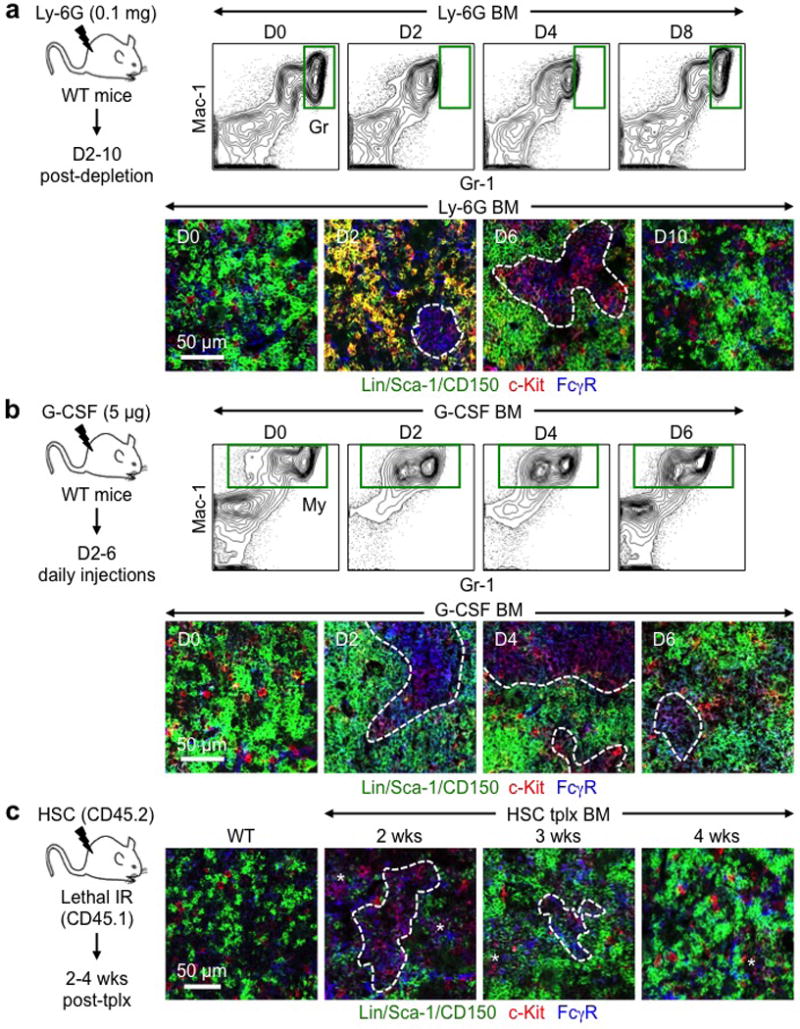
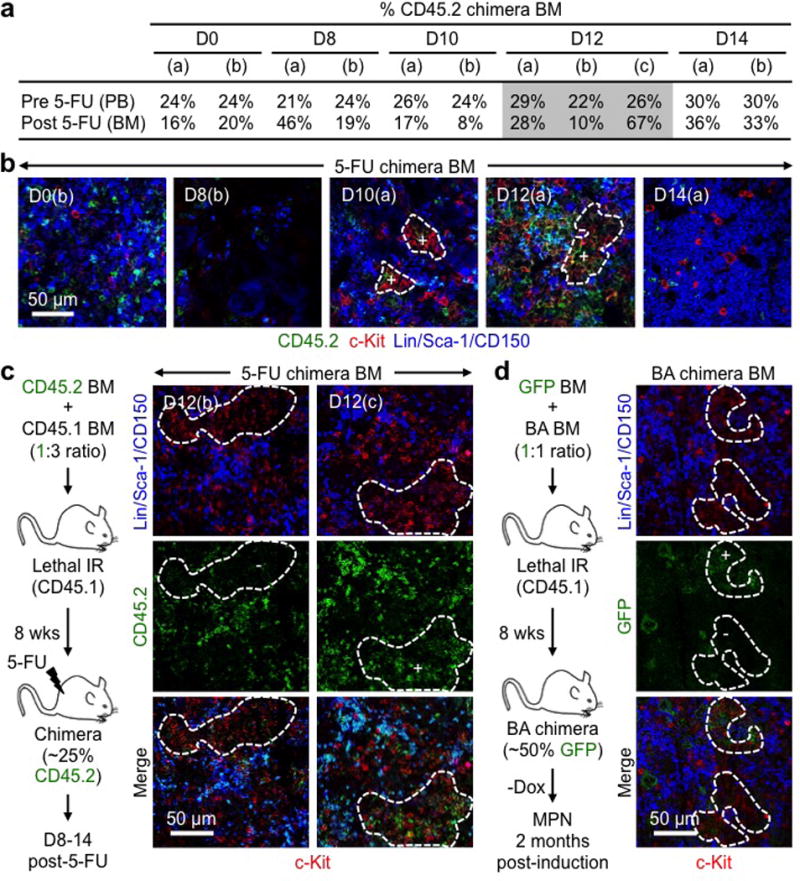
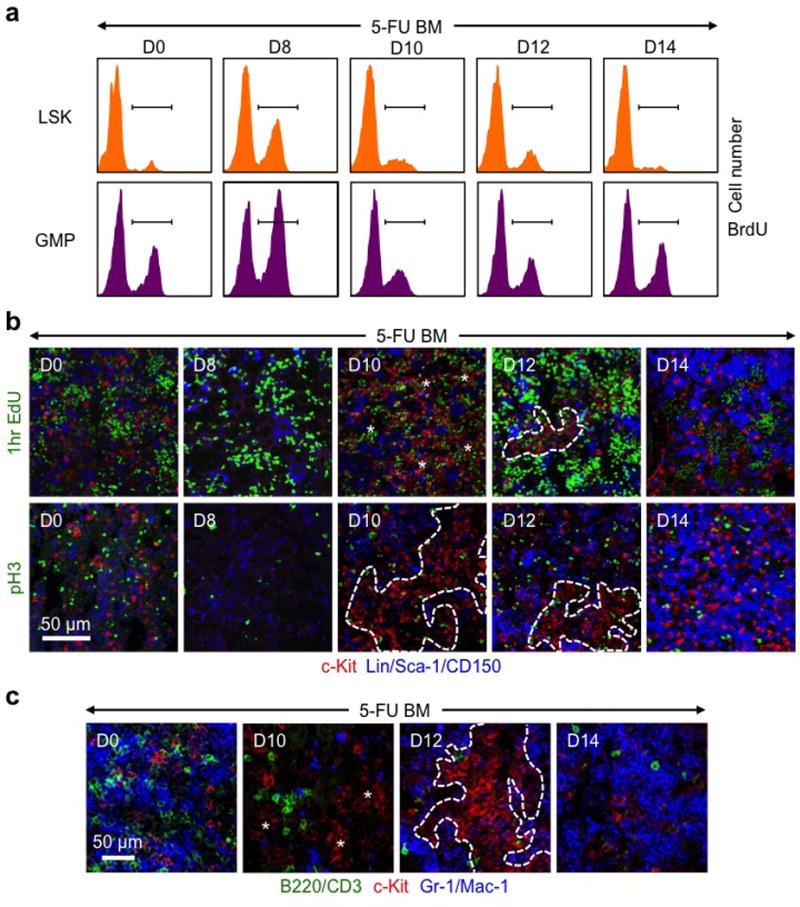
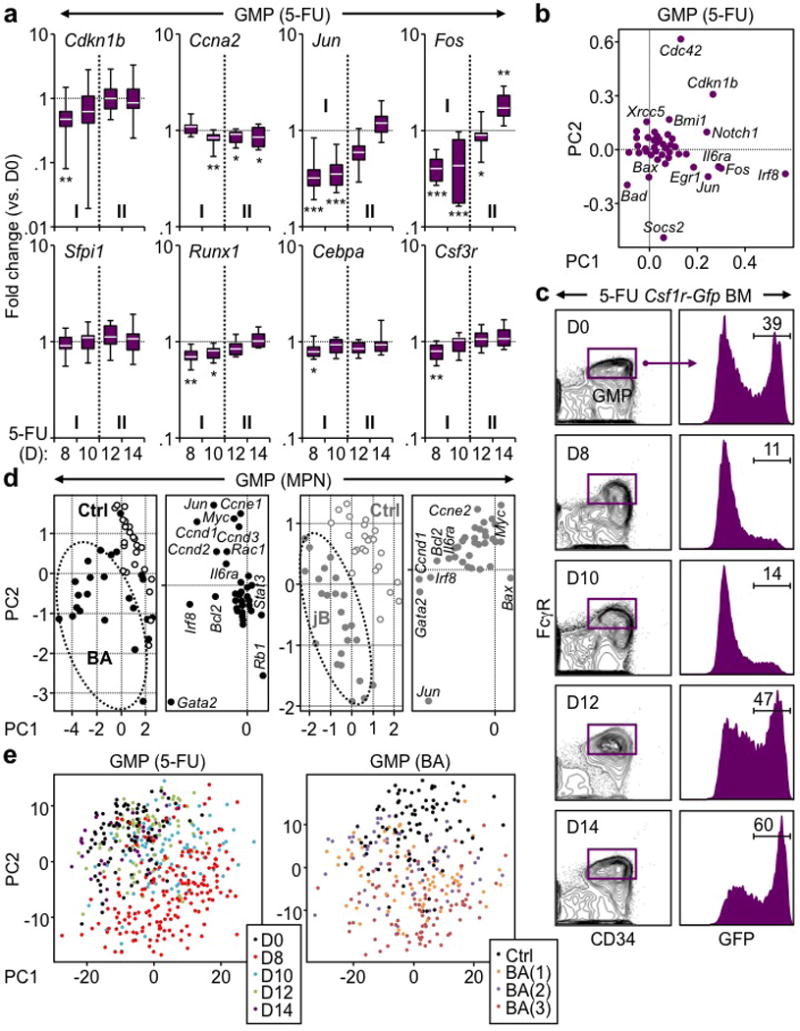
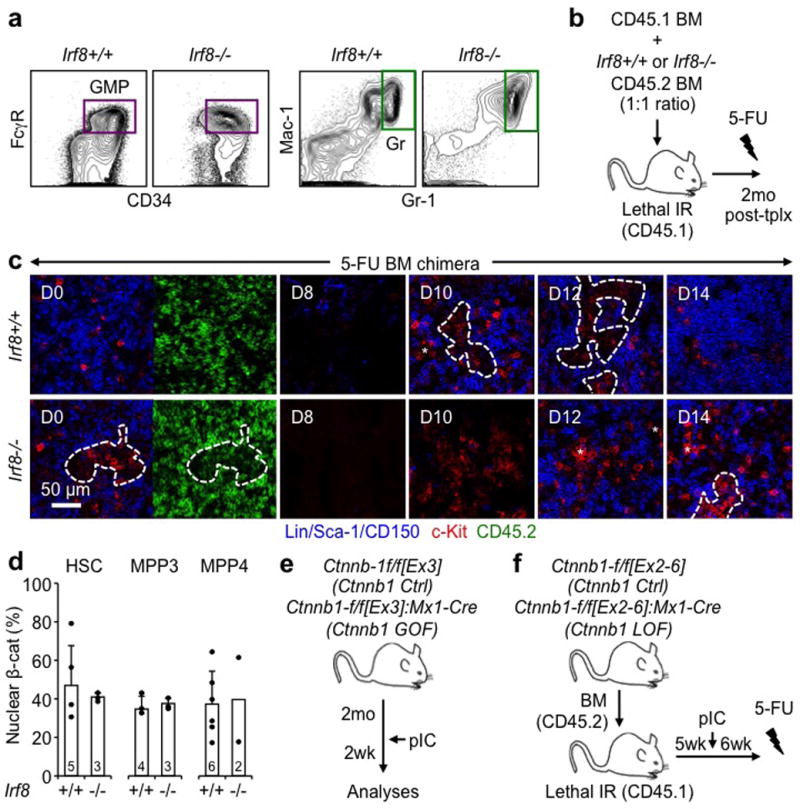
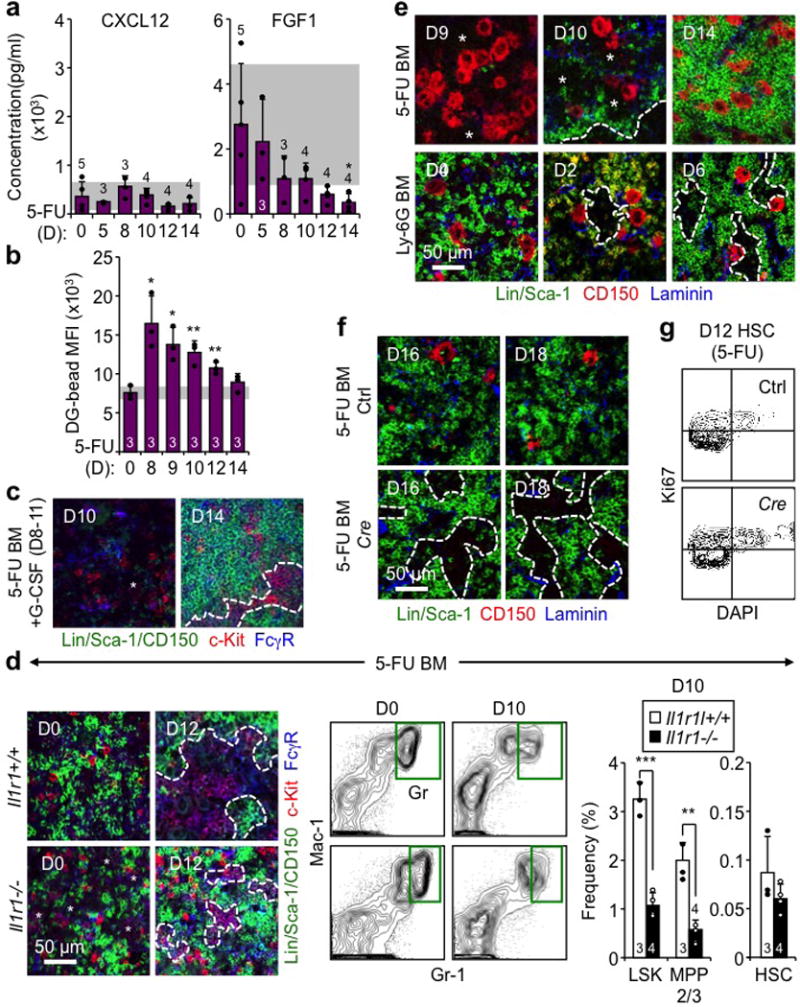
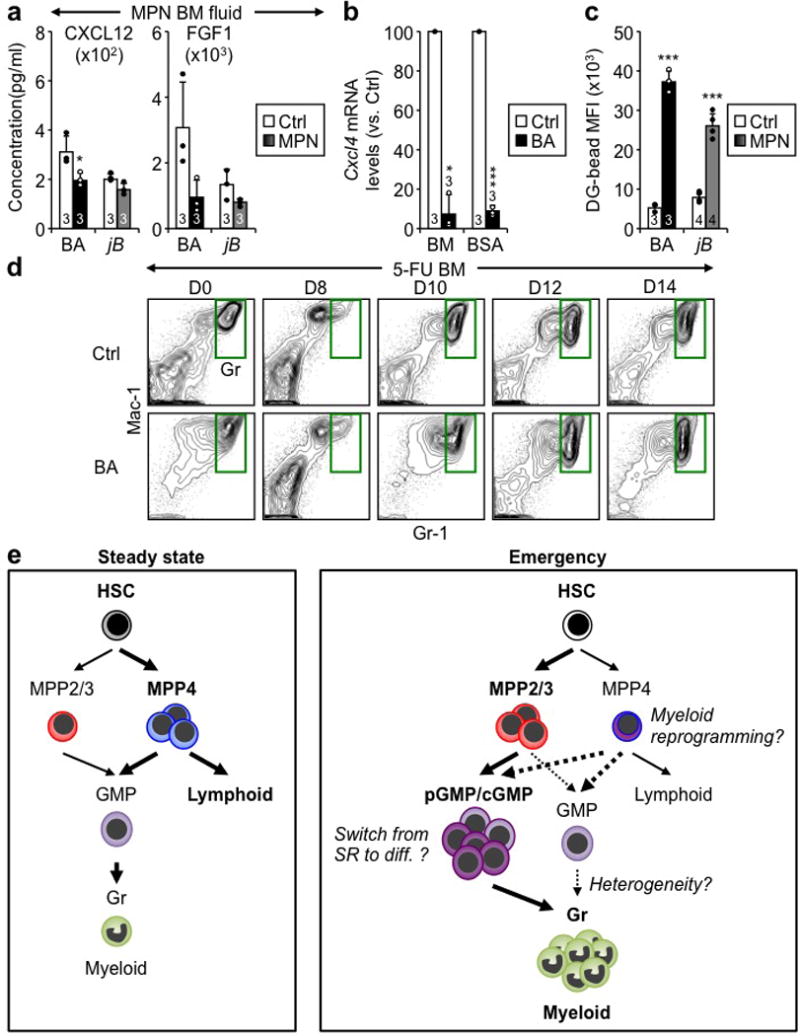
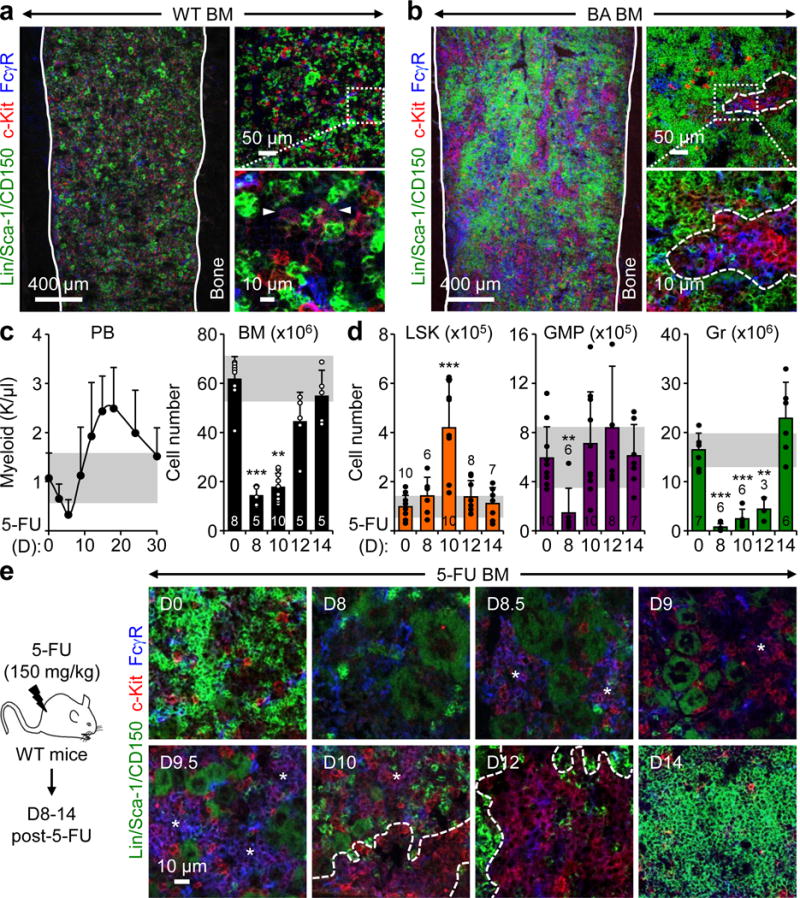
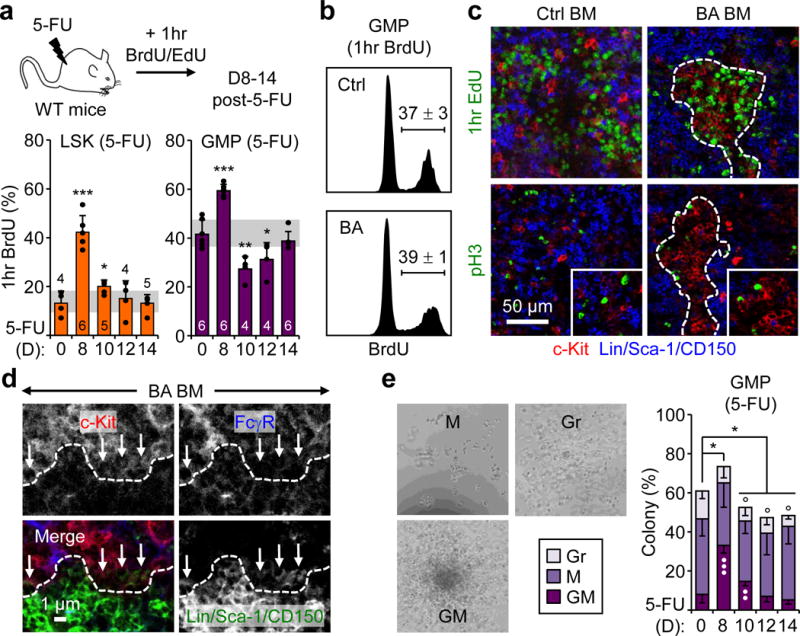
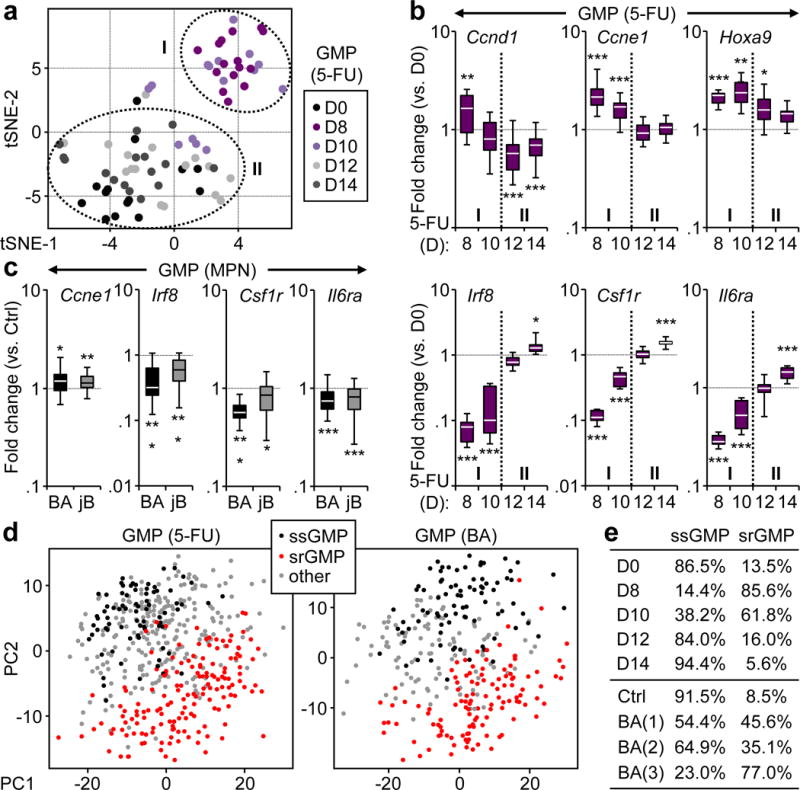
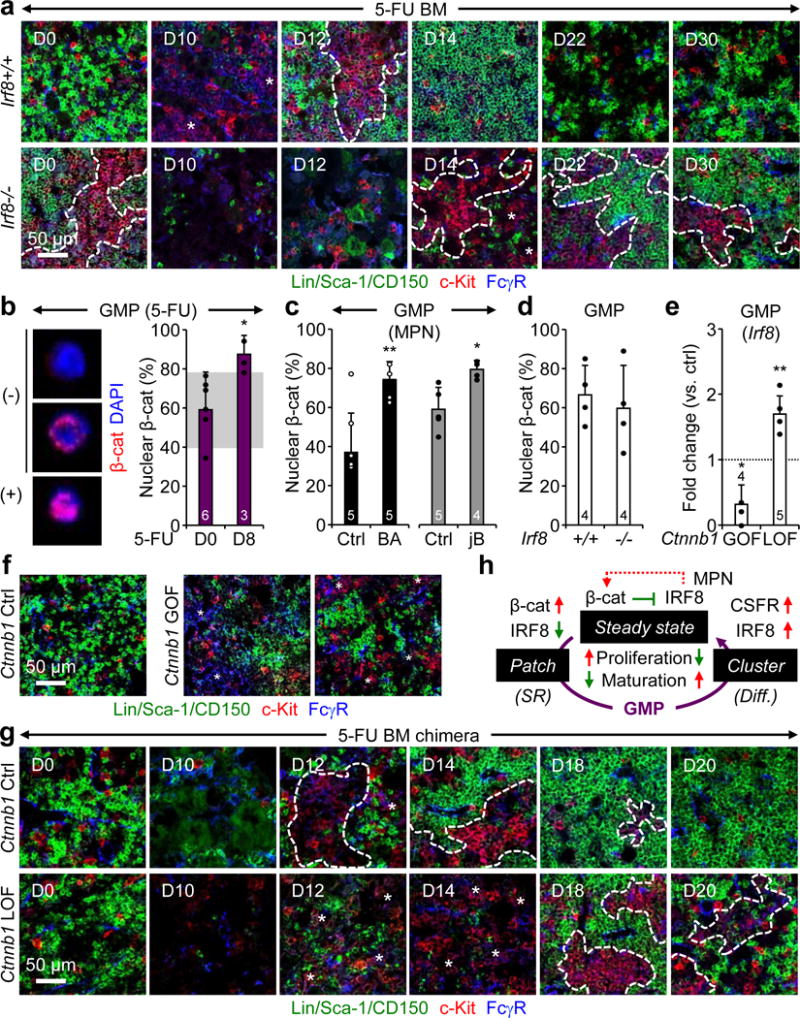
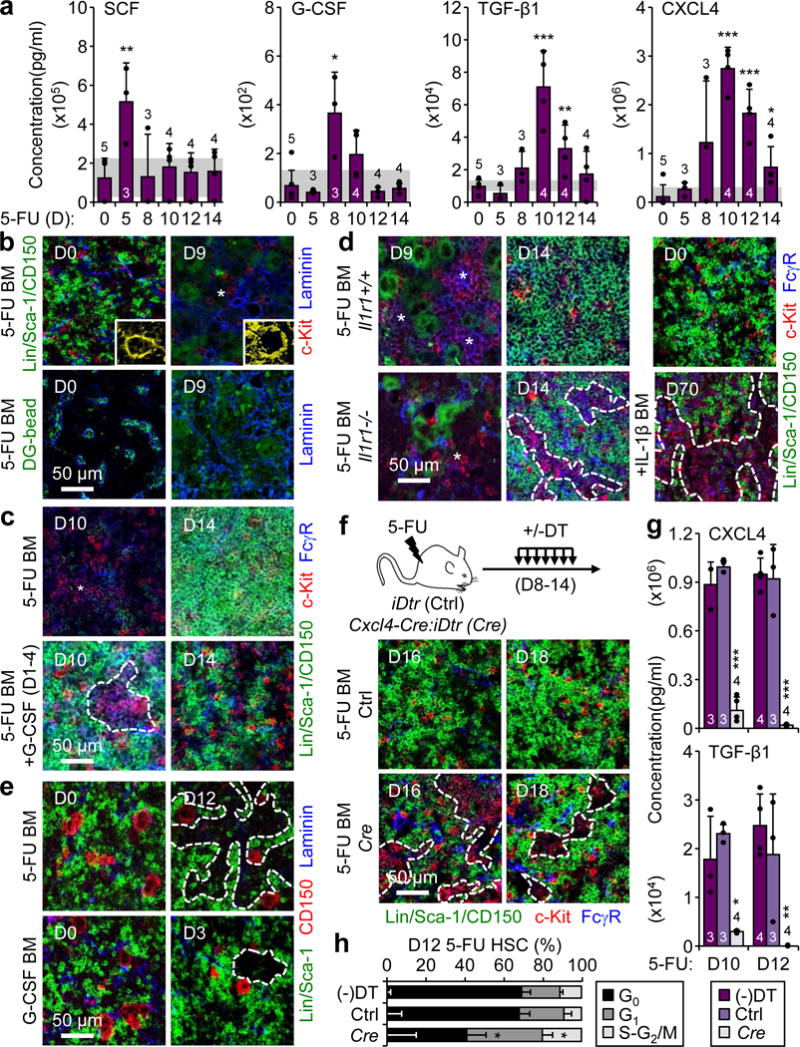
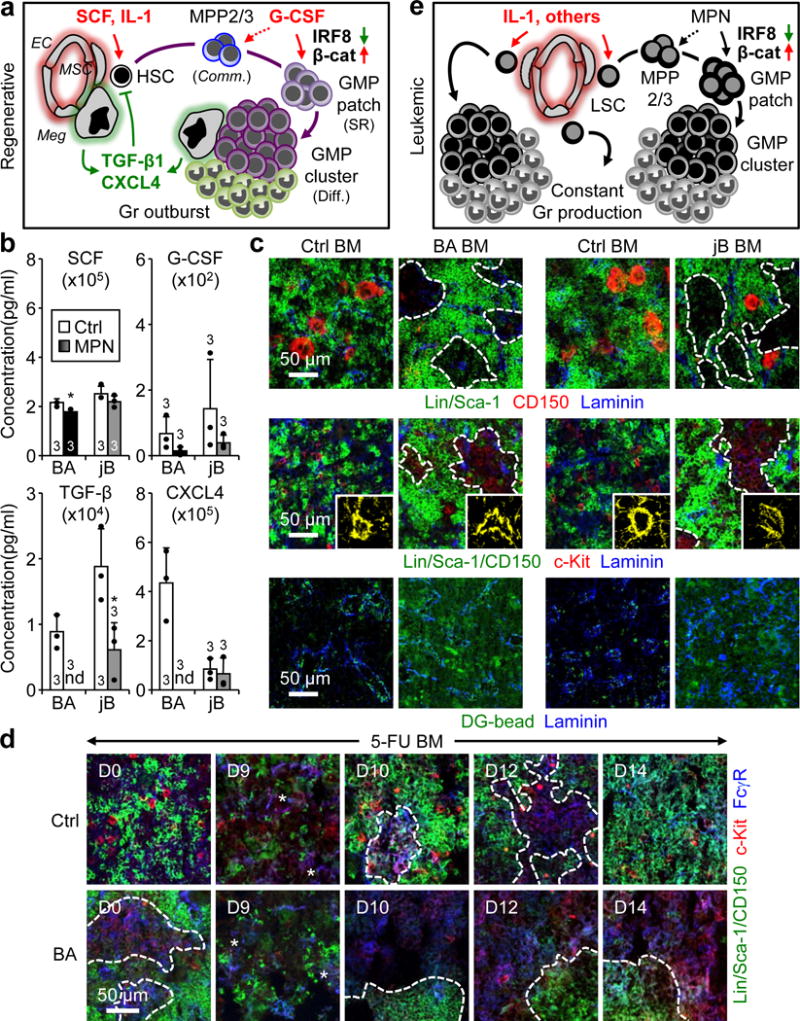
Although many aspects of blood production are well understood, the spatial organization of myeloid differentiation in the bone marrow remains unknown. Here we use imaging to track granulocyte/macrophage progenitor (GMP) behaviour in mice during emergency and leukaemic myelopoiesis. In the steady state, we find individual GMPs scattered throughout the bone marrow. During regeneration, we observe expanding GMP patches forming defined GMP clusters, which, in turn, locally differentiate into granulocytes. The timed release of important bone marrow niche signals (SCF, IL-1β, G-CSF, TGFβ and CXCL4) and activation of an inducible Irf8 and β-catenin progenitor self-renewal network control the transient formation of regenerating GMP clusters. In leukaemia, we show that GMP clusters are constantly produced owing to persistent activation of the self-renewal network and a lack of termination cytokines that normally restore haematopoietic stem-cell quiescence. Our results uncover a previously unrecognized dynamic behaviour of GMPs in situ, which tunes emergency myelopoiesis and is hijacked in leukaemia.


Conflict of interest statement

Author Information. The authors declare no competing financial interests.

Figures

Extended Data Fig. 1
Extended Data Fig. 1. Imaging GMPs in normal and leukemic conditions
a, Gating strategy used to identify GMPs showing representative FACS plots with purified GMPs (purple) stained with IF markers, and a representative WT GMP (purple circle) on bone section. b, Inducible Scl-tTA::TRE-BCR/ABL (BA) and constitutive junBflox/flox::MORE-Cre (jB) mouse models of human MPN with representative GMP FACS plots. Ctrl: control; Dox: doxycycline. c, Representative IF staining showing GMPs (purple) in the BM of diseased jB mice. d, Progression of cGMP formation with disease development in BA mice at the indicated weeks (wks) post-dox withdrawal. e, Representative examples of loose pGMPs and compact cGMPs in WT and BA mice. Solid lines indicate bone surface, dotted lines cGMPs and stars pGMPs.
Extended Data Fig. 2
Extended Data Fig. 2. GMP cluster features
a, Representative IF staining of GMPs (purple) in WT and diseased BA and jB spleens. b, cGMPs in recipient mice developing AML following transplantation of MLL-AF9 (MF9) transduced LSK-derived cells. Experimental scheme and representative IF staining of GMPs (purple) in control (Ctrl) and diseased MF9 recipient BM. Three individual recipient mice are shown for MF9. c, Representative IF staining showing MPs (red) in relation to the indicated stromal features (green) in Ctrl and diseased BA BM. d, Representative IF staining showing MPs (red) in relation to mature lymphoid (green) and myeloid (blue) cells in Ctrl and diseased BA BM. Dotted lines indicate cGMPs; i and ii highlight two magnified areas. Orange lines indicate germinal centers, arrowheads individual GMPs, stars pGMPs and dotted lines cGMPs.
Extended Data Fig. 3
Extended Data Fig. 3. Regenerating BM following 5-FU treatment
a, Gating strategy used to identify the indicated BM populations by flow cytometry in 5-FU-treated WT mice. Representative FACS plots are shown at the indicated days post-treatment. b, Frequency of BM LSK, HSC, MPP2/3, GMP and Gr at the indicated days post-5-FU treatment. c, Representative IF staining showing GMPs (purple) in 5-FU treated BM at the indicated days post-treatment. Of note, cGMPs were observed in all investigated bones (i.e., femur, tibia, humerus and sternum) at d12 post-5-FU. Solid lines indicate bone surface and dotted lines cGMPs. Results are expressed as mean ± S.D. (grey bars, reference range); *p ≤ 0.05, **p < 0.01, ***p < 0.001.
Extended Data Fig. 4
Extended Data Fig. 4. GMP clusters during myeloid regeneration and expansion
a, Gr depletion in the BM of Ly-6G-treated mice with experimental scheme and representative FACS plots and IF staining of GMPs (purple) at the indicated days post-treatment. b, Gr expansion in the BM of G-CSF-treated mice with experimental scheme and representative FACS plots and IF staining of GMPs (purple) at the indicated days post-treatment. c, GMP clusters in the BM of HSC-transplanted mice with experimental scheme and representative IF staining of GMPs (purple) at the indicated weeks (wks) post-transplantation. Non-transplanted WT BM is shown for comparison. Dotted lines indicate cGMPs and stars pGMPs.
Extended Data Fig. 5
Extended Data Fig. 5. GMP clusters are clonal
a–c, Clonality of regenerative GMP clusters: (a) Percent CD45.2+ cells in the peripheral blood (PB) pre- and BM post-5-FU treatment for each of the chimera mice used at the indicated days post-treatment (n = 2–3 mice/group); (b) Representative IF staining showing MPs (red) and CD45.2 (green) expression in 5-FU-treated chimera BM at the indicated days post-treatment; and (c) experimental scheme and representative IF staining showing MPs (red) and CD45.2 (green) expression separately in two independent d12 5-FU-treated chimera BM. Positive (+) clusters have ≥ 75% CD45.2+ cells and negative (−) clusters ≤ 5% CD45.2+ cells. Wks: weeks. d, Clonality of leukemic GMP clusters with experimental scheme and representative IF staining showing MPs (red) and GFP (green) expression from β-actin-Gfp cells in diseased BA chimera BM. Positive (+) clusters have ≥ 75% GFP+ cells and negative (-) clusters ≤ 5% GFP+ cells. Dotted lines indicate cGMPs.
Extended Data Fig. 6
Extended Data Fig. 6. Dynamic proliferation and differentiation in regenerating GMP clusters
a, Representative FACS plots showing kinetics of BrdU incorporation in LSKs and GMPs from 5-FU-treated WT mice at the indicated days post-treatment. b, Representative IF staining showing MPs (red) in relation to proliferating EdU+ (green, upper row) and dividing pH3+ (green, lower row) cells in 5-FU-treated WT BM at the indicated days post-treatment. c, Representative IF staining showing MPs (red) in relation to mature lymphoid (green) and myeloid (blue) cells in 5-FU-treated WT BM at the indicated days post-treatment.
Extended Data Fig. 7
Extended Data Fig. 7. Molecular reprogramming in regenerating and leukemic GMP clusters
a, Additional Fluidigm gene expression analyses of regenerating GMPs isolated from 5-FU-treated WT mice at the indicated days post-treatment (n = 2; 10–16 pools of 100 cells/condition). Results are expressed as fold change compared to levels in untreated (D0) GMPs and presented as boxplots (line: median; box: 25th and 75th percentiles; whisker: 90th and 10th percentiles). b, Loading association of principal component (PC) analyses of Fluidigm gene expression data from regenerating GMPs. c, Representative FACS plots of GFP expression in GMPs of 5-FU-treated Csf1r-Gfp reporter mice at the indicated days post-treatment. d, tSNE analyses and loading association of PC analyses of Fluidigm gene expression data from MPN GMPs isolated from diseased BA, jB and respective age-matched Ctrl mice (n = 4; 22–28 pools of 100 cells/condition). e, PC analyses of single cell GMP RNA-Seq data showing the distribution of each 5-FU time points (D0: 89 cells; D8: 187 cells; D10: 89 cells; D12: 75 cells; D14: 36 cells) and individual Ctrl (94 cells) and BA (BA(1): 68 cells; BA(2): 57 cells; BA(3): 87 cells) mice.
Extended Data Fig. 8
Extended Data Fig. 8. Irf8 and β-catenin function in self-renewing GMPs
a, Representative FACS plots showing GMPs and Grs at steady state in Irf8+/+ and Irf8−/− mice. b, Experimental scheme for Irf8+/+ and Irf8−/− BM chimeric mice. c, Representative IF staining of donor-derived CD45.2+ (green) MP (red) in 5-FU-treated Irf8+/+ and Irf8−/− BM chimeric mice. d, Nuclear β-catenin in HSCs, MPP3 and MPP4 from Irf8+/+ and Irf8−/− mice. Results are expressed as percent positive cells. e, f, Experimental scheme for Ctnnb1 Ctrl and Ctnnb1 (e) loss-of-function (LOF) or (f) gain-of-function (GOF) mice. Stars indicate pGMPs and dotted lines cGMPs. Results are expressed as mean ± S.D.
Extended Data Fig. 9
Extended Data Fig. 9. Mechanisms controlling GMP cluster formation during regeneration
a, ELISA measurement of cytokine levels in BM fluids of 5-FU-treated WT mice at the indicated days post-treatment. b, Quantification of vascular leakage in 5-FU-treated BM at the indicated days post-treatment. Results are expressed as dragon green (DG) microsphere MFI upon masking of laminin+ blood vessels. c, Representative IF staining showing GMPs (purple) in 5-FU-treated BM with concomitant daily injections of G-CSF (+G) on d8-11. d, Investigation of 5-FU-treated Il1r1+/+ and Il1r1−/− mice at the indicated days post-treatment showing representative IF staining of GMPs (purple), FACS plots of Gr regeneration, and quantification of the indicated BM populations. e, Representative IF staining of CD150+ megakaryocytes (red) in 5-FU- and Ly-6G-treated BM. f, g, Megakaryocyte depletion studies in diphtheria toxin (DT) injected iDtr (Ctrl) and Cxcl4-Cre:iDtr (Cre) mice showing (f) representative IF staining of CD150+ megakaryocytes (red) at the indicated days post-5-FU, and (g) representative Ki67/DAPI staining of HSCs at d12 post-5-FU. Stars indicate pGMPs and dotted lines cGMPs. Results are expressed as mean ± S.D. (grey bars, reference range); *p ≤ 0.05; **p ≤ 0.01, ***p ≤ 0.001.
Extended Data Fig. 10
Extended Data Fig. 10. Deregulated GMP cluster formation in leukemic mice
a, ELISA measurements of cytokine levels in BM fluids of BA, jB and respective Ctrl mice. b, qRT-PCR measurement of Cxcl4 expression in BM and Meg-enriched BSA gradient of Ctrl and BA mice. c, Quantification of vascular leakage in diseased BA, jB and respective Ctrl BM. Results are quantified as dragon green (DG) microsphere MFI upon masking of laminin+ blood vessels. d, Representative FACS plots showing Gr regeneration in 5-FU-treated Ctrl and BA mice at the indicated days post-treatment. e, Revised model of emergency myelopoiesis. At steady state, blood production reflects the differential generation by HSCs of a small number of myeloid-biased MPP2/3 and a large number of lymphoid-biased MPP4, which both give rise to GMPs and contribute to myeloid output. In contrast, in emergency situations, HSCs are induced to overproduce MPP2/3, and MPP4 are reprogrammed towards almost exclusive myeloid output in large part due to cytokine stimulations and the triggering of specific regulatory pathways. An important consequence of the activation of this myeloid regeneration axis is the generation of localized pGMP/cGMP differentiation foci in the BM cavity, which drive the overproduction of granulocytes. This entire process is tightly regulated by BM niche signals and is transient during emergency myelopoiesis, but is constantly activated in myeloid leukemia. Important emerging questions are what controls the switch from self-renewing (SR) pGMP to differentiating (diff.) cGMP clusters, if expanded MPP2/3 and myeloid-reprogrammed MPP4 also generate pGMP/cGMPs or continue to produce regular GMPs (dotted lines), and whether Grs produced through this regeneration axis functionally differ from steady state Grs (heterogeneity). Results are expressed as mean ± SD; *p ≤ 0.05, ***p ≤ 0.001.
Figure 1
Figure 1. GMP clusters in leukemic and regenerative myelopoiesis
a, b, Representative IF staining showing GMPs (purple) in the BM of (a) wild type (WT), and (b) diseased Scl-tTA:TRE-BCR/ABL (BA) mice. Solid lines indicate bone surface, dotted lines cGMPs and arrowheads individual GMPs. c, PB (n = 5) and BM regeneration in 5-FU-treated WT mice. d, Changes in hematopoietic populations at the indicated days post 5-FU treatment. e, Representative IF staining showing GMPs (purple) in the BM of 5-FU -treated mice. Stars indicate pGMPs and dotted lines cGMPs. Results are expressed as mean ± S.D. (grey bars, reference range); **p < 0.01, ***p < 0.001.
Figure 2
Figure 2. GMP clusters are foci of differentiation
a, Proliferation in 5-FU-treated WT mice showing experimental scheme and BrdU incorporation in LSKs and GMPs. b, BrdU incorporation in GMPs from Ctrl and BA mice (n = 3). c, Representative IF staining showing MPs (red) in relation to proliferating EdU+ (green, upper row) and dividing pH3+ (green, lower row) cells in Ctrl and BA BM. d, Representative IF staining of GMP cluster periphery (dotted lines) highlighting differentiating GMPs (arrows) as they lose FcγR expression and gain lineage marker expression. e, Single-cell clonogenic methylcellulose analyses of GMPs isolated from 5-FU-treated WT mice (n = 4; *, vs. plating efficiency; •, vs. GM colonies; °, vs. M colonies). Results are percent colony type and pictures show representative colonies. GM: granulocyte/macrophage, Gr: granulocyte, and M: macrophage, colonies. Stars indicate pGMPs and dotted lines cGMPs. Results are expressed as mean ± S.D. (grey bars, reference range); *p ≤ 0.05, **p ≤ 0.01, ***p ≤ 0.001.
Figure 3
Figure 3. Molecular mechanisms of GMP cluster formation
a, tSNE analyses of Fluidigm gene expression data from GMPs isolated from 5-FU-treated WT mice (n = 2; 10–16 pools of 100 cells/condition). b, Selected genes from Fluidigm analyses shown in (a). Results are expressed as fold change compared to levels in d0 GMPs and presented as boxplots (line: median; box: 25th and 75th percentiles; whisker: 90th and 10th percentiles). c, Selected genes from Fluidigm analyses of GMPs isolated from BA, jB and respective age-matched Ctrl mice (n = 4; 22–28 pools of 100 cells/condition). Results are expressed as fold change compared to levels in respective Ctrl GMPs and presented as in (b). d, PC analyses of single cell RNA-Seq data from GMPs isolated from 5-FU-treated WT mice (476 single cells) and BA mice (306 single cells). e, frequency of steady state GMP (ssGMP) and self-renewing GMPs (srGMP) in 5-FU-treated WT mice, and Ctrl and BA mice. *p ≤ 0.05; **p ≤ 0.01, ***p ≤ 0.001.
Figure 4
Figure 4. Irf8/β-catenin self-renewal progenitor network
a, Representative IF staining of GMPs (purple) in 5-FU-treated Irf8+/+ and Irf8−/− BM. b–d, Nuclear β-catenin in (b) GMPs from d8 5-FU-treated WT mice with representative negative (−) and positive (+) staining shown for d0 GMPs, (c) GMPs from BA, jB and respective age-matched Ctrl mice, and (d) GMPs from Irf8+/+ and Irf8−/− mice. Results are expressed as percent positive cells. e, Irf8 expression in GMPs from Ctnnb1 gain-of-function (GOF) and loss-of-function (LOF) mice. f, Representative IF staining of GMPs (purple) in Ctnnb1 Ctrl and GOF BM. g, Representative IF staining of GMPs (purple) in 5-FU-treated Ctnnb1 Ctrl and LOF BM. h, Model of the molecular network controlling pGMP self-renewal (SR) and cGMP differentiation (diff.). Red indicates activation and green suppression, with dotted line highlighting re-enforcing pathways in MPNs. Stars indicate pGMPs and dotted lines cGMPs. Results are expressed as mean ± S.D. (grey bars, reference range); *p ≤ 0.05; **p ≤ 0.01, ***p ≤ 0.001.
Figure 5
Figure 5. BM niche controls of GMP cluster formation during regenerative myelopoiesis
a, ELISA cytokine measurements in BM fluids of 5-FU-treated WT mice. b, Representative IF staining showing vasculature (blue, pseudo-colored in yellow in magnified inserts) and vascular leakage (green, dragon green (DG) microsphere diffusion assay) in 5-FU-treated BM. c, Representative IF staining showing GMPs (purple) in 5-FU-treated BM, with or without concomitant daily injections of G-CSF (+G) on d1-4. d, Representative IF staining of GMPs (purple) in Il1r1+/+ and Il1r1−/− 5-FU-treated BM, or BM of IL-1β-injected WT mice. e, Representative IF staining showing CD150+ megakaryocytes (red) in 5-FU- and G-CSF-treated WT BM. f–h, Megakaryocyte depletion studies in diphtheria toxin (DT) injected iDtr (Ctrl) and Cxcl4-Cre:iDtr (Cre) mice, and non-injected Ctrl mice [(−)DT]: (f) experimental scheme and representative IF staining of GMPs (purple) in 5-FU-treated BM, (g) ELISA cytokine measurements in BM fluids at d10 and d12, and (h) HSC cell cycle distribution at d12 (n = 3). Stars indicate pGMPs and dotted lines cGMPs. Results are expressed as mean ± S.D. (grey bars, reference range); *p ≤ 0.05; **p ≤ 0.01, ***p ≤ 0.001.
Figure 6
Figure 6. Continuous GMP cluster formation in leukemic myelopoiesis
a, Model of regenerative myelopoiesis. EC: endothelial cells; MSC: mesenchymal stromal cells; Meg: megakaryocytes; Comm.: commitment; SR: self-renewal; Diff.: differentiation. Red indicates activation and green suppression. b, ELISA cytokine measurements in BM fluids of diseased BA, jB and respective Ctrl mice. c, Representative IF staining showing CD150+ megakaryocytes (red), vasculature (blue, pseudo-colored in yellow in magnified inserts) and vascular leakage (green, DG microsphere diffusion assay) in BA, jB and respective Ctrl BM. d, Representative IF staining of GMPs (purple) 5-FU-treated Ctrl and BA BM. e, Model of leukemic myelopoiesis. LSC: leukemia-initiating stem cells. Stars indicate pGMPs and dotted lines cGMPs. Results are expressed as mean ± S.D.; *p ≤ 0.05.

Comment in

References

    1. Sun J, et al. Clonal dynamics of native haematopoiesis. Nature. 2014;514:322–327. - PMC - PubMed
    1. Busch K, et al. Fundamental properties of unperturbed haematopoiesis from stem cells in vivo. Nature. 2015;518:542–546. - PubMed
    1. Cabezas-Wallscheid N, et al. Identification of regulatory networks in HSC and their immediate progeny via integrated proteome, transcriptome, and DNA methylome analysis. Cell Stem Cell. 2014;15:507–522. - PubMed
    1. Pietras EM, et al. Functionally distinct subsets of lineage-biased multipotent progenitors control blood production in normal and regenerative conditions. Cell Stem Cell. 2015;17:35–46. - PMC - PubMed
    1. Akashi K, Traver D, Miyamoto T, Weissman IL. A clonogenic common myeloid progenitor that gives rise to all myeloid lineages. Nature. 2000;404:193–197. - PubMed

Publication types