. 2017 Mar 29;12(3):e0174598.
doi: 10.1371/journal.pone.0174598. eCollection 2017.

Genome-wide association analysis identifies resistance loci for bacterial blight in a diverse collection of indica rice germplasm

Affiliations

Genome-wide association analysis identifies resistance loci for bacterial blight in a diverse collection of indica rice germplasm

Fan Zhang et al. PLoS One. .

Abstract

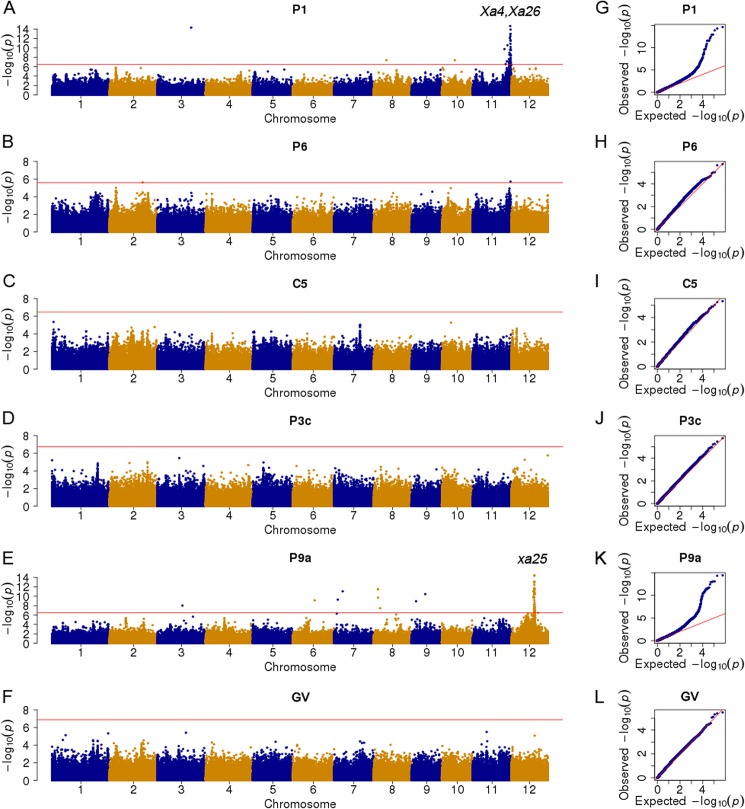
Bacterial blight, which is caused by Xanthomonas oryzae pv. oryzae (Xoo), is one of the most devastating rice diseases worldwide. The development and use of disease-resistant cultivars have been the most effective strategy to control bacterial blight. Identifying the genes mediating bacterial blight resistance is a prerequisite for breeding cultivars with broad-spectrum and durable resistance. We herein describe a genome-wide association study involving 172 diverse Oryza sativa ssp. indica accessions to identify loci influencing the resistance to representative strains of six Xoo races. Twelve resistance loci containing 121 significantly associated signals were identified using 317,894 single nucleotide polymorphisms, which explained 13.3-59.9% of the variability in lesion length caused by Xoo races P1, P6, and P9a. Two hotspot regions (L11 and L12) were located within or nearby two cloned R genes (xa25 and Xa26) and one fine-mapped R gene (Xa4). Our results confirmed the relatively high resolution of genome-wide association studies. Moreover, we detected novel significant associations on chromosomes 2, 3, and 6-10. Haplotype analyses of xa25, the Xa26 paralog (MRKc; LOC_Os11g47290), and a Xa4 candidate gene (LOC_11g46870) revealed differences in bacterial blight resistance among indica subgroups. These differences were responsible for the observed variations in lesion lengths resulting from infections by Xoo races P1 and P9a. Our findings may be relevant for future studies involving bacterial blight resistance gene cloning, and provide insights into the genetic basis for bacterial blight resistance in indica rice, which may be useful for knowledge-based crop improvement.


Conflict of interest statement

Competing Interests: The authors have declared that no competing interests exist.

Figures

Fig 1
Fig 1. Susceptible and resistant reactions of a whole population and six subpopulations of 172 indica accessions inoculated with representative strains of six Xanthomonas oryzae pv. oryzae (Xoo) races from China and the Philippines.
(A) Hierarchical cluster of accessions and races based on lesion length (LL). (B) Number of accessions in the following reactions to six Xoo races: resistant (LL < 5 cm), moderately resistant (5 cm ≤ LL < 10 cm), moderately susceptible (10 cm ≤ LL < 15 cm), and susceptible (LL ≥ 15 cm). (C) Boxplots for LLs following infections by six Xoo races in three indica subgroups divided by population structure analysis results. Box edges represent the 0.25 and 0.75 quantiles with median values indicated by bold lines. ‘***’ refers to a significant difference in the average LLs among the indica subgroups (p < 0.001). We used the following Xoo races: C5 (strain GD1358) and GV (strain V) from China, and P1 (strain PXO61), P3c (strain PXO340), P9a (strain PXO339), and P6 (strain PXO99) from the Philippines.
Fig 2
Fig 2. Manhattan and quantile-quantile plots for a genome-wide association study of bacterial blight resistance in indica rice.
(A, G) P1 (strain PXO61). (B, H) P6 (strain PXO99). (C, I) C5 (strain GD1358). (D, J) P3c (strain PXO340). (E, K) P9a (strain PXO339). (F, L) GV (strain V). The strength of the associations for the lesion lengths caused by six Xanthomonas oryzae pv. oryzae (Xoo) strains is indicated as the negative logarithm of the p value for the linear mixed effects model. Based on 1000 permutation tests, the genome-wide significance thresholds (i.e., horizontal red lines in all Manhattan plots) at a significance level of 0.05 were P = 3.49 × 10⁻⁷, 1.82 × 10⁻⁷, 2.58 × 10⁻⁶, 3.15 × 10⁻⁷, 3.50 × 10⁻⁷, and 1.34 × 10⁻⁷ for P1, P3c, P6, P9a, C5, and GV, respectively.
Fig 3
Fig 3. Hotspot region for the resistance to Xanthomonas oryzae pv. oryzae race P9a and haplotype analysis of the peak associated with the gene on chromosome 12.
(A) Local Manhattan plot (top) (16.5–17.5 Mb) and linkage disequilibrium heatmap (bottom) (17.2–17.5 Mb) surrounding the hotspot region on chromosome 12. The arrow indicates the position of the peak single nucleotide polymorphism (SNP) located in xa25 (LOC_Os12g29220). Dashed lines indicate the xa25 region. (B) Gene structure and haplotype analysis of xa25 in 140 accessions based on five significant SNPs in xa25. Haplotypes with fewer than five accessions are not shown. (C) Lesion lengths caused by P9a infections of accessions in three haplotypes of xa25 in different indica subgroups. Box edges represent the 0.25 and 0.75 quantiles with median values indicated by bold lines. Whiskers extend to data no more than 1.5-times the interquartile range, and the remaining data are represented by dots. ‘***’ refers to a significant difference based on Duncan’s multiple comparison tests (p < 0.001).
Fig 4
Fig 4. Hotspot region for the resistance to Xanthomonas oryzae pv. oryzae race P1 and haplotype analysis of the peak associated with the gene on chromosome 11.
(A) Local Manhattan plot (top) (23–29 Mb) and linkage disequilibrium heatmap (bottom) (28.0–28.8 Mb) surrounding the hotspot region on chromosome 11. Red arrows and points indicate the positions of the peak single nucleotide polymorphisms located in the Xa4 candidate gene (i.e., LOC_Os11g46870) and Xa26 paralog (i.e., LOC_Os11g47290), respectively. Dashed lines indicate the xa25 region. (B) Gene structure and haplotype analysis of the Xa4 candidate gene (i.e., LOC_Os11g46870). (C) Gene structure and haplotype analysis of the Xa26 paralog (i.e., LOC_Os11g47290). Lesion lengths caused by P1 infections of accessions in three haplotypes of LOC_Os11g46870 (D) and LOC_Os11g47290 (E) in different indica subgroups. ‘***’ refers to a significant difference based on Duncan’s multiple comparison tests (p < 0.001).

Similar articles

Cited by

References

    1. Nino-Liu DO, Ronald PC, Bogdanove AJ. Xanthomonas oryzae pathovars: model pathogens of a model crop. Mol Plant Pathol. 2006;7(5):303–24. 10.1111/j.1364-3703.2006.00344.x - DOI - PubMed
    1. Zhang Q. Genetic evaluation and utilization of resistance to rice bacterial blight in China. Scientia Agricultura Sinica. 1991;24(2):26–36.
    1. Khush GS, Mackill DJ, Sidhu GS. Breeding rice for resistance to bacterial blight In: Banta SJ, editor. Bacterial Blight of Rice. Los Banos, Philippines: International Rice Research Institute; 1989. p. 207–17.
    1. Ogawa T. Methods and strategy for monitoring race distribution and identification of resistance genes to bacterial leaf blight (Xanthomonas campetris pv. oryzae) in rice. JARQ-Japan Agricultural Research Quarterly. 1993;27:71–80.
    1. Mew TW. Current status and future prospects of research on bacterial blight of rice. Annual Review of Phytopathology. 1987;25:359–82.

MeSH terms