. 2017 Mar 28;112(6):1085-1093.
doi: 10.1016/j.bpj.2017.01.025.

Ephemeral Protein Binding to DNA Shapes Stable Nuclear Bodies and Chromatin Domains

Affiliations

Ephemeral Protein Binding to DNA Shapes Stable Nuclear Bodies and Chromatin Domains

Chris A Brackley et al. Biophys J. .

Abstract

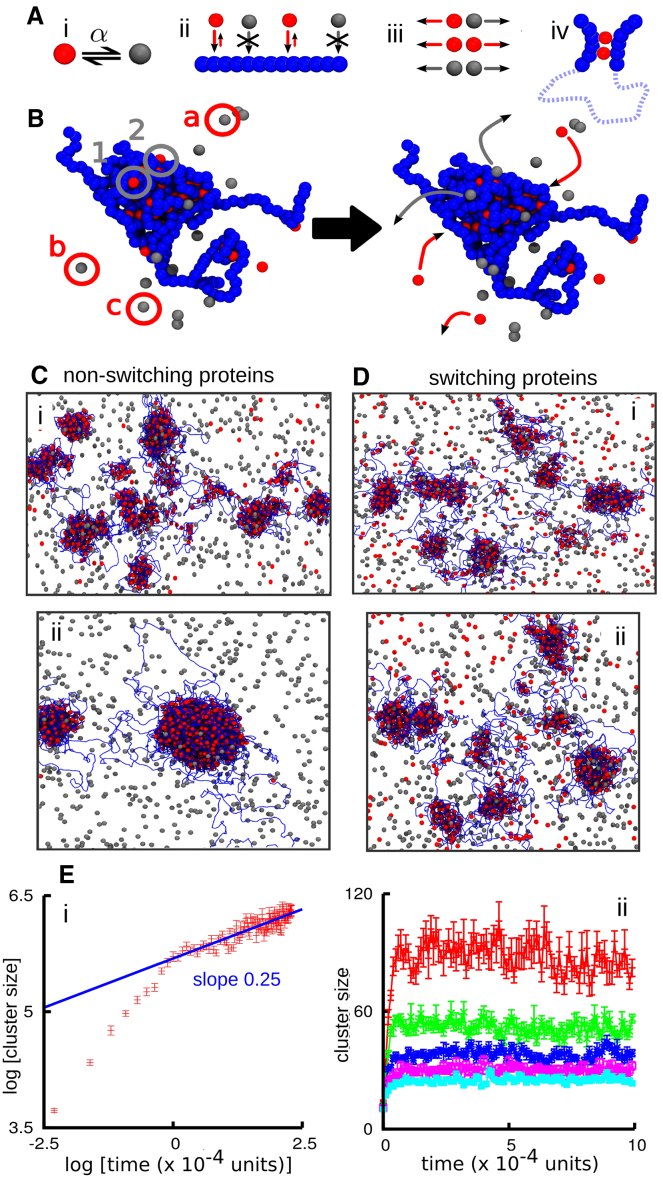
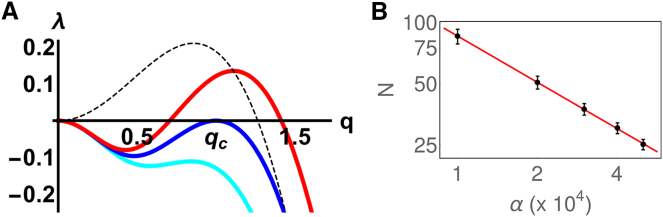
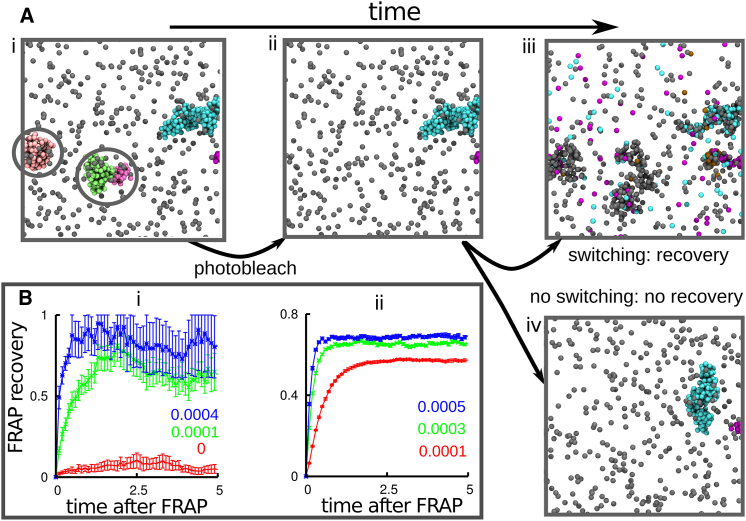
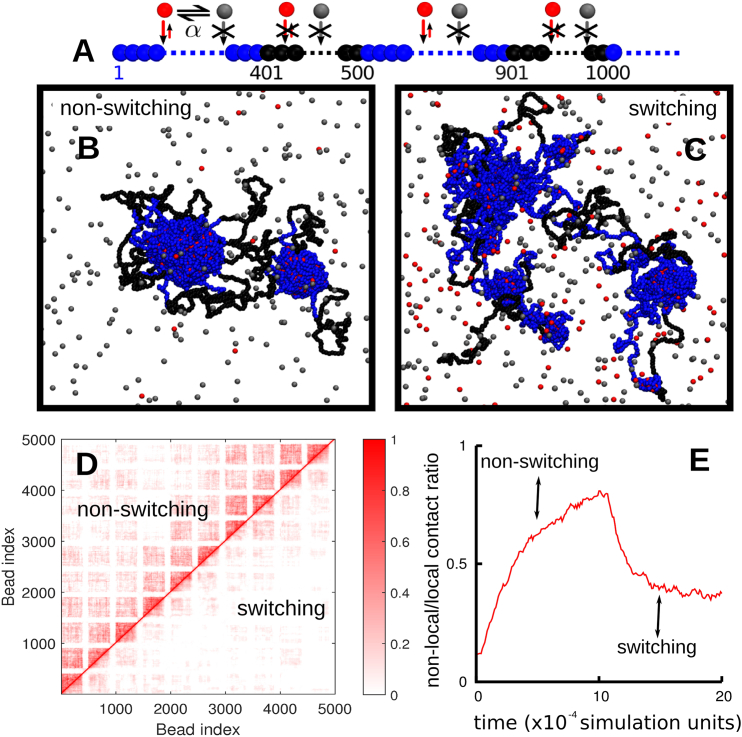
Fluorescence microscopy reveals that the contents of many (membrane-free) nuclear bodies exchange rapidly with the soluble pool while the underlying structure persists; such observations await a satisfactory biophysical explanation. To shed light on this, we perform large-scale Brownian dynamics simulations of a chromatin fiber interacting with an ensemble of (multivalent) DNA-binding proteins able to switch between an "on" (binding) and an "off" (nonbinding) state. This system provides a model for any DNA-binding protein that can be posttranslationally modified to change its affinity for DNA (e.g., through phosphorylation). Protein switching is a nonequilibrium process, and it leads to the formation of clusters of self-limiting size, where individual proteins in a cluster exchange with the soluble pool with kinetics similar to those seen in photobleaching experiments. This behavior contrasts sharply with that exhibited by nonswitching proteins, which are permanently in the on-state; when these bind to DNA nonspecifically, they form clusters that grow indefinitely in size. To explain these findings, we propose a mean-field theory from which we obtain a scaling relation between the typical cluster size and the protein switching rate. Protein switching also reshapes intrachromatin contacts to give networks resembling those seen in topologically associating domains, as switching markedly favors local (short-range) contacts over distant ones. Our results point to posttranslational modification of chromatin-bridging proteins as a generic mechanism driving the self-assembly of highly dynamic, nonequilibrium, protein clusters with the properties of nuclear bodies.


Figures

Figure 1
Figure 1
Protein switching arrests cluster coarsening. In (A)–(D), active and inactive proteins are colored red and gray, respectively; chromatin is represented by strings of blue beads. (A) Schematic of the model (Brownian dynamics simulations). (i) Proteins (single spheres) switch between red and gray states at rate α. (ii) Only proteins in the red state can bind chromatin. (iii) Red and gray beads interact via steric repulsion only. (iv) Proteins can bind to ≥2 sites to create molecular bridges and loops. (B) Snapshots illustrating protein binding/unbinding. Bound active proteins have clustered and compacted chromatin. Bound active proteins 1 and 2 (gray circles) switch and become inactive and dissociate (gray arrows); inactive proteins ac in the soluble pool (red circles) are activated and may bind to the cluster (red arrows). (C) Snapshots taken (i) 104 and (ii) 2 × 104 simulation units after equilibration. The simulation involved a 5000-bead fiber (corresponding to 15 Mbp) and N = 4000 nonswitchable proteins, of which half are able to bind. (D) As in (C), but for N = 4000 switchable proteins (α = 0.0003 inverse Brownian times). (E) Average cluster size as a function of time. Error bars denote standard deviations of the mean. (i) Nonswitching proteins. (ii) Switching proteins; from top to bottom, α equals 0.0001, 0.0002, 0.0003, 0.0004, and 0.0005 inverse Brownian times (or α−1 ≃ 10–60 s in real units). To see this figure in color, go online.
Figure 2
Figure 2
Mean field theory predicts arrested coarsening with protein modification. (A) Dispersion relation, showing the growth rate, λ, as a function of the magnitude of the wavevector, q, for fluctuations around the uniform solution of Eq. 2, for D = A = 1, and X = 3.5 (cyan), corresponding to linear stability of the uniform phase, X = Xc = 4.0 (blue), marking the onset of instability, and X = 4.5 (red), revealing the growth of clusters with a characteristic length scale. (Dotted black line) Typical dispersion relation in the absence of protein modification, which leads to a long wavelength instability. (B) Scaling between number of proteins in a cluster and switching rate found from Brownian dynamics simulations. Points show saturation values (±SD) of number of particles per cluster N (after 1.5 × 105 simulation units); the line shows a least-squares fit with a slope of −0.756. To see this figure in color, go online.
Figure 3
Figure 3
In silico FRAP (Brownian dynamics simulations). (A) Snapshots taken 104 (i and ii) or 2 × 104 (iii and iv) after equilibration, during an in silico FRAP experiment (only proteins—and not chromatin beads—are shown for clarity). (i) The simulation begins with N = 2000 equilibrium proteins, half of which are able to bind the chromatin fiber, both specifically (interaction strength 15 kBT, cutoff 1.8σ) to every 20th bead in the polymer, and nonspecifically (interaction strength 4 kBT, cutoff 1.8σ) to any other bead. After 104 time units, a structure with multiple clusters forms. The snapshot shows only a portion of this, for clarity; five clusters of bound proteins have developed (unbound proteins are gray; bound proteins in the five clusters are blue, pink, purple, and green). Circled areas will be photobleached. (ii) Photobleaching involves making bound proteins invisible (the bleached proteins are still present in the simulation). (iii) If proteins can switch, clusters reappear in the same general place (as new proteins replace their bleached counterparts). (iv) If proteins cannot switch (i.e., α = 0), clusters do not recover (as their protein constituents do not recycle). (B) FRAP recovery. Error bars give SD of mean, and time is given in multiples of 104 simulation units; the values of α, in units of inverse Brownian times, are as indicated in each panel. Only the postbleaching signal is shown (the prebleaching value would be constant and equal to 1 in these units). (i) Number of unbleached proteins in the bleached volume (a sphere of 50σ) as a function of time, after bleaching. The signal is normalized with respect to the number of proteins initially in the bleached volume. (ii) Number of unbleached proteins in clusters as a function of time after bleaching, after all proteins in clusters at a given instant are bleached. The signal is normalized with respect to the proteins in clusters at the time of bleaching. To see this figure in color, go online.
Figure 4
Figure 4
Switching promotes intra-TAD contacts, but suppresses inter-TAD ones. (A) Overview: Simulations involved N = 2000 nonswitching (α = 0) or N = 2000 switching proteins (α = 0.0001 inverse Brownian times); for α = 0, half of the proteins are binding. In both cases, interaction energy and cutoff values were 4 kBT and 1.8σ. The fiber (length 15 Mbp) consisted of regularly interspersed segments containing runs of binding (blue) and nonbinding (black) beads (segment sizes 1.2 Mbp and 300 kbp, respectively). (B and C) Snapshots taken after 105 simulation units. Nonbinding (gray) and binding (red) proteins are shown. (D) Contact maps (averages from 10 simulations) for nonswitching (top-left triangle), and switching proteins (lower-right triangle). The scale (right) indicates contact frequencies. (E) The evolution of the ratio of nonlocal contacts over time. A local (nonlocal) contact is one between beads separated by less (more) than 1.2 Mbp along the fiber. Here the simulation was run for 105 simulation units with nonswitching proteins; switching was then turned on (α = 0.0001 inverse Brownian times) and the simulation was run for a further 105 simulation units. To see this figure in color, go online.

Similar articles

Cited by

References

    1. Calladine C.R., Drew H.R., Travers A.A. Ed. 3. Elsevier; London, UK: 2004. Understanding DNA.
    1. Alberts B. Garland Science; New York: 2002. Molecular Biology of the Cell.
    1. Cook P.R. Wiley-Liss; New York: 2001. Principles of Nuclear Structure and Function.
    1. Dame R.T., Noom M.C., Wuite G.J. Bacterial chromatin organization by H-NS protein unravelled using dual DNA manipulation. Nature. 2006;444:387–390. - PubMed
    1. Simonis M., Klous P., de Laat W. Nuclear organization of active and inactive chromatin domains uncovered by chromosome conformation capture-on-chip (4C) Nat. Genet. 2006;38:1348–1354. - PubMed

LinkOut - more resources