

Understanding the Relative Flexibility of RNA and DNA Duplexes: Stretching and Twist-Stretch Coupling
- PMID: 28355538
- PMCID: PMC5376108
- DOI: 10.1016/j.bpj.2017.02.022
Understanding the Relative Flexibility of RNA and DNA Duplexes: Stretching and Twist-Stretch Coupling
Abstract
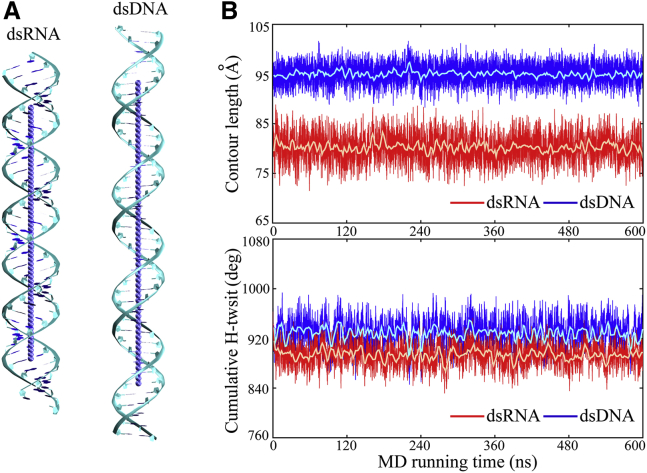
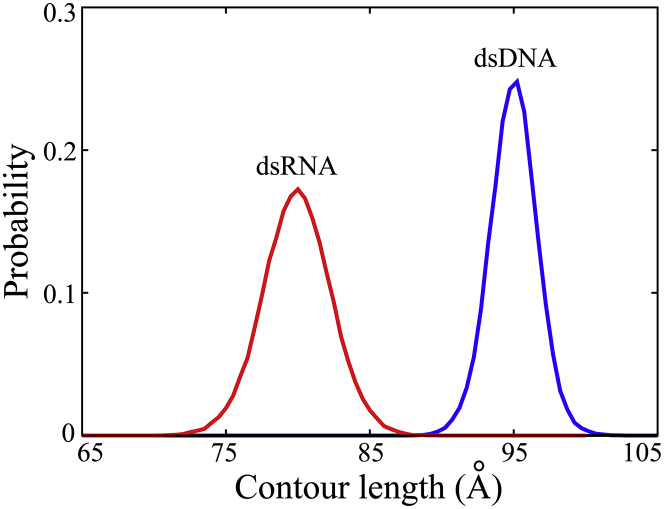
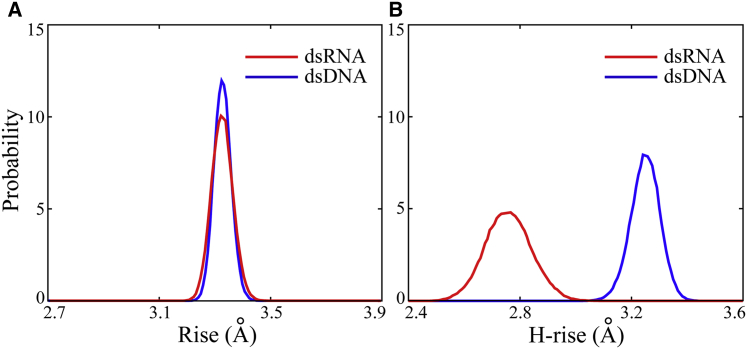
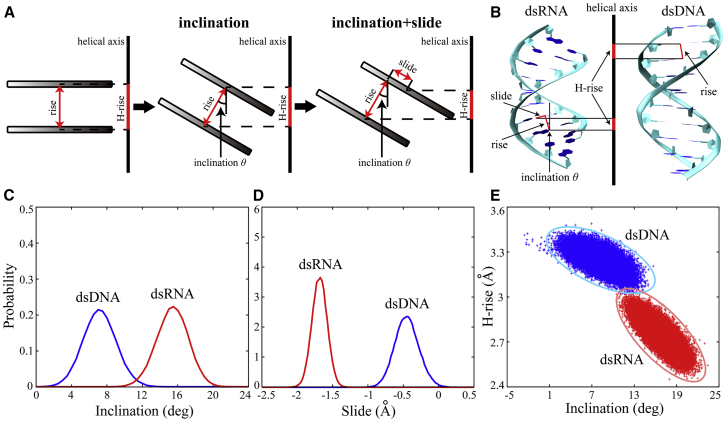
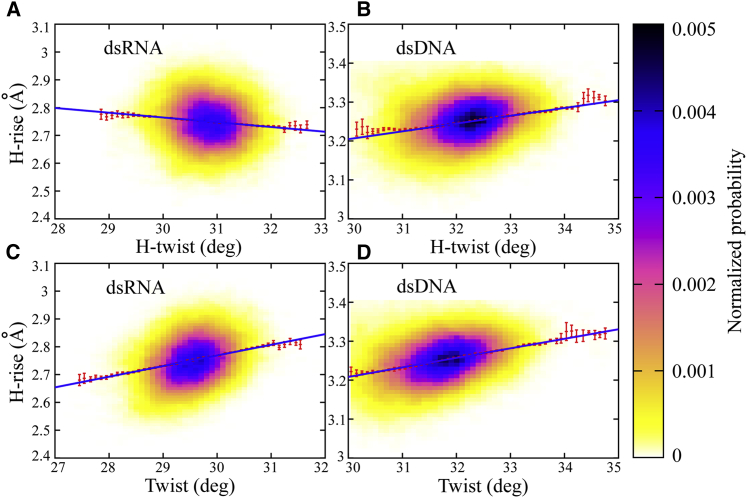
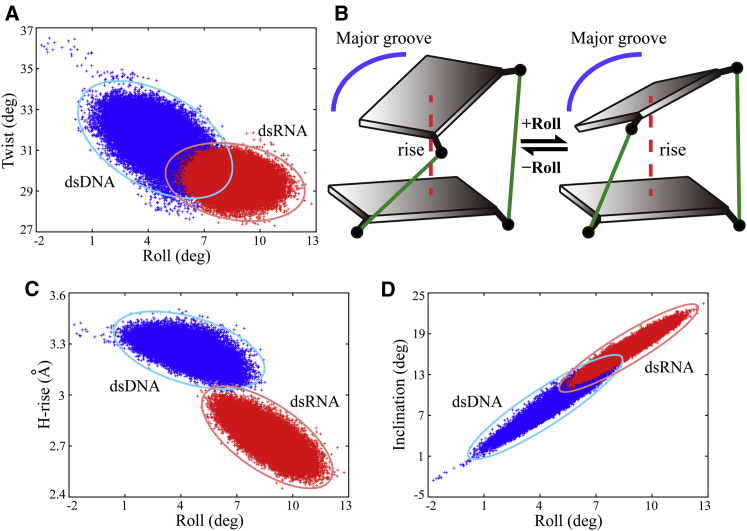
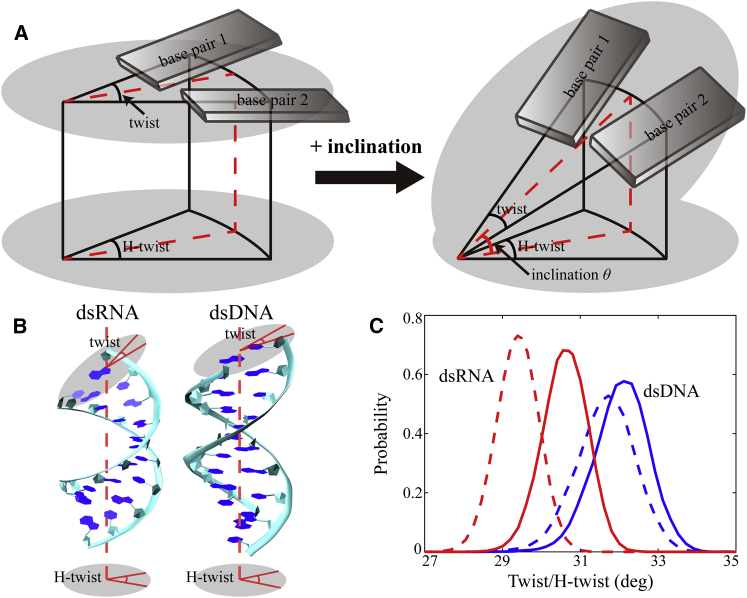
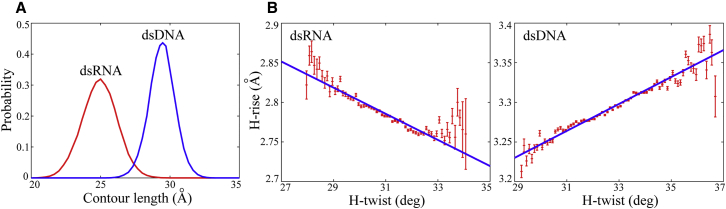
The flexibility of double-stranded (ds) RNA and dsDNA is crucial for their biological functions. Recent experiments have shown that the flexibility of dsRNA and dsDNA can be distinctively different in the aspects of stretching and twist-stretch coupling. Although various studies have been performed to understand the flexibility of dsRNA and dsDNA, there is still a lack of deep understanding of the distinctive differences in the flexibility of dsRNA and dsDNA helices as pertains to their stretching and twist-stretch coupling. In this work, we have explored the relative flexibility in stretching and twist-stretch coupling between dsRNA and dsDNA by all-atom molecular dynamics simulations. The calculated stretch modulus and twist-stretch coupling are in good accordance with the existing experiments. Our analyses show that the differences in stretching and twist-stretch coupling between dsRNA and dsDNA helices are mainly attributed to their different (A- and B-form) helical structures. Stronger basepair inclination and slide in dsRNA is responsible for the apparently weaker stretching rigidity versus that of dsDNA, and the opposite twist-stretch coupling for dsRNA and dsDNA is also attributed to the stronger basepair inclination in dsRNA than in dsDNA. Our calculated macroscopic elastic parameters and microscopic analyses are tested and validated by different force fields for both dsRNA and dsDNA.
Copyright © 2017 Biophysical Society. Published by Elsevier Inc. All rights reserved.
Figures
Similar articles
-
Structural Flexibility of DNA-RNA Hybrid Duplex: Stretching and Twist-Stretch Coupling.Biophys J. 2019 Jul 9;117(1):74-86. doi: 10.1016/j.bpj.2019.05.018. Epub 2019 May 23. Biophys J. 2019. PMID: 31164196 Free PMC article.
-
Understanding the mechanical response of double-stranded DNA and RNA under constant stretching forces using all-atom molecular dynamics.Proc Natl Acad Sci U S A. 2017 Jul 3;114(27):7049-7054. doi: 10.1073/pnas.1705642114. Epub 2017 Jun 20. Proc Natl Acad Sci U S A. 2017. PMID: 28634300 Free PMC article.
-
Explaining the striking difference in twist-stretch coupling between DNA and RNA: A comparative molecular dynamics analysis.Nucleic Acids Res. 2015 Dec 2;43(21):10143-56. doi: 10.1093/nar/gkv1028. Epub 2015 Oct 12. Nucleic Acids Res. 2015. PMID: 26464435 Free PMC article.
-
Mechanisms and applications of peptide nucleic acids selectively binding to double-stranded RNA.Biopolymers. 2022 Feb;113(2):e23476. doi: 10.1002/bip.23476. Epub 2021 Sep 28. Biopolymers. 2022. PMID: 34581432 Review.
-
The left-handed double helical nucleic acids.Acta Biochim Pol. 2001;48(2):295-312. Acta Biochim Pol. 2001. PMID: 11732602 Review.
Cited by
-
Sensitivity of the RNA Structure to Ion Conditions as Probed by Molecular Dynamics Simulations of Common Canonical RNA Duplexes.J Chem Inf Model. 2023 Apr 10;63(7):2133-2146. doi: 10.1021/acs.jcim.2c01438. Epub 2023 Mar 29. J Chem Inf Model. 2023. PMID: 36989143 Free PMC article.
-
Effect of temperature on anisotropic bending elasticity of dsRNA: an all-atom molecular dynamics simulation.RSC Adv. 2024 May 28;14(24):17170-17177. doi: 10.1039/d4ra02354d. eCollection 2024 May 22. RSC Adv. 2024. PMID: 38808231 Free PMC article.
-
Systematic Comparison of Atomistic Force Fields for the Mechanical Properties of Double-Stranded DNA.J Chem Theory Comput. 2024 Mar 12;20(5):2261-2272. doi: 10.1021/acs.jctc.3c01089. Epub 2024 Feb 27. J Chem Theory Comput. 2024. PMID: 38411091 Free PMC article.
-
Divalent Ion-Mediated DNA-DNA Interactions: A Comparative Study of Triplex and Duplex.Biophys J. 2017 Aug 8;113(3):517-528. doi: 10.1016/j.bpj.2017.06.021. Biophys J. 2017. PMID: 28793207 Free PMC article.
-
Computational Modeling of DNA 3D Structures: From Dynamics and Mechanics to Folding.Molecules. 2023 Jun 17;28(12):4833. doi: 10.3390/molecules28124833. Molecules. 2023. PMID: 37375388 Free PMC article. Review.
References
-
- Timmons L., Fire A. Specific interference by ingested dsRNA. Nature. 1998;395:854. - PubMed
-
- Fire A., Xu S., Mello C.C. Potent and specific genetic interference by double-stranded RNA in Caenorhabditis elegans. Nature. 1998;391:806–811. - PubMed
-
- Richmond T.J., Davey C.A. The structure of DNA in the nucleosome core. Nature. 2003;423:145–150. - PubMed
-
- Pabo C.O., Sauer R.T. Protein-DNA recognition. Annu. Rev. Biochem. 1984;53:293–321. - PubMed
MeSH terms
Substances
LinkOut - more resources
Full Text Sources
Other Literature Sources
