

Unraveling the Receptor-Ligand Interactions between Bladder Cancer Cells and the Endothelium Using AFM
- PMID: 28355551
- PMCID: PMC5375142
- DOI: 10.1016/j.bpj.2017.01.033
Unraveling the Receptor-Ligand Interactions between Bladder Cancer Cells and the Endothelium Using AFM
Abstract
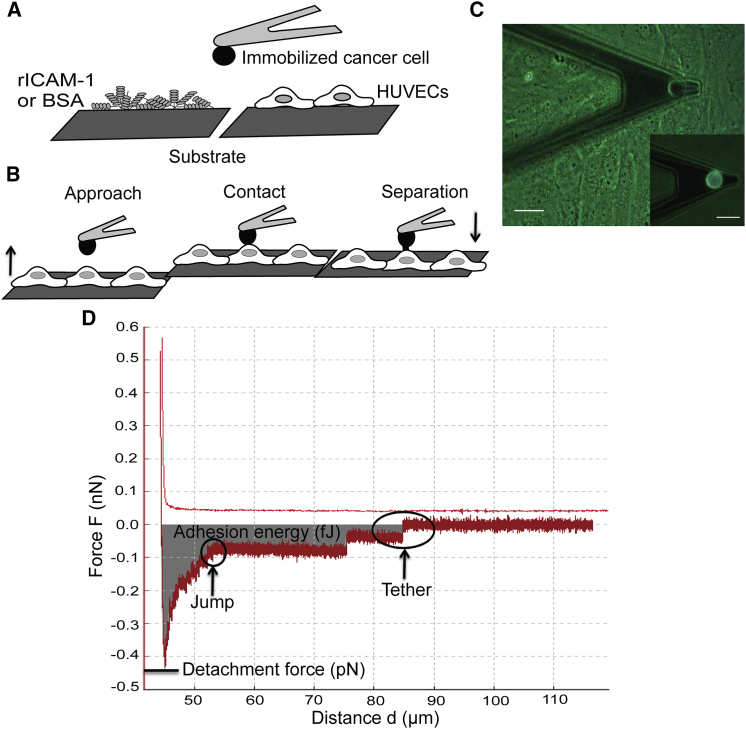
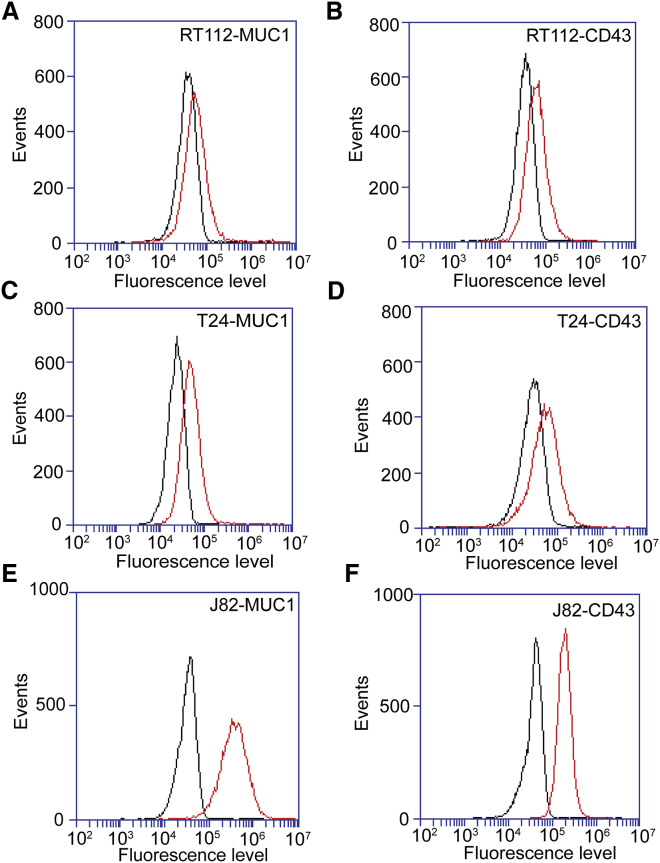
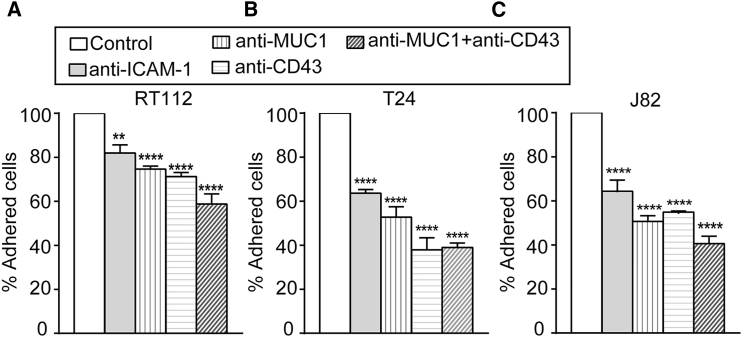
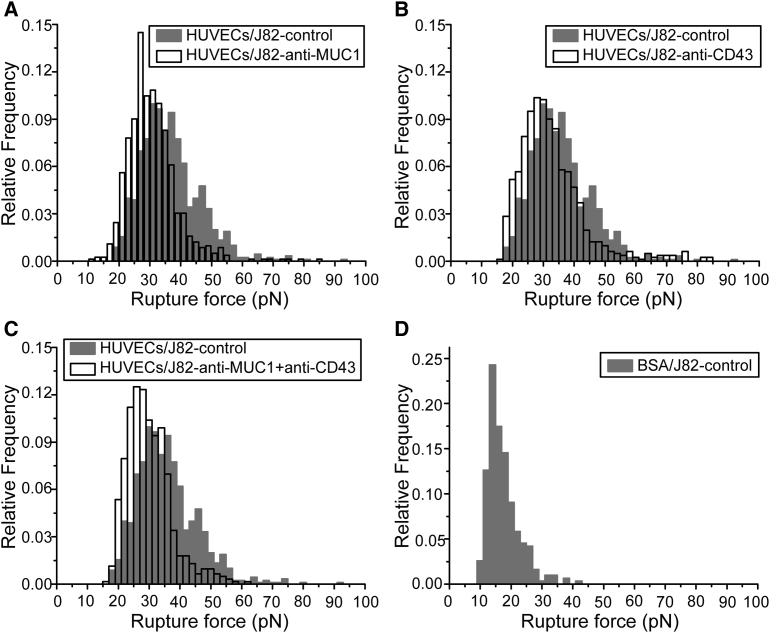
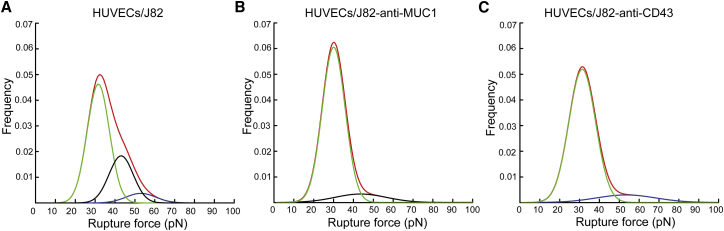
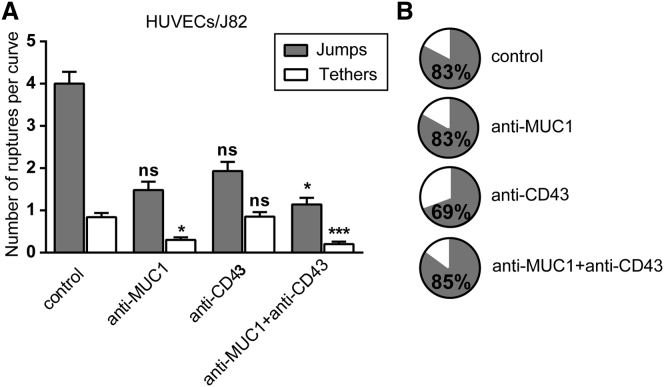
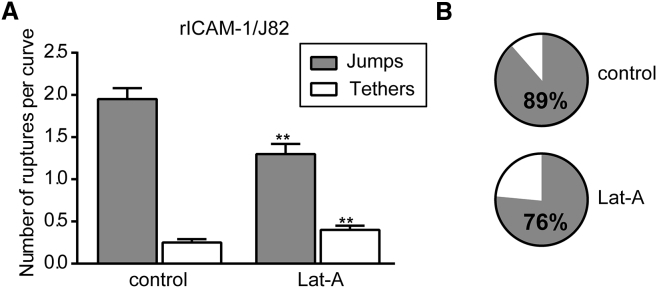
Adhesion of cancer cells to endothelial cells is a key step in cancer metastasis; therefore, identifying the key molecules involved during this process promises to aid in efforts to block the metastatic cascade. We have previously shown that intercellular adhesion molecule-1 (ICAM-1) expressed by endothelial cells is involved in the interactions of bladder cancer cells (BCs) with the endothelium. However, the ICAM-1 ligands have never been investigated. In this study, we combined adhesion assays and atomic force microscopy (AFM) to identify the ligands involved and to quantify the forces relevant in such interactions. We report the expression of MUC1 and CD43 on BCs, and demonstrate that these ligands interact with ICAM-1 to mediate cancer cell-endothelial cell adhesion in the case of the more invasive BCs. This was achieved with the use of adhesion assays, which showed a strong decrease in the attachment of BCs to endothelial cells when MUC1 and CD43 were blocked by antibodies. In addition, AFM measurements showed a similar decrease, by up to 70%, in the number of rupture events that occurred when MUC1 and CD43 were blocked. When we applied a Gaussian mixture model to the AFM data, we observed a distinct force range for receptor-ligand bonds, which allowed us to precisely identify the interactions of ICAM-1 with MUC1 or CD43. Furthermore, a detailed analysis of the rupture events suggested that CD43 is strongly connected to the cytoskeleton and that its interaction with ICAM-1 mainly corresponds to force ramps followed by sudden jumps. In contrast, MUC1 seems to be weakly connected to the cytoskeleton, as its interactions with ICAM-1 are mainly associated with the formation of tethers. This analysis is quite promising and may also be applied to other types of cancer cells.
Copyright © 2017 Biophysical Society. Published by Elsevier Inc. All rights reserved.
Figures
Similar articles
-
Atomic force microscopy reveals a role for endothelial cell ICAM-1 expression in bladder cancer cell adherence.PLoS One. 2014 May 23;9(5):e98034. doi: 10.1371/journal.pone.0098034. eCollection 2014. PLoS One. 2014. PMID: 24857933 Free PMC article.
-
The breast mucin MUCI as a novel adhesion ligand for endothelial intercellular adhesion molecule 1 in breast cancer.Cancer Res. 1996 Sep 15;56(18):4244-9. Cancer Res. 1996. PMID: 8797599
-
MUC1 mediates transendothelial migration in vitro by ligating endothelial cell ICAM-1.Clin Exp Metastasis. 2005;22(6):475-83. doi: 10.1007/s10585-005-3098-x. Clin Exp Metastasis. 2005. PMID: 16320110
-
MUC1-mediated motility in breast cancer: a review highlighting the role of the MUC1/ICAM-1/Src signaling triad.Clin Exp Metastasis. 2015 Apr;32(4):393-403. doi: 10.1007/s10585-015-9711-8. Epub 2015 Mar 11. Clin Exp Metastasis. 2015. PMID: 25759211 Review.
-
Analysis of ligand-receptor interactions in cells by atomic force microscopy.J Recept Signal Transduct Res. 2002 Feb-Nov;22(1-4):169-90. doi: 10.1081/rrs-120014594. J Recept Signal Transduct Res. 2002. PMID: 12503614 Review.
Cited by
-
Efficient deformation mechanisms enable invasive cancer cells to migrate faster in 3D collagen networks.Sci Rep. 2022 May 12;12(1):7867. doi: 10.1038/s41598-022-11581-2. Sci Rep. 2022. PMID: 35550548 Free PMC article.
-
The Bladder Tumor Microenvironment Components That Modulate the Tumor and Impact Therapy.Int J Mol Sci. 2023 Aug 1;24(15):12311. doi: 10.3390/ijms241512311. Int J Mol Sci. 2023. PMID: 37569686 Free PMC article. Review.
-
Melanoma cells can be eliminated by sialylated CD43 × CD3 bispecific T cell engager formats in vitro and in vivo.Cancer Immunol Immunother. 2021 Jun;70(6):1569-1581. doi: 10.1007/s00262-020-02780-9. Epub 2020 Nov 23. Cancer Immunol Immunother. 2021. PMID: 33225419 Free PMC article.
-
Mechanosensitivity of Cancer Cells in Contact with Soft Substrates Using AFM.Biophys J. 2018 Mar 13;114(5):1165-1175. doi: 10.1016/j.bpj.2018.01.005. Biophys J. 2018. PMID: 29539402 Free PMC article.
-
Quality control of direct cell-mineral adhesion measurements in air and liquid using inverse AFM imaging.RSC Adv. 2021 Jan 28;11(10):5384-5392. doi: 10.1039/d1ra00110h. eCollection 2021 Jan 28. RSC Adv. 2021. PMID: 35423094 Free PMC article.
References
MeSH terms
Substances
LinkOut - more resources
Full Text Sources
Other Literature Sources
Medical
Research Materials
Miscellaneous
