. 2017 Mar 28;112(6):1282-1289.
doi: 10.1016/j.bpj.2017.02.011.

Hydrodynamic Hunters

Affiliations

Hydrodynamic Hunters

Hossein Jashnsaz et al. Biophys J. .

Abstract

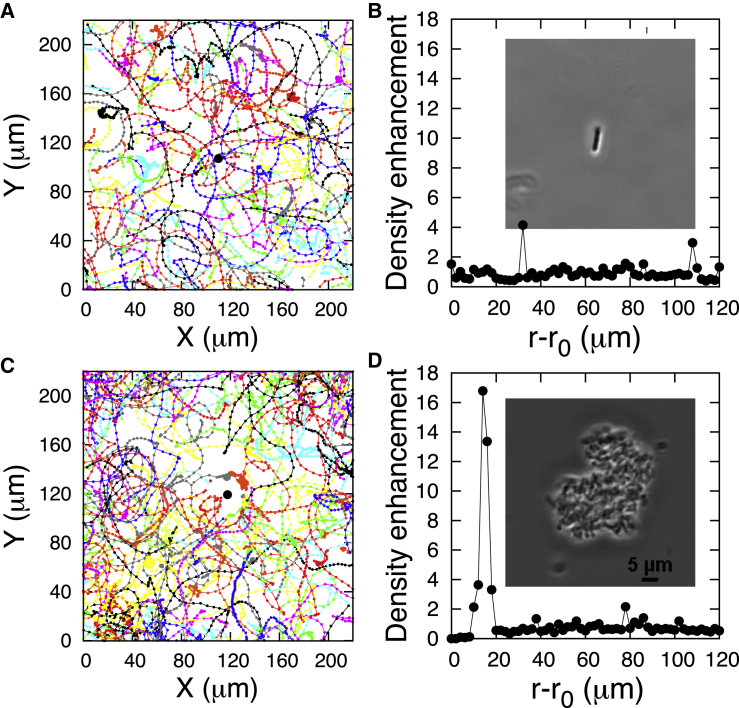
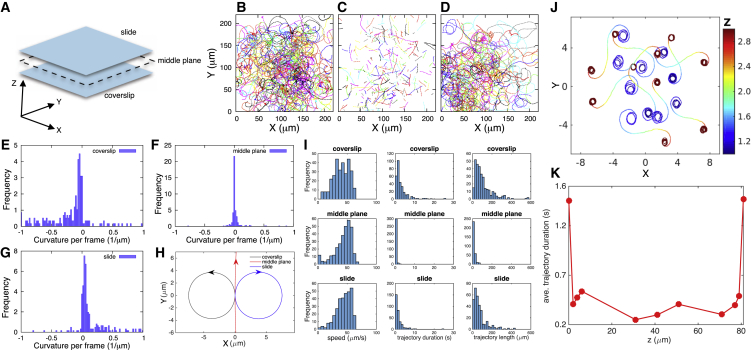
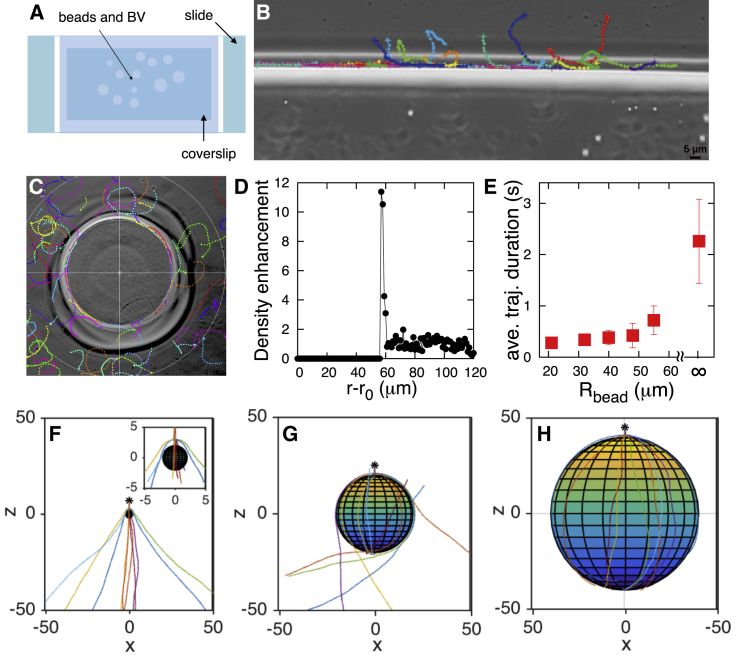
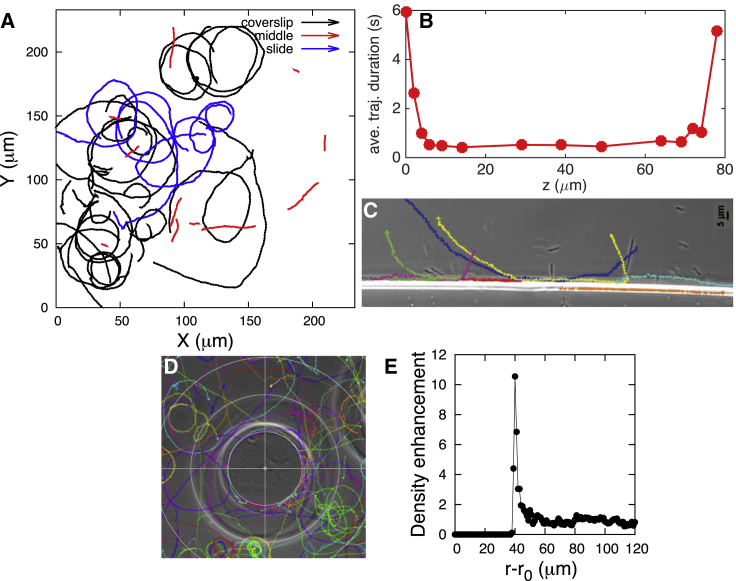
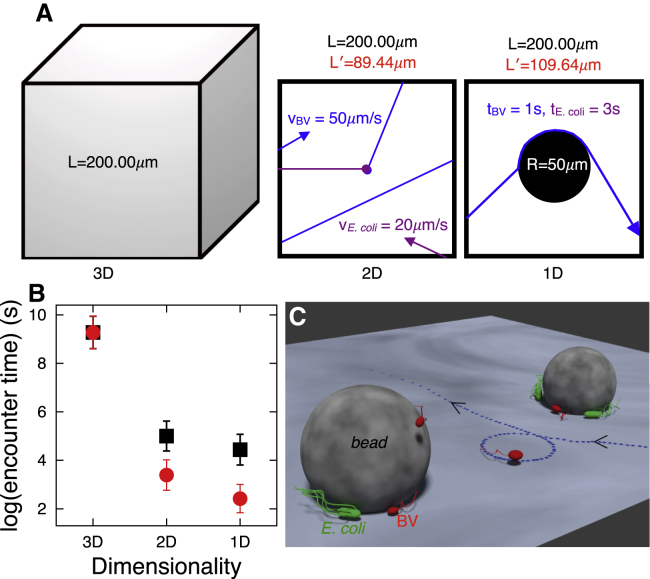
The Gram-negative Bdellovibrio bacteriovorus (BV) is a model bacterial predator that hunts other bacteria and may serve as a living antibiotic. Despite over 50 years since its discovery, it is suggested that BV probably collides into its prey at random. It remains unclear to what degree, if any, BV uses chemical cues to target its prey. The targeted search problem by the predator for its prey in three dimensions is a difficult problem: it requires the predator to sensitively detect prey and forecast its mobile prey's future position on the basis of previously detected signal. Here instead we find that rather than chemically detecting prey, hydrodynamics forces BV into regions high in prey density, thereby improving its odds of a chance collision with prey and ultimately reducing BV's search space for prey. We do so by showing that BV's dynamics are strongly influenced by self-generated hydrodynamic flow fields forcing BV onto surfaces and, for large enough defects on surfaces, forcing BV in orbital motion around these defects. Key experimental controls and calculations recapitulate the hydrodynamic origin of these behaviors. While BV's prey (Escherichia coli) are too small to trap BV in hydrodynamic orbit, the prey are also susceptible to their own hydrodynamic fields, substantially confining them to surfaces and defects where mobile predator and prey density is now dramatically enhanced. Colocalization, driven by hydrodynamics, ultimately reduces BV's search space for prey from three to two dimensions (on surfaces) even down to a single dimension (around defects). We conclude that BV's search for individual prey remains random, as suggested in the literature, but confined, however-by generic hydrodynamic forces-to reduced dimensionality.


Figures

Figure 1
Figure 1
BV do not show chemotaxis toward individual E. coli although they do chemotactically accumulate around large chunks of E. coli. (A) Shows BV trajectories around an individual E. coli (whose location is designated by the middle dot). The density enhancement of BV is shown in (B) around the prey. (C) Shows the trajectories of BV around a large chunk of E. coli. The density enhancement of BV is shown in (D) around the chunk of prey. The insets in (B) and (D) show the microscope images of the individual E. coli and E. coli chunk; r0 shows their geometric centers, respectively. The density enhancements in (B) is the density of motile BV with respect to the center of the individual E. coli computed at various distances from the E. coli divided by the average background density away from E. coli (see the Supporting Material for density calculation and Fig. S7). In (D), the only difference with (B) is that it is now the density of motile BV with respect to the geometric center of the chunk of E. coli. To create a chunk of E. coli, its overnight culture (see Materials and Methods) was centrifuged and the pellet suspended in CaHEPES, and a proper size piece of it was located under the microscope on a slide. To see this figure in color, go online.
Figure 2
Figure 2
Self-generated hydrodynamic flows cause BV to interact strongly with surfaces. The motility of active BV was monitored at various planes between a microscope slide and a coverslip (A) separated by 40–90 μm (in such a way that the bacterium does not interact with surfaces when freely swimming through the middle plane). BV trajectories were recorded on the surface of the coverslip (B), the middle plane (C), and slide (D) (a sum of 290, 296, and 305 trajectories drawn from four samples, respectively). The signed curvature (helicity) histograms on the coverslip (E), middle plane (F), and slide (G) show a transition from counterclockwise to clockwise rotations. Positive curvature values indicate clockwise rotation, while negative curvature values indicate counterclockwise rotation. The helicity data are summarized in (H) by approximating trajectories as circles with the radius Reff of 2/(κave + κmedian), where κave and κmedian are the mean and median for the corresponding curvature histogram (see the Supporting Material for details of the calculation). The helicity of the circles on the surfaces depend on the bacterium’s distance from the surface, the bacterium’s shape, its propulsion mechanism, and the size and shape of the bacterium (29) (see the Supporting Material for detailed discussion). In addition, there are differences in the surface roughnesses that are reflected as slight differences in how bacteria interact with the coverslip and the microscope slide surface. These differences arise, for instance, because the coverslip has more debris while dead bacteria tend to stick to the slide. In (I), we show histograms of speed as well as duration and lengths of trajectories on each plane shown for those trajectories given in (B)–(D). Frequency in all plots represents trajectory count. (J) Hydrodynamic simulations from Spagnolie and Lauga (29)—adapted to match our boundary conditions—demonstrate that hydrodynamic interactions are sufficient to account for switching helicity (and trajectory radius size changes) as bacteria move between two surfaces with a z-range set arbitrarily between 1 and 3. BV dwell longer at the coverslip and microscope slide (0 being the coverslip plane), indicating that mobile BV is hydrodynamically forced onto surfaces (K). Each data point here represents the average dwell time of 20 trajectories recorded at that specific plane. Tracking criteria are explained in Materials and Methods. The helicity of all trajectories in figures in the main body and Supporting Material are opposite to the observations as seen in the movies (in other words, as seen from the coverslip side of our inverted setup). To see this figure in color, go online.
Figure 3
Figure 3
BV is geometrically captured in orbital motion around spherical inert beads. Active BV are mixed with inert CL beads between a microscope slide and a coverslip (A). Sample trajectories show BV swimming along a wall (constructed as explained in the Materials and Methods) (B), and being geometrically captured around beads (C). Each colored line indicates a separate bacterial trajectory, with the points along each line indicating the position of the bacterium at each interval. From 84 trajectories, we collected a density histogram (see the Supporting Material for details of the calculation) of BV showing how BV tightly localizes in orbital motion around beads (D). Density enhancement is computed with respect to the center of the bead (r0) as explained in the Supporting Material and Fig. S7. Analysis of beads of decreasing size reveal how BV’s capture time decreases for smaller beads (E). Each data point is the mean trajectory’s duration within the capture region (5 μm from the bead surface) for a corresponding bead after dropping 5% of outliers from each side (that is, bacteria that stayed stuck to the bead or bacteria that only grazed the bead). The error bar is 1 SD. The data point corresponding to Rbead = ∞ shows the trajectory duration expected for an infinite radius bead (obtained by averaging the trajectory duration on the surface of the coverslip and slide combined; from Fig. 2, B and D). More data are provided in Figs. S6 and S7. Simulations of BV trajectories are shown around beads with radii of 2 (F), 20 (G), and 40 (H), measured in units of BV’s bacterial body length with identical initial conditions. Model details are found in the Fig. S2 and the Supporting Material. The capture probability increases (from ∼0 to ∼1) as the bead size increases from 2 (F) to 40 (H). Strong interactions with the surface on which the bead rests contribute to BV’s eventual detachment from the bead in experiments. To see this figure in color, go online.
Figure 4
Figure 4
E. coli is also influenced by its own self-generated hydrodynamic fields. Like BV, E. coli circles on the coverslip and slide with opposite helicity (A), and sticks closely to surfaces and the wall (constructed as explained in Materials and Methods) (B and C). Based on a total of 24 trajectories of E. coli on the surfaces, we calculated a radius that was approximately twice as large as that of BV. This is expected from our hydrodynamic model as E. coli is longer than BV; based on our hydrodynamic model, longer bacteria make bigger circles on the surfaces (see the Supporting Material for detailed discussion). (B) Dwell time for trajectories recorded on each plane between a coverslip and a microscope slide, 0 being the coverslip plane. Like BV, E. coli is also geometrically captured by beads (D) (trajectories are recorded on the surface of the coverslip around the bead). Just as determined in Fig. 3D for BV, mobile E. coli spends more time around the bead, showing enhanced density near the bead by contrast to regions away from the bead as seen in (E) (86 trajectories). To see this figure in color, go online.
Figure 5
Figure 5
Hydrodynamic interactions, passively, enhance encounter rates of the predator with the prey. (A) Here we illustrate how we calculate the encounter rates of the predator with the prey using our experimental results. A cube of length L = 200.00 μm is considered to simulate encounter rates in 3D (left), the area of a square of the same length for 2D (center), and to capture the motion along the boundary of the beads on the surface of the coverslip, a circle of radius R = 50 μm inside the same square for 1D (right). A pair of BV and E. coli—with radii rBV = 0.50 μm and rE.coli = 1.00 μm (approximated as spheres)—initially start at the center of the cube and square and select a random direction, then move in straight paths with speeds of vBV = 50.00 μm/s and vE.coli = 20.00 μm/s (from experimental data, Fig. 2 I), respectively. When any of them collide with the surface of the cube (3D) or edge of the square (2D and 1D), they start from a new random position with a new random direction on a new random side of the cube or square (all uniformly). In the 1D case, they initially start from an arbitrarily point outside of the circle, and when they encounter the circle, they move along its circumference—BV for 1.0 s (Fig. 3E) and E. coli for 3.0 s (averaged from 10 trajectories of E. coli along the bead surface on the coverslip) and then escape in a direction tangential to the circle. We record their positions at every 0.020 s (corresponding to a frame rate of 50 fps), and we consider a frame as an encounter time whenever the distance between BV and E. coli centers is less than rBV + rE.coli. We calculate encounter times from 1000 such collisions. (B) Natural logarithm of the encounter times (times between two successive encounters). (Black squares) Encounter times versus dimensionality without considering density enhancement (due to hydrodynamic effects); (red circles) corresponding times in the presence of the density enhancement. For red circles in 2D and 1D, we enhance the density fivefold to mimic density increases at surfaces due to hydrodynamics (Figs. 2K and 4B). We do so by reducing the length of the box from L = 200.00 μm to L′ = 89.44 μm (2D) and to L′ = 109.64 μm (1D). Error bars in (B) are 1 SD. (C) A qualitative illustration of geometric capture of predator and prey on surfaces and around beads as a result of their hydrodynamic interactions. To see this figure in color, go online.

Comment in

References

    1. Stolp H., Starr M.P. Bdellovibrio bacteriovorus gen. et sp. n., a predatory, ectoparasitic, and bacteriolytic microorganism. Antonie van Leeuwenhoek. 1963;29:217–248. - PubMed
    1. Rendulic S., Jagtap P., Schuster S.C. A predator unmasked: life cycle of Bdellovibrio bacteriovorus from a genomic perspective. Science. 2004;303:689–692. - PubMed
    1. Straley S.C., Conti S.F. Chemotaxis by Bdellovibrio bacteriovorus toward prey. J. Bacteriol. 1977;132:628–640. - PMC - PubMed
    1. Kadouri D., O’Toole G.A. Susceptibility of biofilms to Bdellovibrio bacteriovorus attack. Appl. Environ. Microbiol. 2005;71:4044–4051. - PMC - PubMed
    1. Boileau M.J., Clinkenbeard K.D., Iandolo J.J. Assessment of Bdellovibrio bacteriovorus 109J killing of Moraxella bovis in an in vitro model of infectious bovine keratoconjunctivitis. Can. J. Vet. Res. 2011;75:285–291. - PMC - PubMed

MeSH terms

LinkOut - more resources