. 2017 Mar 28;18(13):3117-3128.
doi: 10.1016/j.celrep.2017.02.070.

SMARCAD1 Contributes to the Regulation of Naive Pluripotency by Interacting with Histone Citrullination

Affiliations

SMARCAD1 Contributes to the Regulation of Naive Pluripotency by Interacting with Histone Citrullination

Shu Xiao et al. Cell Rep. .

Abstract

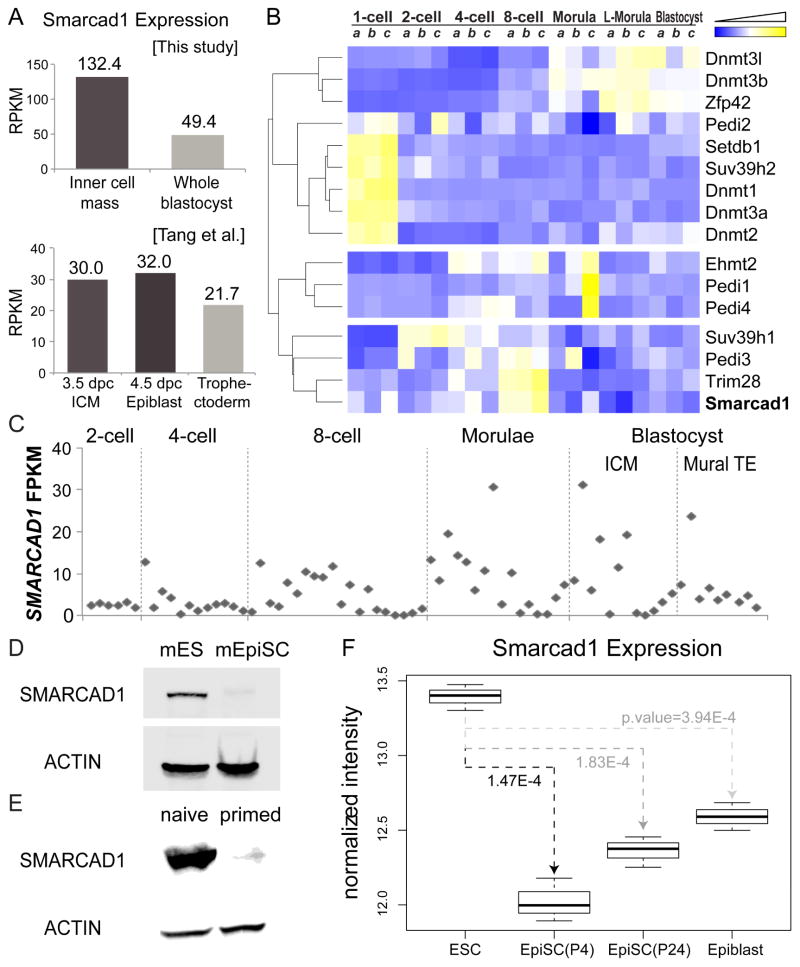
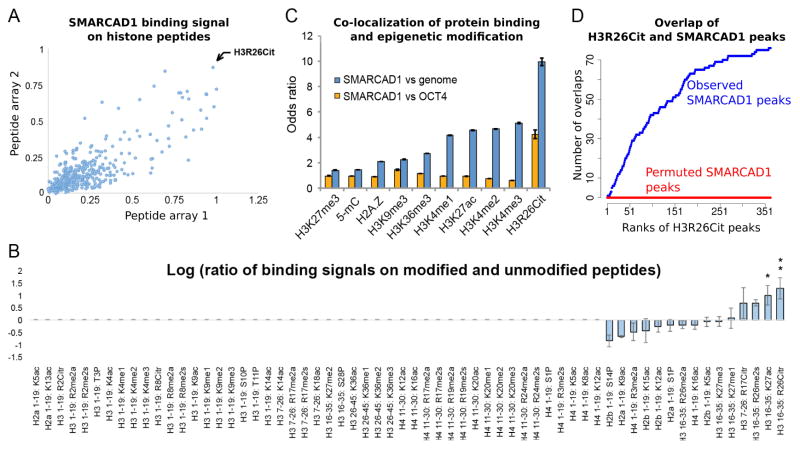
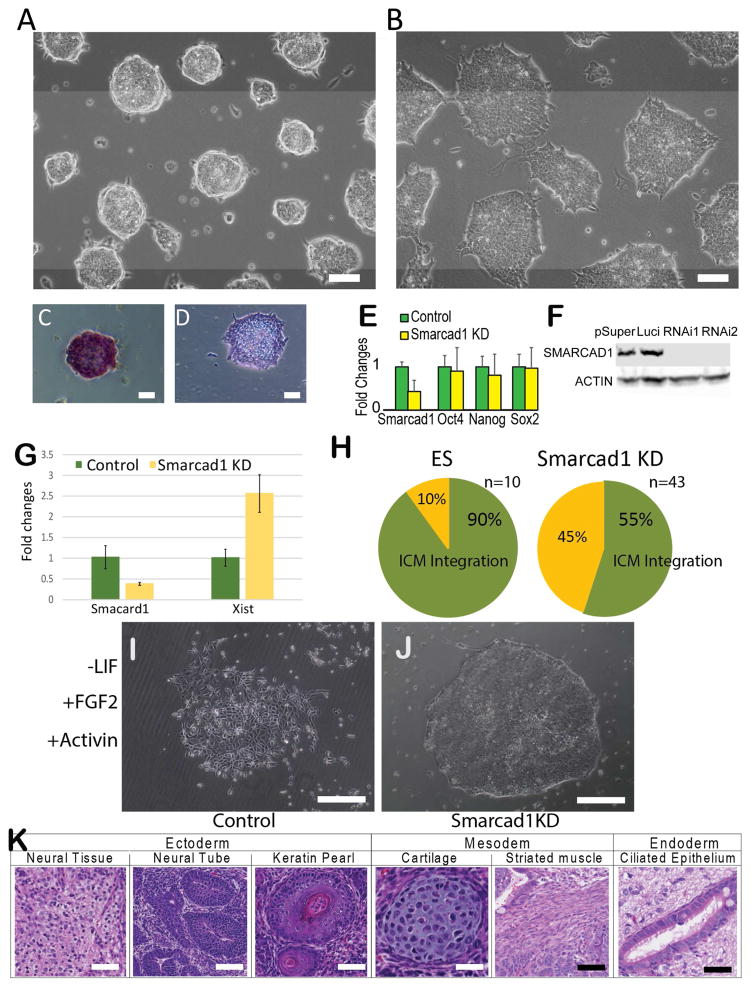
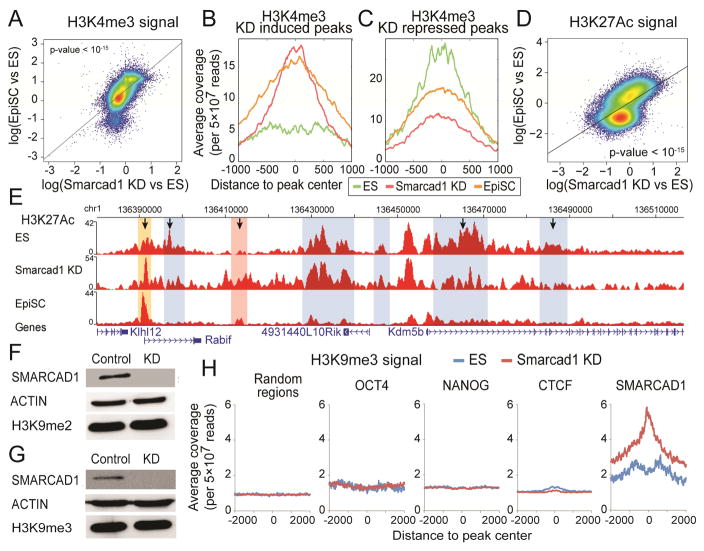
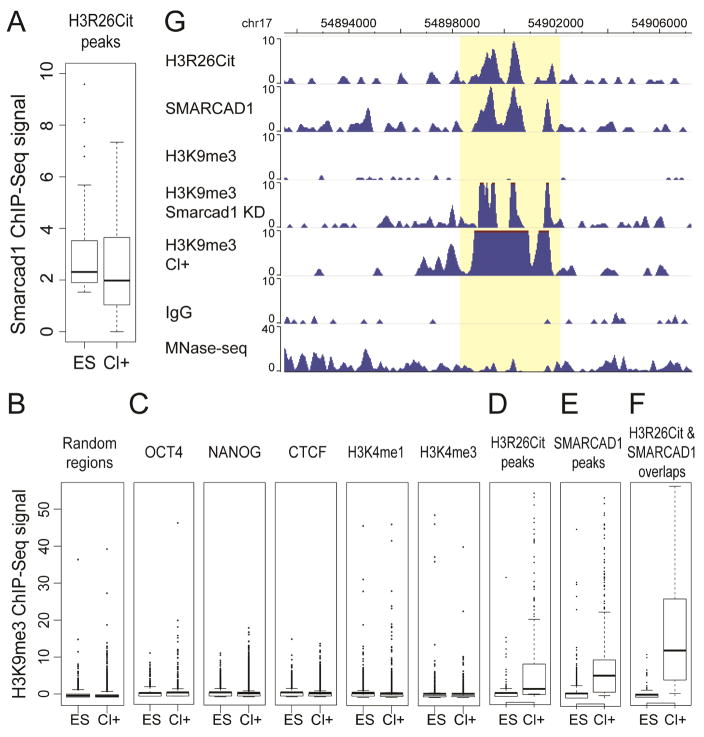
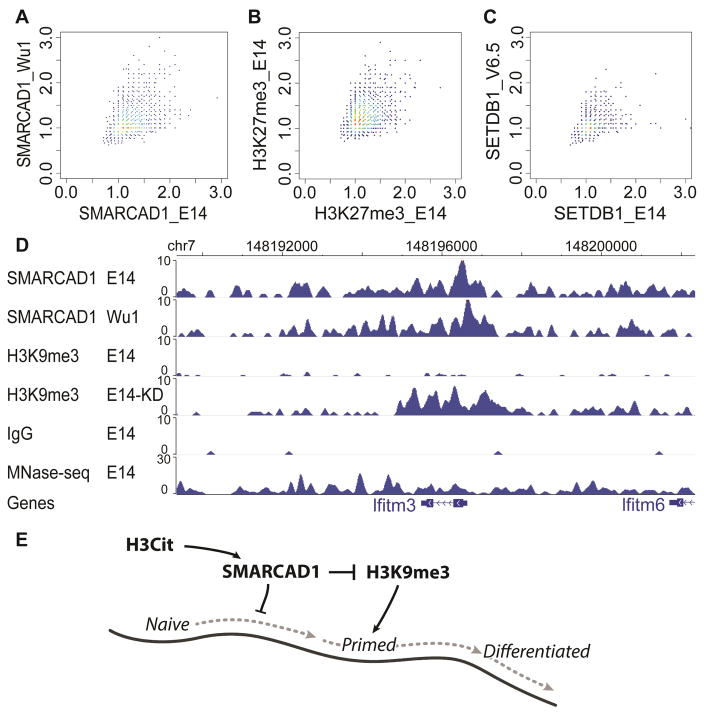
Histone citrullination regulates diverse cellular processes. Here, we report that SMARCAD1 preferentially associates with H3 arginine 26 citrullination (H3R26Cit) peptides present on arrays composed of 384 histone peptides harboring distinct post-transcriptional modifications. Among ten histone modifications assayed by ChIP-seq, H3R26Cit exhibited the most extensive genomewide co-localization with SMARCAD1 binding. Increased Smarcad1 expression correlated with naive pluripotency in pre-implantation embryos. In the presence of LIF, Smarcad1 knockdown (KD) embryonic stem cells lost naive state phenotypes but remained pluripotent, as suggested by morphology, gene expression, histone modifications, alkaline phosphatase activity, energy metabolism, embryoid bodies, teratoma, and chimeras. The majority of H3R26Cit ChIP-seq peaks occupied by SMARCAD1 were associated with increased levels of H3K9me3 in Smarcad1 KD cells. Inhibition of H3Cit induced H3K9me3 at the overlapping regions of H3R26Cit peaks and SMARCAD1 peaks. These data suggest a model in which SMARCAD1 regulates naive pluripotency by interacting with H3R26Cit and suppressing heterochromatin formation.

Keywords: ChIP-seq; SMARCAD1; citrullination; histone modification; naive state; pluripotency; protein array; stem cells.


Figures

Figure 1
Figure 1. Smarcad1 expression patterns in early embryonic development and in pluripotent stem cells
(A) RNA-seq derived Smarcad1 mRNA levels in ICM, whole blastocyst, trophectoderm, and epiblast. dpc: days post conception. (B) Expression heatmap of genes related to DNA methylation, H3K9 methylation, and histone citrullination. Three biological replicates (a, b, c) were analyzed in each of 7 stages in mouse preimplantation development. L-Morula: late morula stage. Gene expression levels were normalized across samples, clustered (dendrogram), and visualized (yellow: high expression, blue: low expression). (C) SMARCAD1 expression (y axis) in single cells of human preimplantation embryos (GEO: GSE36552). Each column represents a single cell, and the cells were grouped by developmental stage (x axis). TE: trophectoderm. (D–E) Western blots of SMARCAD1 and ACTIN in mouse ES cells and EpiSCs (D), and in pig naïve and primed pluripotent cells (E). (F) Microarray derived Smarcad1 expression levels in mouse ES cells, EpiSC, and epiblast. P4, P24: denotes passages 4 and 24.
Figure 2
Figure 2. SMARCAD1 recognizes H3R26Cit in vitro and co-localizes with H3R26Cit in vivo
(A) Binding signals of SMARCAD1 on MODified histone peptide arrays. Each dot represents the binding intensities to a peptide, that is modified with a unique combination of post-transcriptional modifications, on array 1 (x axis) and array 2 (y axis). (B) Binding signals on post-translationally modified versus unmodified peptide (log ratio, y axis). All the peptides with a single modification and the unmodified peptides are shown (columns). If the raw binding signal to a modified peptide was smaller than the average binding signal to background peptides, the log ratio was assigned to 0 (non-informative, Columns 1 – 50). If the raw binding signal was above background, this binding signal was divided by that of another peptide with identical amino acid sequence without any modification (y axis, in log scale). Error bar: standard deviation of the mean. *: signal > 3-fold background in one array. **: signal > 3-fold background in both arrays. (C) Relative levels (y axis) of co-localization of SMARCAD1 and each epigenetic modification (x axis), using the entire genome (blue bars) or OCT4 (orange bars) as the controls. Odds ratio > 1 or < 1 corresponds to an increased or decreased level of co-localization. (D) Cumulative counts of overlaps (y axis) of SMARCAD1 and H3R26Cit peaks, ordered by the significance (MACS reported p-value) of H3R26Cit peaks (x axis). Red curve shows the overlaps from a permutation analysis where SMARCAD1 peaks were randomly shifted to other genomic locations, while keeping the size of each peak and the locations of the H3R26Cit peaks.
Figure 3
Figure 3. Smarcad1 knockdown in mouse ES cells
Mouse ES cells transfected with a control shRNA (A) and a Smarcad1 targeting shRNA (B). AP staining of control (C) and SMARCAD1 KD cells (D). (E) RT-PCR derived expression fold changes between Smarcad1 KD and control knockdown cells (Control). Error bars were derived from three biological replicates. (F) Western blots. pSuper: empty vector control. Luci: control knockdown. RNAi1, RNAi2: two shRNAs targeting different parts of Smarcad1 mRNA. (G) Xist expression measured by qPCR in control (Luciferase KD) El16.6 (green) and Smarcad1 KD El16.6 ES cells (yellow). (H) Proportions of injected embryos with ICM integration. (I–J) Control (Luciferase KD) (I) and Smarcad1 KD (J) ES cells cultured under EpiSC culture condition. (K) Tissues and cell types identified by histological staining of EBs derived from SMARCAD1 KD E14 ES cells. Scar bar = 100 μm in panels A–D, and I–K.
Figure 4
Figure 4. Epigenomic difference between Smarcad1 KD and ES cells
(A) H3K4me3 changes (log ratio) between Smarcad1 KD and control ES cells (x axis), versus H3K4me3 changes (log ratio) between EpiSC and ES cells (y axis). Each dot represents an H3K4me3 peak identified in either EpiSC or ES cells. A total of 27,431 peaks (the union of 16,115 peaks in ES cells and 28,431 peaks in EpiSC) are plotted. (B–C) Average H3K4me3 ChIP-seq intensities (y axis) in Smarcad1 KD cells (red), ES cells (green), and EpiSC cells (yellow), in a total of 565 Smarcad1 KD induced peaks (B), and a total of 496 Smarcad1 KD repressed peaks (C). (D) H3K27ac differences between Smarcad1 KD and ES cells (x axis) versus H3K27ac changes between EpiSC and ES cells (y axis) on the union of H3K27ac peaks (43,797) identified from EpiSC and ES cells. (E) H3K27ac distribution near the Kdm5b locus in ES cells, Smarcad1 KD, and EpiSC, marked with previously (Factor et al.) identified ES-specific peaks (blue) and EpiSC-specific peaks (pink). H3K27ac in Smarcad1 KD exhibited reduced signals in 3 ES-specific peaks and increased signals in the EpiSC-specific peak (marked with arrows). A new H3K27ac peak was identified (yellow), where both EpiSC and Smarcad1 KD exhibited increased signals as compared to ES cells. (F–G) Western blots of H3K9me2 (F) and H3K9me3 (G) in Control (Luciferase KD) and Smarcad1 KD (KD) mouse ES cells. (H) Average H3K9me3 ChIP-Seq signals (read counts per 5×10⁷ reads, color bar) in ES cells (left) and Smarcad1 KD cells (right) are plotted against the distances to peak centers (x axis, peak center = 0) of 9 chromatin binding proteins (rows). A total of 10,000 random genomic locations are also included (last row).
Figure 5
Figure 5. SMARCAD1 and H3K9me3 changes in Cl-Amidine treatment
(A) SMARCAD1 ChIP-seq intensities in Cl-Amidine treated (Cl+) and untreated ES cells. (B–F) H3K9me3 ChIP-seq intensities in Cl+ and ES cells in 10,000 random genomic regions (B), OCT4, NANOG, CTCF, H3K4me3, H3K4me3 ChIP-seq peaks (C), H3R26Cit peaks (D), SMARCAD1 peaks (E), and the overlaps of H3R26Cit and SMARCAD1 peaks (F). All peaks were defined by ChIP-seq in ES cells. (G) A genome browser view of H3R26Cit, SMARCAD1, H3K9me3 ChIP-seq in ES cells, H3K9me3 in Smarcad1 KD cells, H3K9me3 in Cl+ ES cells, and IgG ChIP-seq and MNase-seq in ES cells.
Figure 6
Figure 6. Variation of SMARCAD1 ChIP-seq in male (E14) and female (Wu1) ES cells
The mappable portion of the genome (mm9) was separated into a total of 4,854,116 non-overlapping 500-bp bins. A subset of 5,000 bins were drawn at random for plotting (A–C). (A) Scatter plot of the ratio of SMARCAD1 and IgG ChIP-seq reads in 500-bp bins in E14 (x axis) and in Wu1 (y axis). (B) Scatter plot between two biological replicates (GSM1199184 on y axis, GSM2111307 on x axis). Each dot is a ratio of H3K27me3 and IgG ChIP-seq reads in a 500 bp bin. (C) Scatter plot of ratio between ESET ChIP-seq and IgG ChIP-seq reads in E14 (GSM440256) (x axis) and V6.5 ES cells (GSM459273) (y axis). (D) Genome browser view of SMARCAD1 ChIP-seq in E14 and Wu1 cells, and H3K9me3 in E14 and in Smarcad1 KD cells (E14-KD). MNase-seq: sequencing of input DNA fragmented by MNase. (E) A speculated model for the role of SMARCAD1 in regulating the naïve pluripotent state. Naïve pluripotent, primed pluripotent, and differentiated cells are situated on an epigenetic landscape (dark curve). In this model, SMARCAD1 contributes to keep cells at the highest position on the epigenetic landscape, by translating H3Cit into an inhibitory signal of H3K9me3.

Similar articles

Cited by

References

    1. ACTIVEMOTIF. MODified(TM) Histone peptide Array Manual. 2014 Available: http://www.activemotif.com/documents/1691.pdf.
    1. ADRA CN, DONATO JL, BADOVINAC R, SYED F, KHERAJ R, CAI H, MORAN C, KOLKER MT, TURNER H, WEREMOWICZ S, SHIRAKAWA T, MORTON CC, SCHNIPPER LE, DREWS R. SMARCAD1, a novel human helicase family-defining member associated with genetic instability: cloning, expression, and mapping to 4q22-q23, a band rich in breakpoints and deletion mutants involved in several human diseases. Genomics. 2000;69:162–73. - PubMed
    1. BILODEAU S, KAGEY MH, FRAMPTON GM, RAHL PB, YOUNG RA. SetDB1 contributes to repression of genes encoding developmental regulators and maintenance of ES cell state. Genes Dev. 2009;23:2484–9. - PMC - PubMed
    1. BRONS IG, SMITHERS LE, TROTTER MW, RUGG-GUNN P, SUN B, CHUVA DE SOUSA LOPES SM, HOWLETT SK, CLARKSON A, AHRLUND-RICHTER L, PEDERSEN RA, VALLIER L. Derivation of pluripotent epiblast stem cells from mammalian embryos. Nature. 2007;448:191–5. - PubMed
    1. CHEN K, XI Y, PAN X, LI Z, KAESTNER K, TYLER J, DENT S, HE X, LI W. DANPOS: dynamic analysis of nucleosome position and occupancy by sequencing. Genome Res. 2013;23:341–51. - PMC - PubMed

MeSH terms