. 2017 Mar 28;18(13):3143-3154.
doi: 10.1016/j.celrep.2017.03.010.

Enhanced Degradation of Misfolded Proteins Promotes Tumorigenesis

Affiliations

Enhanced Degradation of Misfolded Proteins Promotes Tumorigenesis

Liang Chen et al. Cell Rep. .

Abstract

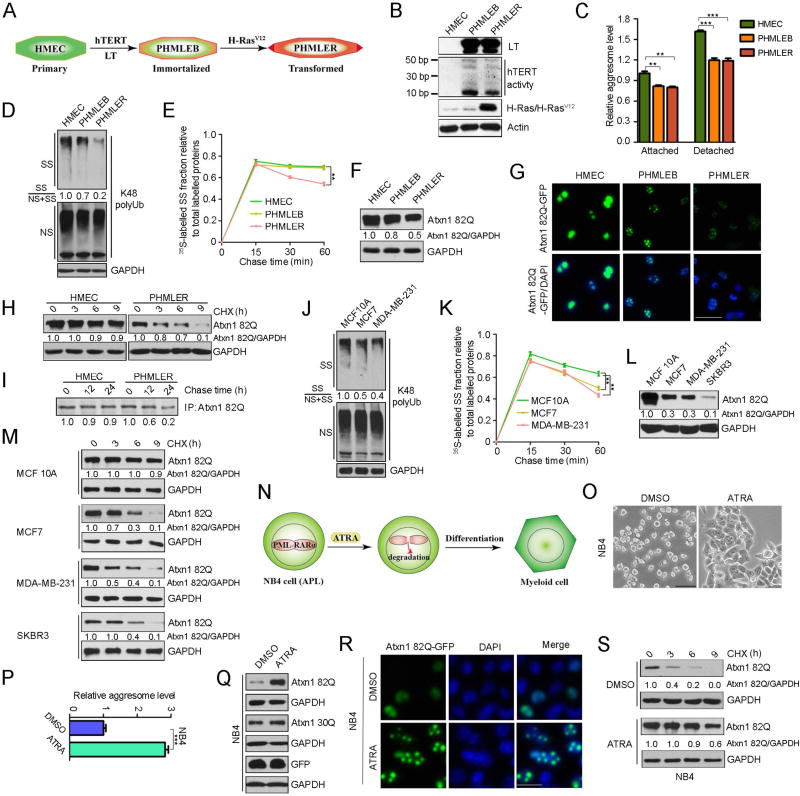
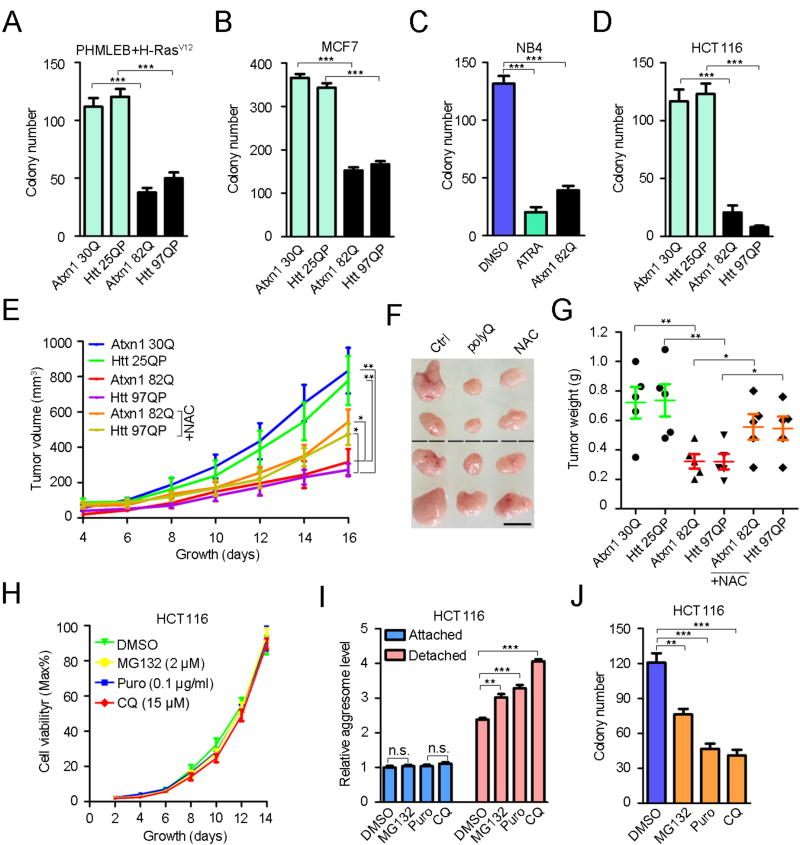
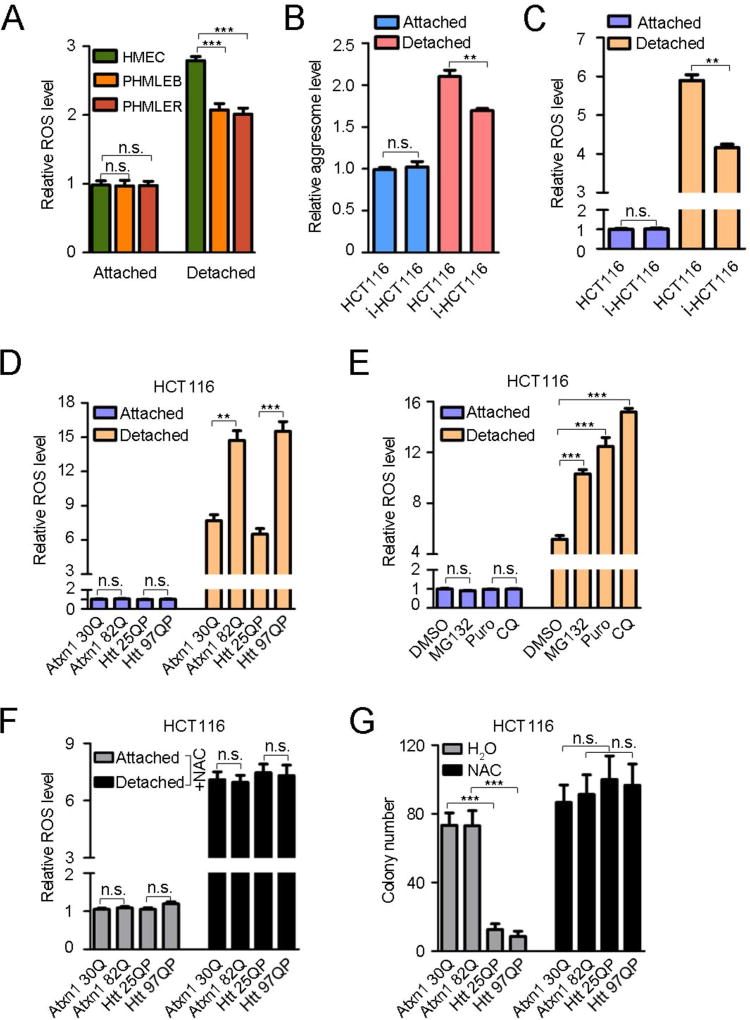
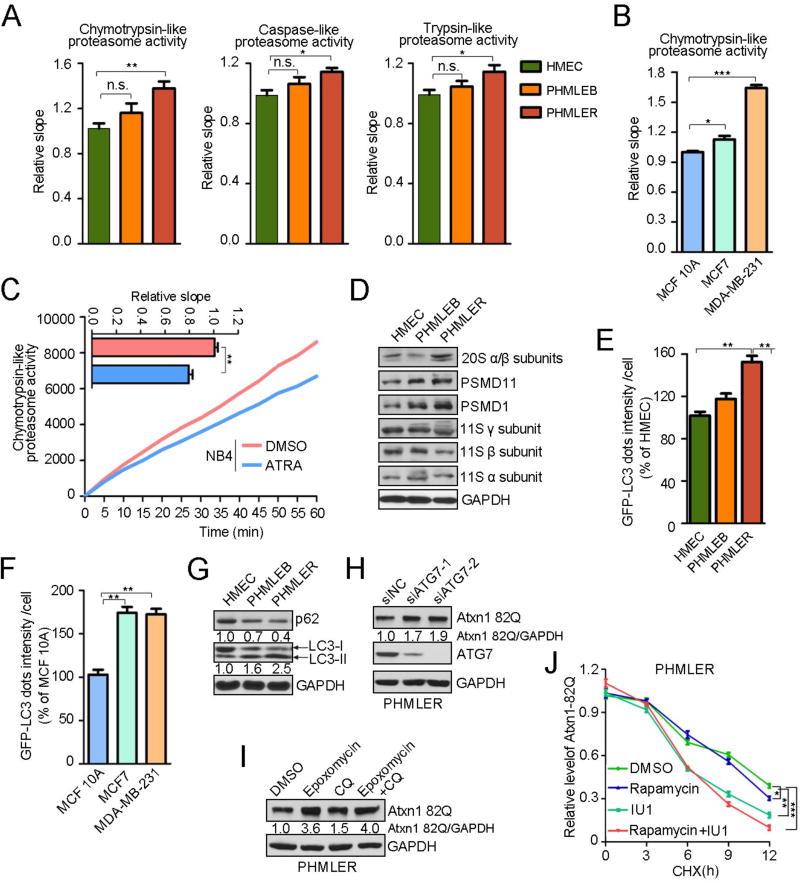
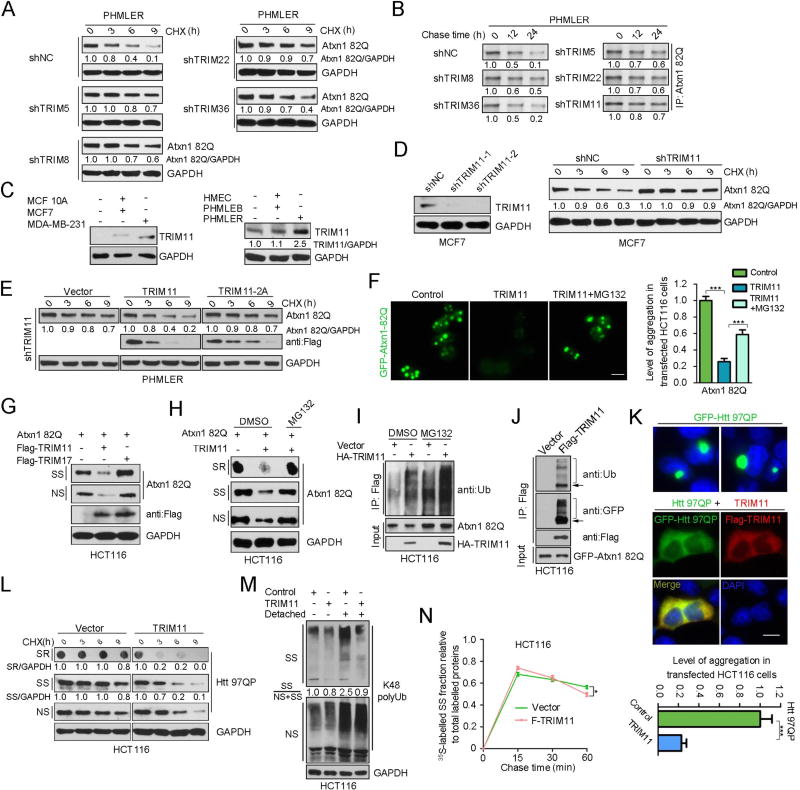
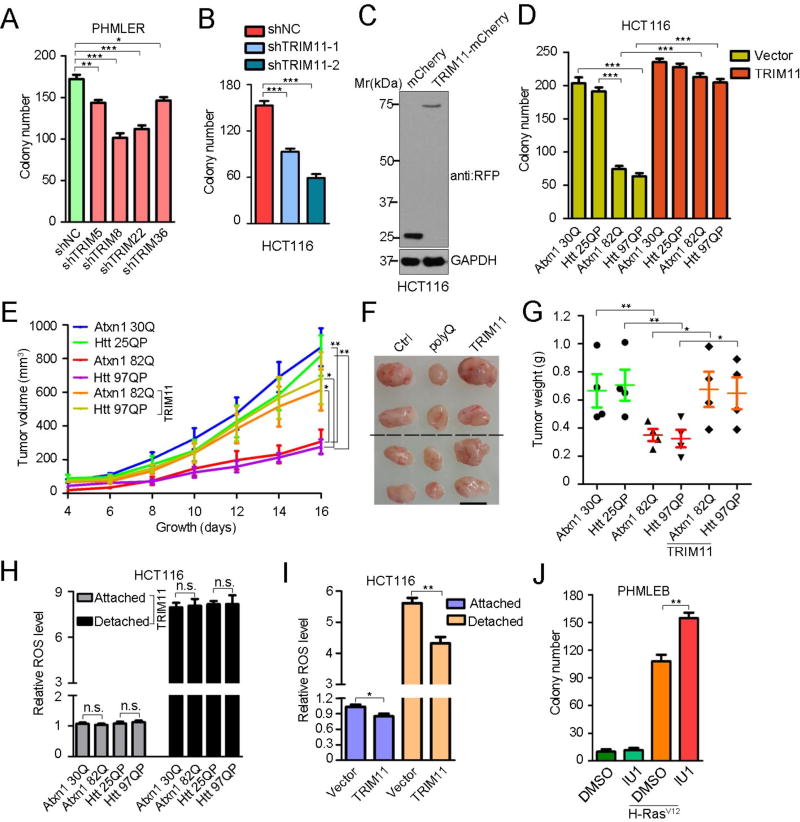
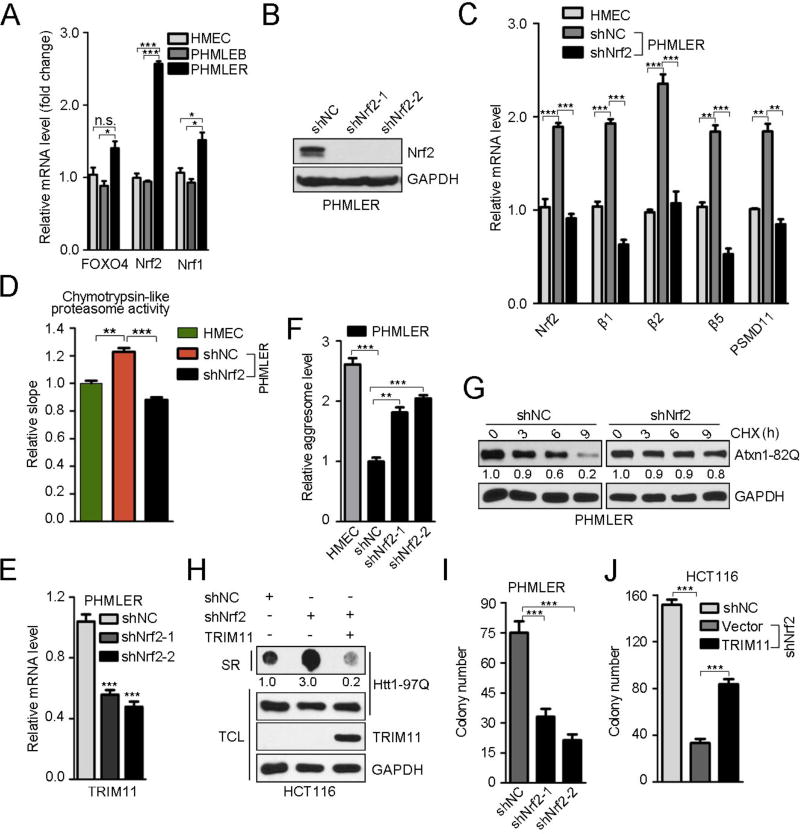
An adequate cellular capacity to degrade misfolded proteins is critical for cell survival and organismal health. A diminished capacity is associated with aging and neurodegenerative diseases; however, the consequences of an enhanced capacity remain undefined. Here, we report that the ability to clear misfolded proteins is increased during oncogenic transformation and is reduced upon tumor cell differentiation. The augmented capacity mitigates oxidative stress associated with oncogenic growth and is required for both the initiation and maintenance of malignant phenotypes. We show that tripartite motif-containing (TRIM) proteins select misfolded proteins for proteasomal degradation. The higher degradation power in tumor cells is attributed to the upregulation of the proteasome and especially TRIM proteins, both mediated by the antioxidant transcription factor Nrf2. These findings establish a critical role of TRIMs in protein quality control, connect the clearance of misfolded proteins to antioxidant defense, and suggest an intrinsic characteristic of tumor cells.

Keywords: Nrf2; PML; ROS; TRIM proteins; TRIM11; breast cancer; misfolded proteins; proteasome; protein quality control; transformation.


Figures

Figure 1
Figure 1. The capacity to clear misfolded proteins is increased during oncogenic transformation and decreased during tumor cell differentiation
(A and B) Schematic diagram of (A), and protein expression/activity in (B), the HMEC transformation model. (C) Relative levels of aggresomes in matrix-attached and -detached HMEC, PHMLEB, and PHMLER. (D and J) Reduced K48 polyUb-modified proteins during HMEC transformation (D) and in breast cancer cells (J). NS, NP-40-soluble; SS, NP-40-insoluble and SDS-soluble. Relative ratios of K48 polyUb in the SS versus total (NS + SS) fractions were quantitated based on three independent experiments (n = 3; SD = ±4%). (E and K) Increased clearance of DRiPs during HMEC transformation (E) and in breast cancer cells (K). Relative ratios of [35S]Met-labeled proteins in the SS (DRiPs) fractions versus total labeled proteins (NS + SS) are shown (n = 3; SD = ±2%). The representative images are shown in Figures S1D and S1H. (F and L) Levels of Flag-Atxn1 82Q stably expressed in the indicated cells, and relative Atxn1 82Q/GAPDH ratios (n = 3; SD = ±3%). (G) Representative images of cells stably expressing Atxn1 82Q-GFP (green) and stained with DAPI (blue). Scale bar, 50 µm. (H and M) Stability of Flag-Atxn1 82Q analyzed by cycloheximide (CHX) chase. Relative Atxn1 82Q/GAPDH ratios are shown (n = 3; SD = ±2%). (I) Stability of Flag-Atxn1 82Q analyzed by pulse-chase. Atxn1 82Q was immunoprecipitated. Levels of [35S]-labeled Atxn1 82Q relative to time 0 are indicated (n = 3; SD = ±2%). (N) Schematic diagram of ATRA-induced NB4 differentiation. (O and P) Morphology of (O; scale bar, 50 µm), and relative levels of aggresomes in (P), NB4 cells treated with vehicle (DMSO) or ATRA (1 µM). (Q) Levels of GFP-Atxn1 82Q, GFP-Atxn1 30Q, and GFP stably expressed in DMSO- or ATRA-treated NB4 cells. (R and S) Expression (R) and stability (S) of Atxn1 82Q-GFP expressed in DMSO- and ATRA-treated NB4 cells were examined by fluorescence microscope (R; scale bar, 50 µm) and CHX chase (S), respectively. In (C), (E), (K) and (P), data represent mean or mean ± SEM (n = 3). See also Figures S1.
Figure 2
Figure 2. Misfolded proteins impede both the initiation and maintenance of malignant phenotypes
(A) Soft agar colony formation assay of PHMLEB cells stably expressing polyQ proteins and infected with H-RasV12 retroviruses. (B–D) Soft agar colony formation assay of MCF7 (B), NB4 (C), and HCT116 (D) cells stably expressing polyQ proteins, as well as NB4 cells treated with and without ATRA (C). (E–G) HCT116 cells expressing polyQ proteins were subcutaneously xenografted into nude mice, which were given water with or without 40 mM NAC. Shown are tumor growths over time (E; n = 5) and representative images (F) and weights (G) of tumors at day 16. In (F), the black dash line separates two independent repeat groups; scale bar, 1 cm. (H and J) Growth of HCT116 cells on adherent plates (H) and in soft agar (J) in the presence of DMSO (vehicle), MG132 (2 µM), Puro (0.1 µg/ml), or CQ (15 µM). (I) Aggresomes in matrix-attached and -detached HCT116 cells treated with DMSO, MG132, Puro, or CQ as in (H). Values are presented as mean (H) or mean ± SEM (the rest) (n = 3). See also Figure S2.
Figure 3
Figure 3. Enhanced capability to clear misfolded proteins alleviates oxidative stress during anchorage-independent growth
(A) Levels of ROS in matrix-attached and -detached HMEC, PHMLEB, and PHMLER. (B and C) Levels of aggresomes (B) and ROS (C) in matrix-attached and -detached HCT116 and i-HCT116 cells. (D–F) Levels of ROS in matrix-attached and -detached HCT116 cells expressing polyQ proteins in the absence (D) or presence (F) of 2 mM NAC, or HCT116 cells treated with DMSO, MG132, Puro, or CQ as in Figure 2H (E). (G) Formation of colonies in soft agar by HCT116 cells expressing polyQ proteins in the absence or presence of 2 mM NAC. Values are presented as mean ± SEM (n = 3). See also Figure S3.
Figure 4
Figure 4. Increase of proteasome and autophagic activities in tumor cells
(A) All three proteasome activities in HMECs, PHLMEB, and PHLMER cells measured by fluorometric substrate (Figures S4E–S4G). Shown are slopes relative to that of HMEC. n = 6 (HMEC), 5 (PHMLEB), or 7 (PHMLER). (B and C) The chymotrypsin-like proteasome activity in MCF10A, MCF7, and MDA-MB-231 cells (B; Figure S4H), or DMSO- and ATRA-treated NB4 cells (C). n = 7 (MCF 10A), 8 (MCF7, MDA-MB-231, and NB4-DMSO), or 9 (NB4-ATRA). (D) Levels of 20S proteasome subunits in the HMEC, PHLMEB, and PHLMER. (E and F) The intensity of GFP-LC3 dots in the indicated cells relative to HMEC (E) or MCF 10A (F), quantified from 300 cells for each sample. (G) Levels of p62 and LC3 in HMEC, PHLMEB, and PHMLER cells. Relative p62/GAPDH and LC3-II/GAPDH ratios are shown (n = 3; SD = ±3%). (H) Levels of Atxn1 82Q in PHMLER cells transfected with a control (siNC) and two independent ATG7 siRNAs. Relative ratios of Atxn1 82Q versus GAPDH are indicated (n = 3; SD = ±3%). (I) Levels of Atxn1 82Q in PHMLER cells treated with DMSO (vehicle), epoxomycin (2 µM), CQ (50 µM), or both epoxomycin and CQ for 8 h. Relative Atxn1 82Q/GAPDH ratios are shown (n = 3; SD = ±3%). (J) Stability of Atxn1 82Q in PHMLER cells treated with DMSO (vehicle), IU1 (50 µM), rapamycin (100 nM), or both IU1 and rapamycin for 12 h. Relative ratios of Atxn1 82Q and GAPDH were quantified (n = 3). In (A–C), (E–F) and (J), data represent mean ± SEM (n = 3 unless otherwise indicated). See also Figure S3.
Figure 5
Figure 5. TRIM11 mediates the degradation of misfolded protein in both the nucleus and the cytoplasm
(A and B) Increased stability of Atxn1 82Q in PHMLER cells devoid of TRIM5, 8, 22, or 36, assayed by CHX chase (A) or pulse-chase (B). Relative Atxn1 82Q/GAPDH ratios (A) and levels of [35Met]-labeled Atxn1 82Q (B) are indicated (n =3; SD = ±2%). shNC, control shRNA. (C) Increased expression of TRIM11 in breast cancer cells (left) and during HMEC transformation (right). (D) MDA-MB-231 cells stably expressing shNC and TRIM11 shRNAs were analyzed for protein expression (left) and Atxn1 82Q stability (right). (E) Stability of the Atxn1 82Q in TRIM11-depeleted PHMLER cells infected with control lentiviruses (vector), or lentiviruses expressing shRNA-resistant Flag-TRIM11 or Flag-TRIM11-2A. Relative Atxn1 82Q/GAPDH ratios are indicated (n =3; SD = ±2%). (F and K) Reduction of Atxn1 82Q and Httex1p 97QP aggregates by TRIM11. HCT116 cells expressing Atxn1 82Q-GFP or Httex1p 97QP-GFP, alone or together with TRIM11, were treated with DMSO or MG132 (F) or untreated (K). Shown are images of GFP fusion proteins in cells (scale bar, 10 µm) and relative numbers of polyQ inclusions (mean ± SEM, n = 3, counted from 200 cells). (G) Reduction of Atxn1 82Q levels in HCT116 cells by TRIM11, but not TRIM17. (H) Proteasomal degradation of Atxn1 82Q mediated by TRIM11. Cells transfected with the indicated plasmids and treated with DMSO or MG132 (10 µM) were analyzed by Western blot (NS and SS fractions) and filter retardation assay (for the NP-40- and SDS-resistant or SR fraction). (I) Ubiquitination of Atxn1 82Q mediated by TRIM11. Flag-Atxn1 82Q-expressing HCT116 cells were transfected with vector or HA-TRIM11, and treated with DMSO or MG132. Extracts containing comparable levels of unmodified Flag-Atxn1 82Q were used for immnoprecipitation with anti-Flag antibody. (J) GFP-Atxn1 82Q was expressed in HCT116 cells alone or together with Flag-TRIM11. Cell lysates containing comparable amount of Atxn1 82Q were analyzed for the Atxn1 82Q-TRIM11 interaction and Atxn1 82Q ubiquitination. Arrows indicate unmodified Atxn1 82Q. (L) Acceleration of Httex1p 97QP degradation in HCT116 cells by TRIM11. Relative ratios of Httex1p 97QP/GAPDH are indicated (n =3; SD = ±2%). (M) K48 polyUb-modified proteins in matrix-attached or -detached HCT116 cells with and without TRIM11 overexpression. Relative ratios of SS versus total (NS+SS) fractions are shown (n = 3; SD = ±4%). (N) TRIM11 accelerates degradation of DRiPs in HCT116 cells Levels of DRiPs relative to the total [35S]labeled proteins over time are shown (n = 3). See also Figures S4 and S5.
Figure 6
Figure 6. Involvement of TRIM proteins in oncogenic growth
(A, B, and D) Formation of colonies in soft agar by PHMLER or HCT116 cells expressing shNC or the indicated TRIM shRNAs (A and B), or HCT116 cells expressing the indicated polyQ proteins alone or together with TRIM11 (D). (C) HCT116 cells stably expressing mCherry and TRIM11-mCherry. (E–G) HCT116 cells expressing the indicated polyQ protein, alone or together with TRIM11, were subcutaneously injected into nude mice. Shown are average tumor volumes over time (n = 4) (E), and representative image (F) and weights (G) of tumors at day 16. In (F), the black dash line separates two independent repeat groups; scale bar, 1 cm. (H and I) Relative ROS levels in matrix-attached and -detached HCT116 cells (H and I) stably expressing the indicated polyQ proteins and TRIM11 (H), or without and with TRIM11 overexpression (I). (J) Formation of colonies in soft agar by PHMLEB cells infected with the H-RasV12 retroviruses in the presence of the vehicle (DMSO) or IU1 (50 µM). All values are presented as mean ± SEM (n = 3 unless otherwise indicated). See also Figure S6.
Figure 7
Figure 7. Regulation of TRIMs by Nrf1 and Nrf2, and role of TRIM11 in Nrf2-mediated tumor growth
(A) Relative FOXO4, Nrf1, and Nrf2 mRNA levels during HMEC transformation. (B–G, and I) shRNA-mediated knockdown of Nrf2 in PMHLER cells (B) and its effect on mRNA levels of proteasome subunits (C), chymotrypsin-like activity of the proteasome (n = 6 or 7) (D), TRIM11 mRNA levels (E), aggresomes (F), the degradation of Atxn1 82Q (for Atxn1 82Q/GAPDH ratios, n = 3, SD = ±2%) (G), and anchorage-independent growth (I). (H) Httex1p 97QP-expresing HCT116 cells were transfected with shNC, Nrf2 shRNA, and TRIM11 in the indicated combination, and analyzed by Western blot (for total cell lysates, TCL) or dot blot (for SR fraction). Relative Httex1p 97QP/GAPDH ratios are shown (n = 3, SD = ±2%). (J) Formation of colonies in soft agar by HCT116 cells stably expressing shNC or Nrf2 shRNA alone, or Nrf2 shRNA plus TRIM11. Values represent mean ± SEM (n = 3), unless otherwise indicated. See also Figure S7 and Table S2.

References

    1. Arlt A, Bauer I, Schafmayer C, Tepel J, Muerkoster SS, Brosch M, Roder C, Kalthoff H, Hampe J, Moyer MP, et al. Increased proteasome subunit protein expression and proteasome activity in colon cancer relate to an enhanced activation of nuclear factor E2-related factor 2 (Nrf2) Oncogene. 2009;28:3983–3996. - PubMed
    1. Balch WE, Morimoto RI, Dillin A, Kelly JW. Adapting proteostasis for disease intervention. Science. 2008;319:916–919. - PubMed
    1. Calderwood SK, Gong J. Heat shock proteins promote cancer: it's a protection racket. Trends Biochem Sci. 2016;41:311–323. - PMC - PubMed
    1. Chu Y, Yang X. SUMO E3 ligase activity of TRIM proteins. Oncogene. 2011;30:1108–1116. - PMC - PubMed
    1. Curtis C, Shah SP, Chin SF, Turashvili G, Rueda OM, Dunning MJ, Speed D, Lynch AG, Samarajiwa S, Yuan Y, et al. The genomic and transcriptomic architecture of 2,000 breast tumours reveals novel subgroups. Nature. 2012;486:346–352. - PMC - PubMed

Publication types

MeSH terms