. 2017 Mar 28;18(13):3167-3177.
doi: 10.1016/j.celrep.2017.03.003.

A Sequentially Priming Phosphorylation Cascade Activates the Gliomagenic Transcription Factor Olig2

Affiliations

A Sequentially Priming Phosphorylation Cascade Activates the Gliomagenic Transcription Factor Olig2

Jing Zhou et al. Cell Rep. .

Abstract

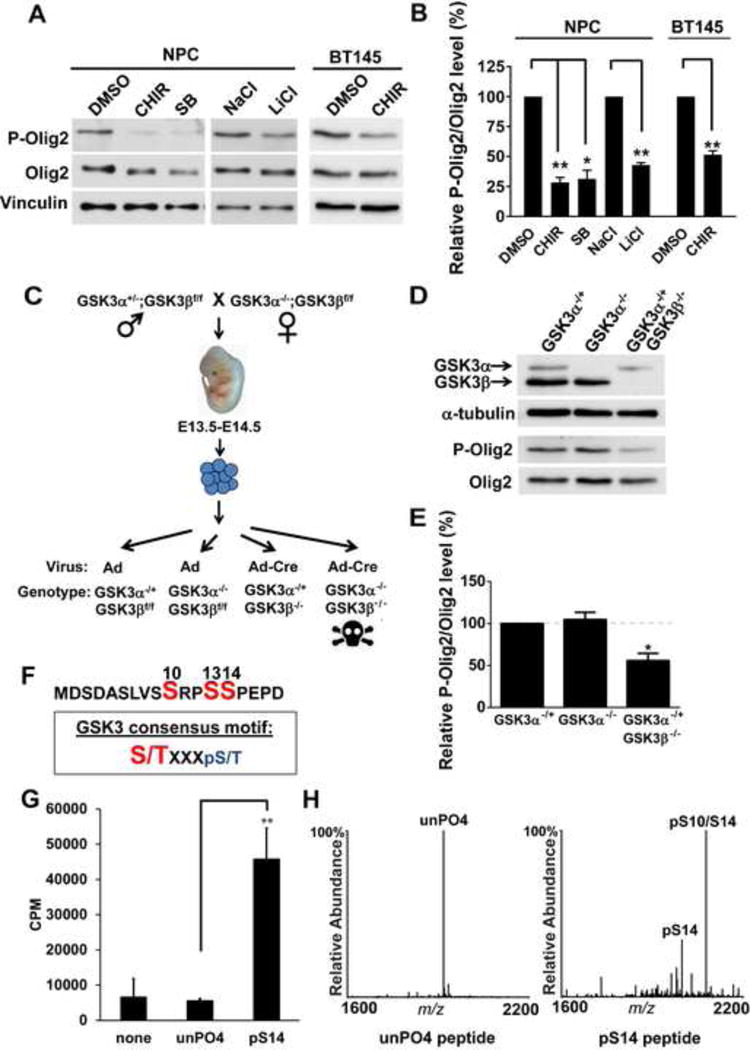
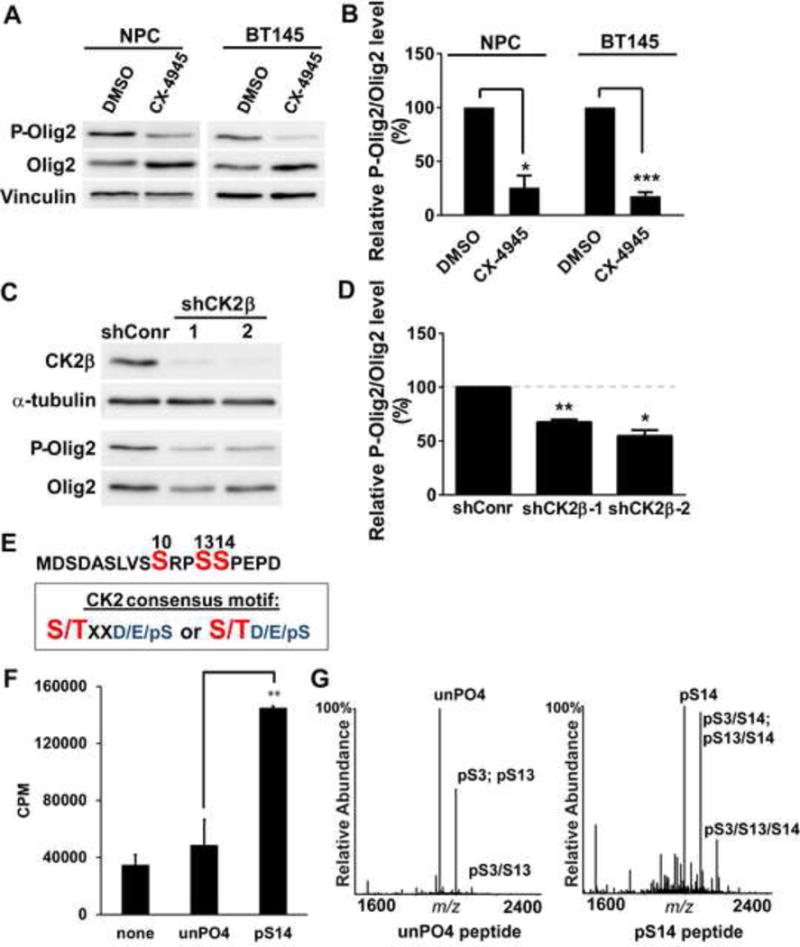
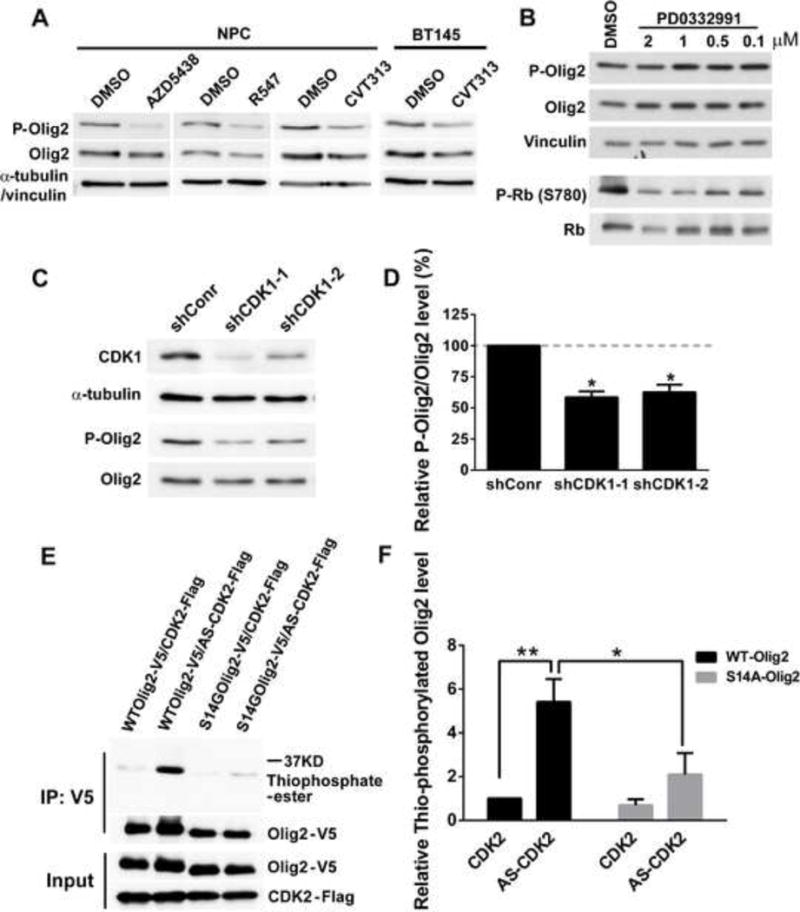
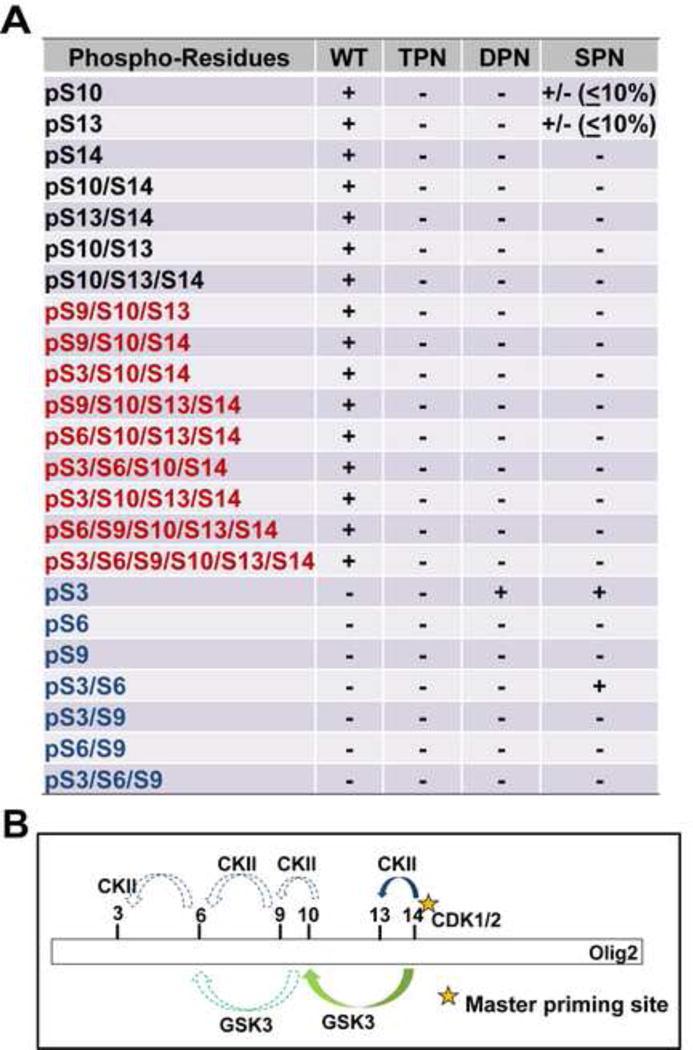
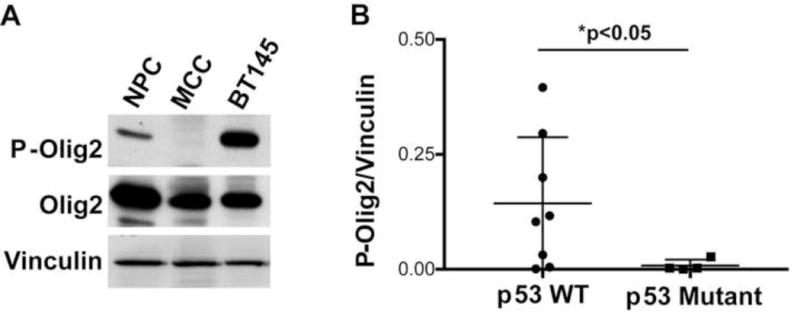
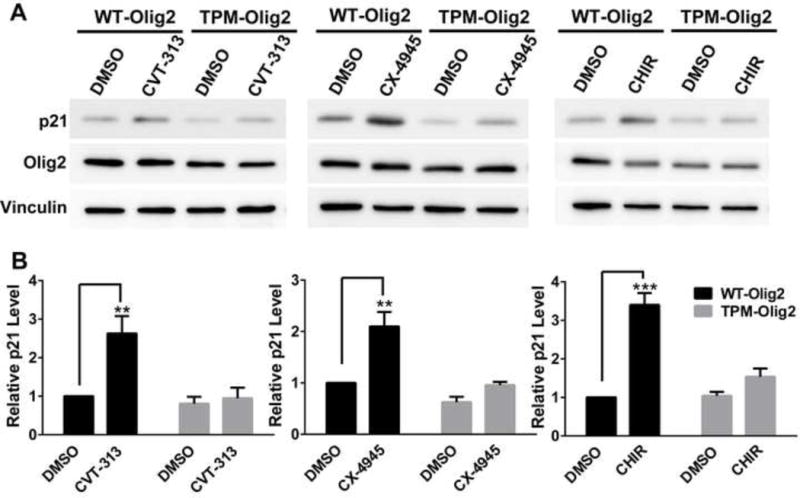
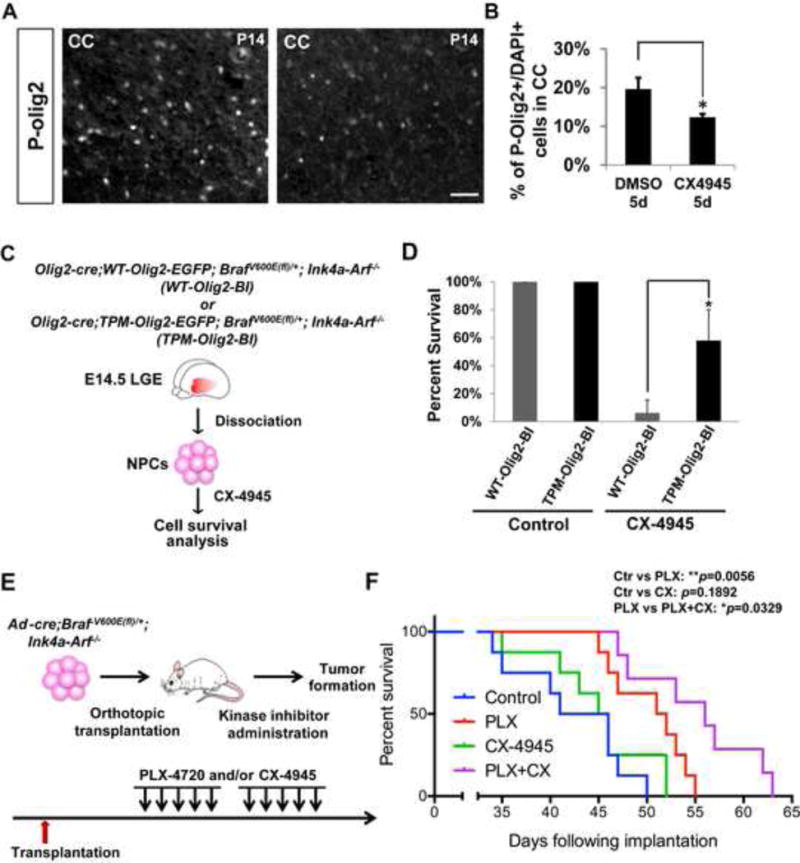
During development of the vertebrate CNS, the basic helix-loop-helix (bHLH) transcription factor Olig2 sustains replication competence of progenitor cells that give rise to neurons and oligodendrocytes. A pathological counterpart of this developmental function is seen in human glioma, wherein Olig2 is required for maintenance of stem-like cells that drive tumor growth. The mitogenic/gliomagenic functions of Olig2 are regulated by phosphorylation of a triple serine motif (S10, S13, and S14) in the amino terminus. Here, we identify a set of three serine/threonine protein kinases (glycogen synthase kinase 3α/β [GSK3α/β], casein kinase 2 [CK2], and cyclin-dependent kinases 1/2 [CDK1/2]) that are, collectively, both necessary and sufficient to phosphorylate the triple serine motif. We show that phosphorylation of the motif itself serves as a template to prime phosphorylation of additional serines and creates a highly charged "acid blob" in the amino terminus of Olig2. Finally, we show that small molecule inhibitors of this forward-feeding phosphorylation cascade have potential as glioma therapeutics.

Keywords: CDK; CK2; GSK3; NPCs; Olig2; casein kinase 2; cyclin-dependent kinase; glioma; glycogen synthase kinase 3; neural progenitor cells; phosphorylation; protein kinase.


Figures

Figure 1
Figure 1. GSK3 phosphorylates Olig2 at S10
(A and B) Inhibition of GSK3 results in reduced Olig2 phosphorylation. Mouse NPCs and BT145 human glioma cells treated with GSK3 inhibitors, CHIR99021(CHIR), SB216763(SB) or LiCl for 4 hours show a decrease in P-Olig2 level, in comparison to control cells that were treated with either DMSO or NaCl. 5 μm CHIR99021, 10 μm SB216763, 10 mM of NaCl and 10 mM LiCl were used. Relative P-Olig2/Olig2 levels were quantified and compared between control and inhibitor-treated group. Data were analyzed by t-test and are represented as mean ± SEM. *p<0.05, **p<0.01, n=3. (C) A schematic diagram shows generation of mouse GSK3α- and β-knockout NPC lines. Control adeno or adeno-cre virus was introduced to generate GSK3α- or GSK3β-knockout NPC lines. (D and E) GSK3α and β function redundantly to phosphorylate Olig2. P-Olig2 levels were examined in GSK3α−/+, GSK3α −/−, and GSK3α−/+GSK3β−/− NPCs. Relative P-Olig2/Olig2 were quantified and compared between different groups. Data were analyzed by t-test and are represented as mean ± SEM. *p<0.05, n=3. (F) GSK3 consensus motif fits the S10 site upon phosphorylation at S14. S/T (highlighted with red), the kinase’s target Serine/Threonine residue; X, any amino acid; pS, phosphorylated serine. (G) in vitro kinase assay shows that GSK3 phosphorylates Olig2 N-terminal peptide, however, it requires a priming phosphorylation at S14. Synthetic Olig2 N-terminal peptides (a.a.1–18) were used, and both unphosphorylated Olig2 N-terminal peptide (unPO4) and phosphorylated peptide at S14 (pS14) were tested. Reactions without peptides (none) served as negative control. Data were analyzed by t-test and are represented as mean ± SEM. n=3; **p<0.01. (H) Mapping the GSK3 phosphorylation sites by mass spectrometry analysis. in vitro kinase reactions were analyzed by MALDI-MS and −MS/MS. The doubly phosphorylated peptide at S14 and S10 is indicated by pS14/S10.
Figure 2
Figure 2. CK2 phosphorylates Olig2 at S13
(A) Immunoblot assay. Mouse NPCs and BT145 human glioma cells were treated with the CK2 inhibitor CX-4945 (20 μM) for 4 hours. Cell lysates were size fractionated by polyacrylamide gel electrophoresis and immunoblotted with P-Olig2 and Olig2 antibodies. (B) Quantification of immunoblot assays. Relative P-Olig2/Olig2 levels were quantified and compared between control and inhibitor-treated group. Data were analyzed by t-test and are represented as mean ± SEM. *p<0.05 and ***p<0.001, n=3. (C) Genetic validation of inhibitor data. CK2β was knocked down in wild-type mouse NPCs by lentiviral vectors that express shRNAs targeting mCK2β. Cells that were stably transduced with lentivirus that encode non-target shRNA served as a control (shConr). (D) Quantification of knock-down data. Relative P-Olig2/Olig2 levels were quantified and compared between the knockdown group and control group. Data were analyzed by t-test and are represented as mean ± SEM. *p<0.05 and **p<0.01, n=3. (E) CK2 consensus motif fits S13 site. S/T (highlighted with red), the kinase’s target Serine/Threonine residue; X, could be any amino acid; pS, phosphorylated serine; D, aspartic acid; E, glutamic acid. (F) in vitro kinase assay demonstrates that CK2 phosphorylates the Olig2 N-terminal peptide, and this phosphorylation is facilitated by the phosphorylation of S14. Synthetic Olig2 N-terminal peptides (a.a.1–18) were generated without phosphorylation (unPO4) and with pre-phosphorylation at S14 (pS14). Reactions without peptides (none) served as negative control. Data were analyzed by t-test and are represented as mean ± SEM. n=3; **p<0.01. (G) Mapping CK2 phosphorylation sites by mass spectrometry analysis. in vitro kinase reactions were analyzed by MALDI-MS and −MS/MS. Peaks shown are pS3 (singly phosphorylated peptide at S3); pS13 (singly phosphorylated peptide at S13); pS3/S13 (doubly phosphorylated peptide at S3 and S13); pS3/S14 (doubly phosphorylated peptide at S3 and S14); pS13/S14 (doubly phosphorylated peptide at S13 and S14); pS3/S13/S14 (triply phosphorylated peptide at S3, S13 and S14).
Figure 3
Figure 3. S14 of Olig2 is phosphorylated by CDK1/2
(A) Mouse NPCs and BT145 human glioma cells treated with CDK1/2 inhibitors show a decrease in P-Olig2 level. AZD5438, CDK1, 2 and 9 inhibitor; R547, CDK1, 2 and 4 inhibitor; CVT313, CDK1 and 2 inhibitor. P-Olig2 and Olig2 levels were examined 4 hr after AZD5438 and R547 treatment or 24 hr after CVT313 treatment in NPCs and 3 hr after CVT313 treatment in BT145 cells. 10 μm AZD5438, 5 μm R547, 10 μM of CVT313 were used. (B) Mouse NPCs treated with CDK4/6 inhibitor, PD0332991, show no obvious change on P-Olig2 level. P-Olig2 and Olig2 levels were examined 4 hr after PD0332991 treatment. (C) Genetic validation of CDK1/2 inhibitor data. Immunoblot assay shows that knock-down of CDK1 in CDK2-knockout NPCs decreases P-Olig2 level. CDK1 was acutely knocked down in CDK2-knockout NPCs by introducing AAV that expresses shRNA targeting mCDK1. Cells transduced with AAV that expresses non-target shRNA served as a control (shConr). The P-Olig2 and Olig2 levels were examined at 48 hr post viral transduction. (D) Quantification of knock-down data. Relative P-Olig2/Olig2 levels were quantified and compared between knockdown group and control group. Data are analyzed by t-test and are represented as mean ± SEM. *p<0.05; n=3. (E) An analog-sensitive kinase assay shows that CDK2 phosphorylates Olig2 at S14 site. (F) Quantification of analog-sensitive kinase assays. Thiophosphorylated Olig2 levels were quantified, normalized to total Olig2, and then compared between different groups. Data were analyzed by two-way ANOVA with Sidak posttest and are represented as mean ± SEM. *p<0.05, **p<0.01; n=4.
Figure 4
Figure 4. Phosphorylation of the triple serine motif enables formation of a hexa-phosphoserine acid blob in the amino terminus of Olig2
(A) Summary of mass spectrometric analyses on Olig2 N-terminal phosphorylated peptides detected in Olig2-null NPCs that were transduced with WT, TPN (S10A/S13A/S14G), DPN (S13A/S14G) or SPN (S14G) Olig2. Black font: phosphorylated peptides identified in previous study (Sun et al., 2011); Red font: newly identified phosphorylated peptides in WT-Olig2 sample; Blue font: contingent phospho peptides that are undetectable or barely detectable in WT-Olig2 sample. +, present; +/− detected but with low level; −, undetectable. (B) A sequentially priming phosphorylation cascade. Schematic diagram shows how the triple serine motif creates priming sites for additional phosphorylations at S3, S6 and S9 that create a hexaphosphate acid blob in the Olig2 amino terminus.
Figure 5
Figure 5. Analysis P-Olig2 levels in a panel of gliomas cells with either wild-type p53 or mutant p53
(A) Immunoblot of P-Olig2 in cycling neural progenitor cells (NPC), adult mouse corpus callosum (MCC) and low passage human glioma cells (BT145 line). (B) Glioma cell lines with intact p53 have significantly higher level of P-Olig2 than p53-mutant glioma cells. The relative P-Olig2/Vinculin levels were analyzed and compared in different glioma cell lines. Data were analyzed by Mann-Whitney test and represented as mean + SEM. n=8 p53 wild-type glioma cells lines (filled circles) and n=4 p53-mutant cell lines (filled boxes). For frame of reference, the P-Olig2/vinculin ratio of cycling mouse neural progenitor cells (open circle) was set at 1.0.
Figure 6
Figure 6. Inhibition of Olig2 phosphorylation enhances p53 function
(A and B) Olig2 kinase inhibitors increase p21 level through inhibiting Olig2 phosphorylation. Olig2-null NPCs were transduced with retroviruses that express either WT-Olig2 or TPM-Olig2. p21 activation upon kinase inhibitor treatment was examined and compared between two NPC lines by western blot analysis. Cells were examined either after 24 hr treatment with 5 μM CVT313 (CDK1/2 inhibitor), or after 8 hr treatment with 10 μM CX-4945 (CK2 inhibitor) or 5 μM CHIR99021 (GSK3 inhibitor). Data were analyzed by two-way ANOVA with Sidak posttest. There is a significant difference between WT-Olig2 and TPM-Olig2 in response to Olig2 kinase inhibitors. Data are represented as mean ± SEM. **p<0.01, ***p<0.001; n=3.
Figure 7
Figure 7. Therapeutic potential of an Olig2 kinase antagonist in a murine model of pediatric low-grade astrocytoma
(A and B) CK2 inhibition decreases P-Olig2 level in vivo. Developing hGFAP-cre; BrafV600E(fl)/+; Ink4a-Arf−/− pups were treated with CK2 inhibitor CX-4945 25 mg/kg intraperitoneally for 5 days and were analyzed at P14. CC, Corpus Callosum. Scale bar, 50μm. Data are represented as mean ± SD. *p<0.05, n=3. (C) Schematic diagram shows generation of two BRAFV600E-transformed NPC lines in an Ink4a-Arf−/− background. The two lines express knock-in, epitope-tagged Olig2 wherein the triple serine motif is either wild type (WT-Olig2-BI) or triple phosphomimetic with the S10D/S13E/S14D substitutions (TPM-Olig2-BI). Of note, the Olig2-cre driver is used to activate expression of the BRAFV600E oncogene, while simultaneously disrupting another endogenous Olig2 allele (Schuller et al., 2008). The resulting mice exhibit early prenatal lethality, which precludes further study in postnatal pups. (D) Proliferation of the TPM-Olig2-BI line is partially resistant to the CK2 antagonist CX-4945. For proliferation assays, 5×10⁴ cells were seeded at Day 0 and 1μM of CX-4945 was added at Day 1. The cell number was assessed at Day 4. Data were analyzed by t-test and represented as mean ± SD. *p<0.05, n=3. (E) Schematic diagram demonstrates orthotopic transplantation and the treatment regimen (see Experimental Procedures). (F) Combination of BRAF and CK2 inhibitors significantly improves survival in an orthotopic model of pediatric glioma. Kaplan-Meier graph is illustrated and Log-rank test was used to determine the survival differences between different treatment groups. *p<0.05, and **p<0.01; n=8.

Similar articles

Cited by

References

    1. Banerjee S, Kundu TK. The acidic C-terminal domain and A-box of HMGB-1 regulates p53-mediated transcription. Nucleic Acids Res. 2003;31:3236–3247. - PMC - PubMed
    1. Banko MR, Allen JJ, Schaffer BE, Wilker EW, Tsou P, White JL, Villen J, Wang B, Kim SR, Sakamoto K, et al. Chemical genetic screen for AMPKalpha2 substrates uncovers a network of proteins involved in mitosis. Mol Cell. 2011;44:878–892. - PMC - PubMed
    1. Bergthold G, Bandopadhayay P, Bi WL, Ramkissoon L, Stiles C, Segal RA, Beroukhim R, Ligon KL, Grill J, Kieran MW. Pediatric low-grade gliomas: how modern biology reshapes the clinical field. Biochim Biophys Acta. 2014;1845:294–307. - PMC - PubMed
    1. Berthet C, Aleem E, Coppola V, Tessarollo L, Kaldis P. Cdk2 knockout mice are viable. Curr Biol. 2003;13:1775–1785. - PubMed
    1. Bouvier C, Bartoli C, Aguirre-Cruz L, Virard I, Colin C, Fernandez C, Gouvernet J, Figarella-Branger D. Shared oligodendrocyte lineage gene expression in gliomas and oligodendrocyte progenitor cells. J Neurosurg. 2003;99:344–350. - PubMed

Publication types