. 2017 Mar 28;18(13):3227-3241.
doi: 10.1016/j.celrep.2017.03.004.

Single-Cell RNA-Seq Reveals Hypothalamic Cell Diversity

Affiliations

Single-Cell RNA-Seq Reveals Hypothalamic Cell Diversity

Renchao Chen et al. Cell Rep. .

Abstract

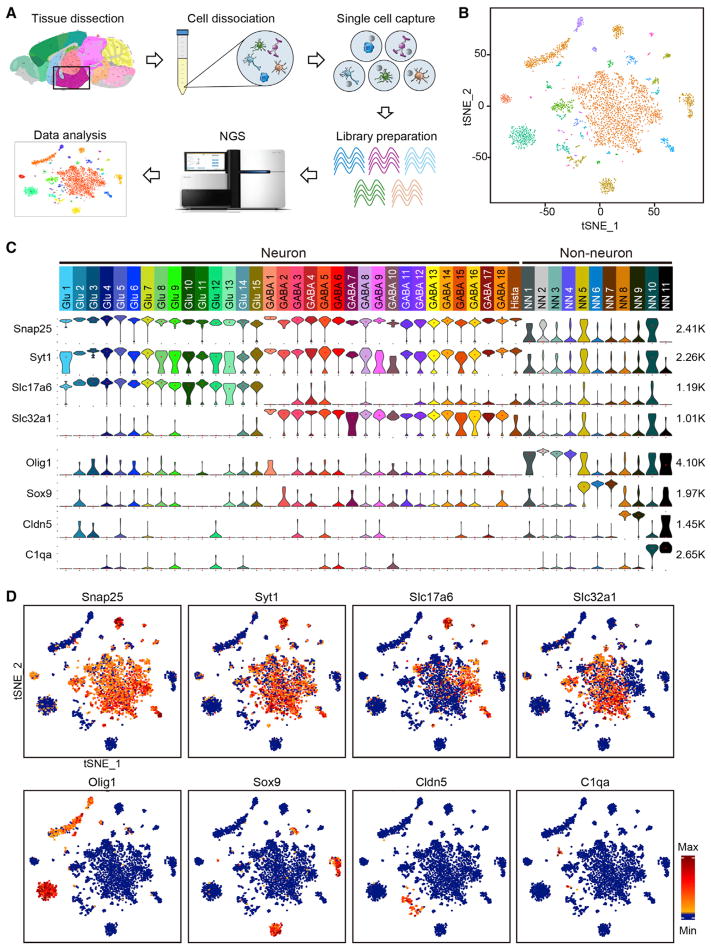
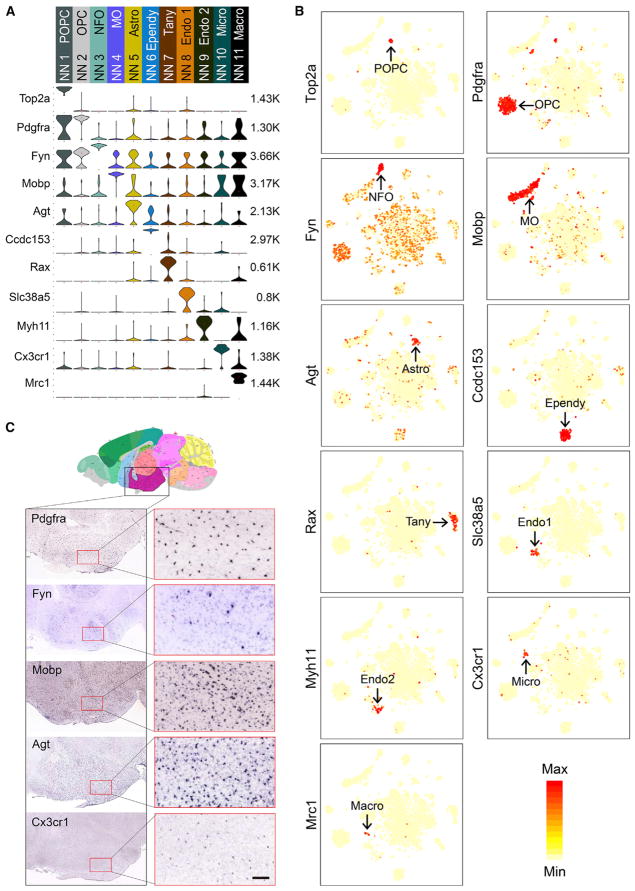
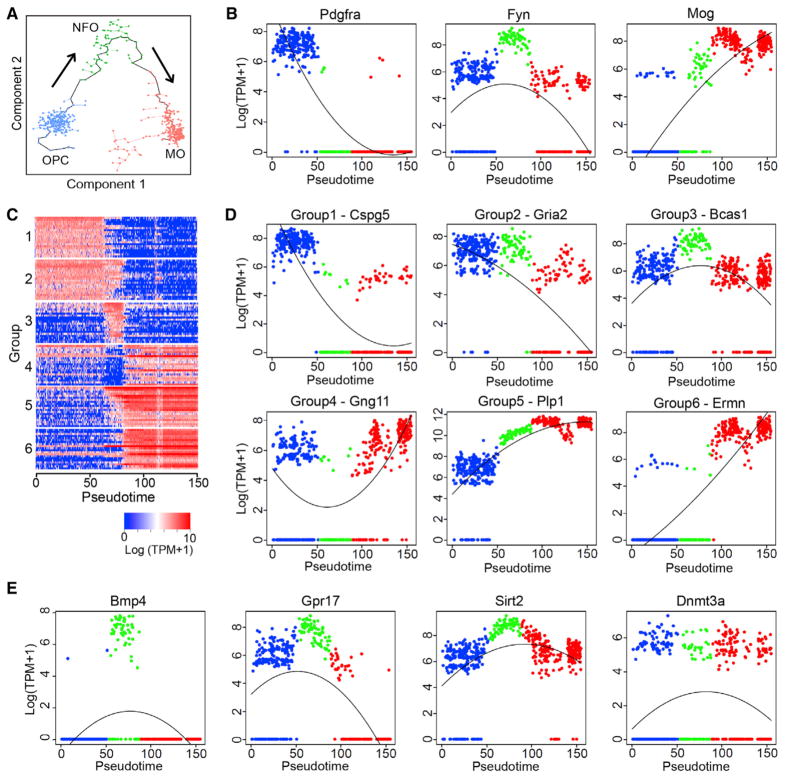
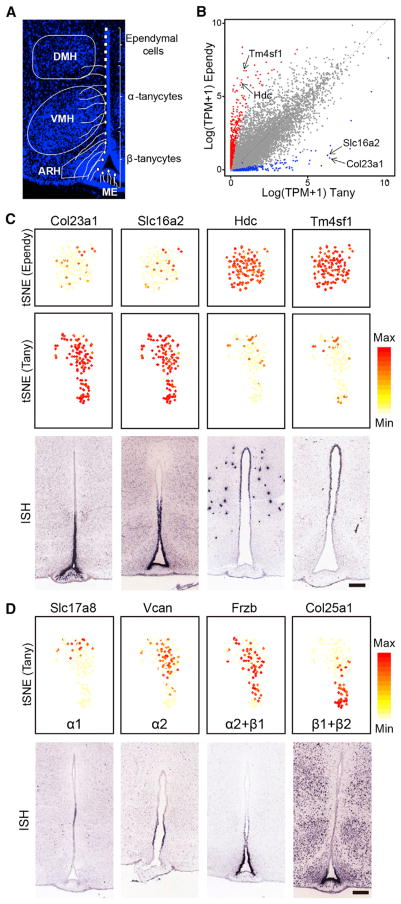
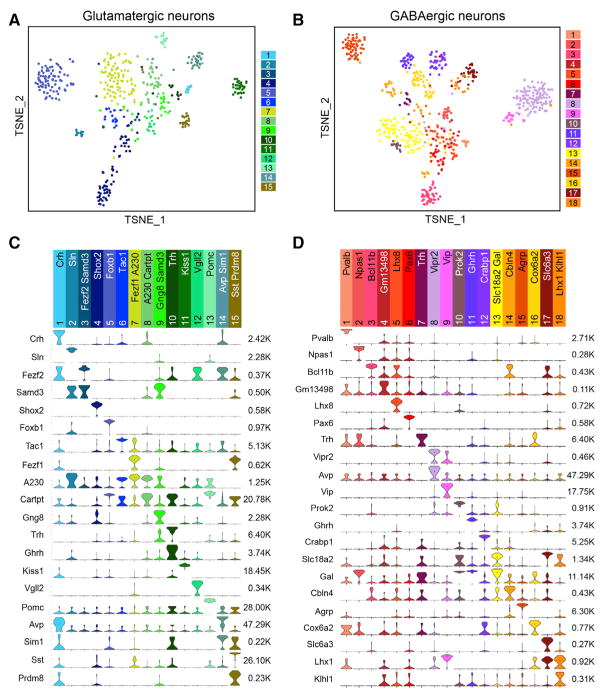
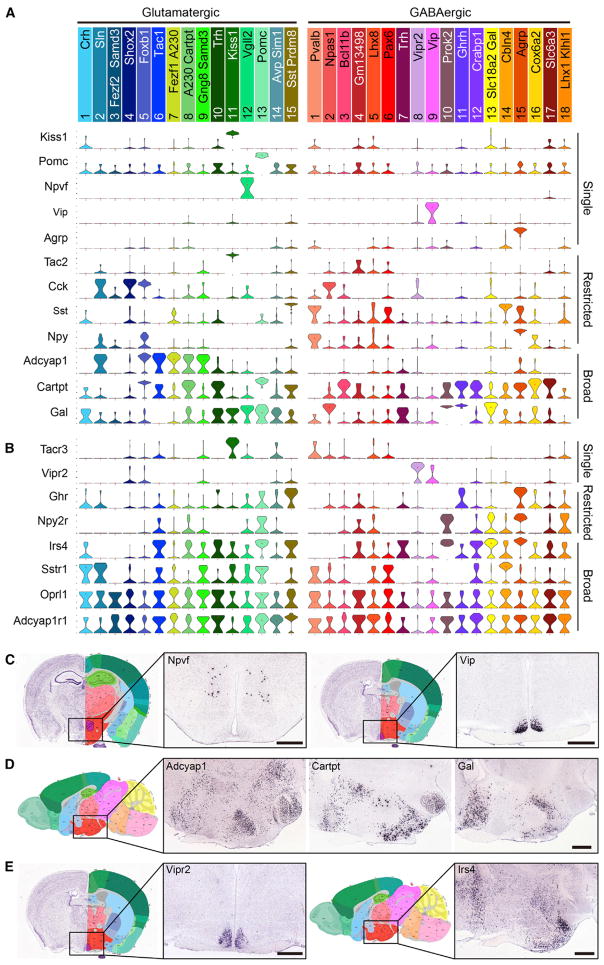
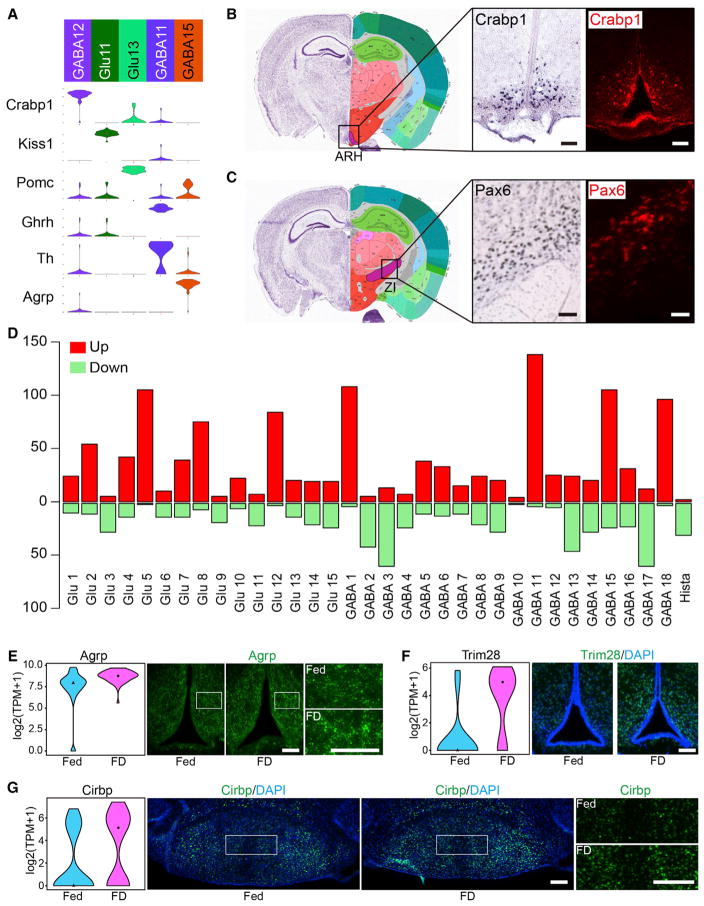
The hypothalamus is one of the most complex brain structures involved in homeostatic regulation. Defining cell composition and identifying cell-type-specific transcriptional features of the hypothalamus is essential for understanding its functions and related disorders. Here, we report single-cell RNA sequencing results of adult mouse hypothalamus, which defines 11 non-neuronal and 34 neuronal cell clusters with distinct transcriptional signatures. Analyses of cell-type-specific transcriptomes reveal gene expression dynamics underlying oligodendrocyte differentiation and tanycyte subtypes. Additionally, data analysis provides a comprehensive view of neuropeptide expression across hypothalamic neuronal subtypes and uncover Crabp1+ and Pax6+ neuronal populations in specific hypothalamic sub-regions. Furthermore, we found food deprivation exhibited differential transcriptional effects among the different neuronal subtypes, suggesting functional specification of various neuronal subtypes. Thus, the work provides a comprehensive transcriptional perspective of adult hypothalamus, which serves as a valuable resource for dissecting cell-type-specific functions of this complex brain region.

Keywords: cell heterogeneity; hypothalamus; neuron diversity; oligodendrocyte; single-cell RNA-seq; tanycyte.


Figures

Figure 1
Figure 1. Identification of 45 Cell Types in Adult Mouse Hypothalamus by scRNA-Seq
(A) Workflow of single-cell RNA-seq of mouse hypothalamus. Hypothalamic tissues were dissected from adult mouse brain and dissociated into single-cell suspension. Single cells and barcoded beads were captured into droplets followed by cDNA synthesis, amplification, and library preparation. After next generation sequencing, cells were classified based on their transcriptomes. (B) tSNE plot showing the overall gene expression relationship among the 3,319 single cells with more than 2,000 genes detected in each cell. Different cell clusters are color-coded. (C) Violin plot showing the expression of pan marker genes across the 45 cell clusters. Each cluster is color-coded. The mRNA level is shown on linear scale and adjusted for different genes. The maximum TPM value of each pan marker gene is presented on the right. Snap25 and Syt1, pan-neuronal markers; Slc17a6, pan-glutamatergic marker; Slc32a1, pan-GABAergic marker; Olig1, Sox9, Cldn5, and C1qa each marks multiple non-neuronal clusters. Glu1–Glu15, glutamatergic neuron cluster 1–15; GABA1–GABA18, GABAergic neuron cluster 1–18; Hista, histaminergic neuron; NN1–NN11, non-neuron cluster 1–11. (D) tSNE plots showing expression of pan marker genes in distinct cell clusters. The gene expression level is color-coded. See also Figure S1.
Figure 2
Figure 2. Overview of the 11 Non-neuronal Cell Clusters in Hypothalamus
(A) Violin plot showing the expression profile of representative marker genes in the 11 non-neuronal cell clusters. Different clusters are color-coded. The mRNA level is shown on a linear scale and adjusted for different genes. The maximum TPM value of each gene is presented on the right. POPC, proliferating oligodendrocyte progenitor cell; OPC, oligodendrocyte progenitor cell; NFO, newly formed oligodendrocytes; MO, myelinating oligodendrocyte; Astro, astrocyte; Ependy, ependymocyte; Tany, tanycyte; Endo, endothelial cell; Micro, microglia; Macro, macrophage. (B) tSNE plots showing the expression of representative marker genes are restricted to specific non-neuronal clusters among all of the cells. The expression level is color-coded. (C) In situ hybridization (ISH) data from Allen Brain Atlas showing the expression of non-neuronal subtype markers Pdgfra, Fyn, Mobp, Agt, and Cx3cr1 in hypothalamus. Left: the coronal sections of the entire hypothalamic region. Right: enlarged images of the regions in red squares. Scale bar, 100 μm. See also Figure S2.
Figure 3
Figure 3. Transcriptional Dynamics during Oligodendrocyte Maturation
(A) Unsupervised ordering of OPCs (blue), NFOs (green), and MOs (red) based on their gene expression profiles. Minimal spanning tree is shown in black. Arrows indicate the direction of differentiation. (B) Scatterplots showing the transcriptional dynamics of Pdgfra, Fyn, and Mog along the pseudotime. X axis represents the pseudotime axis, y axis shows gene expression level on log scale. Blue, green, and red dots represent OPCs, NFOs, and MOs, respectively. (C) Heatmap showing six groups of genes with distinct expression dynamics during oligodendrocyte maturation. Columns are individual cells organized along the pseudotime and rows represent individual genes. Twenty of the most representative genes from each group are plotted. Expression level is color-coded. (D) Scatterplots showing the transcriptional dynamics of representative genes belong to groups 1 to 6 in Figure 2C along the maturation of oligodendrocyte. (E) Scatterplots showing the expression of NFO-specific genes Bmp4, Grp17, Sirt2, and Dnmt3a along the pseudo-timeline. See also Figure S3.
Figure 4
Figure 4. Gene Expression Features of Tanycyte and Tanycyte Subtypes
(A) Schematic diagram showing the spatial distribution and morphology of tanycytes, which can be further divided into α and β subtypes. ARH, arcuate hypothalamic nucleus; VHM, ventromedial hypothalamic nucleus; DMH, dorsomedial hypothalamic nucleus; ME, median eminence. (B) Scatterplot comparing the expression profiles of tanycytes and ependymocytes. X axis and y axis represent the average expression level of certain genes among all tanycytes and all ependymal cells, respectively. Each dot represents a single gene, blue dots represent tanycyte-enriched genes and red dots represent ependymocyte-enriched genes. The tanycyte-specific genes Col23a1 and Slc16a2, as well as the ependymocyte-specific genes Hdc and Tm4sf1 are indicated by arrows. (C) Expression patterns of selected tanycyte- and ependymocyte-specific genes. tSNE plots (upper and middle panels) showing the selective expression of Col23a1 and Slc16a2 in tanycytes (Tany), Hdc and Tm4sf1 in ependymocytes (Ependy). Gene expression level is color-coded. ISH data (lower panels, from Allen Brain Atlas) show the distribution of corresponding genes along the 3V walls. Scale bar, 200 μm. (D) Potential tanycyte subtype markers identified by scRNA-seq. tSNE plots (upper panels) showing the expression of selected genes enriched in subsets of tanycytes. The genes are ordered according to their expression level along the vertical axis of the tSNE map. For each gene, potential tanycyte subtype(s) that express the marker gene are listed. Gene expression level is color-coded. ISH data (lower panels, from Allen Brain Atlas) indicate a dorsal-to-ventral distribution of corresponding genes along the 3V walls. Scale bar, 200 μm. See also Figure S4.
Figure 5
Figure 5. Glutamatergic and GABAergic Neuron Subtypes in Hypothalamus
(A) tSNE plot showing the 15 glutamatergic neuron subtypes identified in hypothalamus. Differentially expressed genes among all subtypes are used for dimension reduction. Different neuron subtypes are color-coded. (B) tSNE plot showing the 18 GABAergic neuron subtypes in hypothalamus. (C) Violin plots showing the expression of subtype markers across the 15 glutamatergic neuron subtypes. Columns represent different neuron clusters which are color-coded. Marker genes for each cluster are indicated. The gene expression level is shown on linear scale and adjusted for different genes. The maximum TPM value for each marker gene is presented on right. A230 is A230065H16Rik. (D) Violin plots showing the expression of subtype markers across the 18 GABAergic neuron subtypes. Columns represent different neuron clusters which are color-coded. See also Figure S5.
Figure 6
Figure 6. Divergent Expression Pattern of Neuropeptides and Receptors among the Hypothalamic Neuron Subtypes
(A) Violin plots showing the expression of selected neuropeptides among the neuron subtypes in hypothalamus. Gene expression level is presented on linear scale and adjusted for different genes. (B) Violin plots showing the expression of selected neuropeptide receptors among the neuron subtypes in hypothalamus. (C) Coronal sections showing that Npvf and Vip are selectively expressed in different hypothalamic regions. ISH data are from Allen Brain Atlas. The boxed regions in the left panels were enlarged and shown in right panels. (D) Sagittal sections showing the broad distribution of Adcyap1, Cartpt, and Gal in hypothalamus. (E) ISH showing that Vipr2 is selectively expressed in superchiasmatic nucleus while Irs4 is widely distributed in hypothalamus. Scale bars, 500 μm. See also Figure S6.
Figure 7
Figure 7. Neuron Types and Assessment of Food Deprivation-Induced Transcriptional Changes in Hypothalamus
(A) Violin plot showing the expression of selected genes in neuron subtypes located in ARH. Gene expression level is shown on linear scale and adjusted for different genes. (B) ISH and immunostaining on coronal hypothalamus sections showing that the Crabp1+ neurons are restricted in ARH. ISH data are from Allen Brain Atlas. Scale bars, 100 μm. (C) ISH and immunostaining showing presence of Pax6+ neurons in ZI. Scale bars, 100 μm. (D) Bar graphs showing the number of genes affected by food deprivation across hypothalamic neuron subtypes. Red and green bars represent up- and downregulated genes. See also Table S6. (E) Violin plots and immunostaining showing that Agrp is upregulated by food deprivation. Fed, n = 62; FD, n = 50. Fold change = 1.52, p = 0.00016. Fed, normal feeding; FD, food deprivation. Scale bars, 100 μm. (F) Violin plots and immunostaining showing that Trim28 is upregulated in ARH by food deprivation. Fed, n = 16; FD, n = 19. Fold change = 2.76, p = 0.00081. Scale bar, 100 μm. (G) Violin plot and immunostaining showing that Cirbp in MM neurons is upregulated by food deprivation. Fed, n = 103; FD, n = 97. Fold change = 1.97, p = 0.00099. Scale bars, 200 μm. See also Figure S7.

Similar articles

Cited by

References

    1. Bolborea M, Dale N. Hypothalamic tanycytes: potential roles in the control of feeding and energy balance. Trends Neurosci. 2013;36:91–100. - PMC - PubMed
    1. Brewer GJ, Torricelli JR. Isolation and culture of adult neurons and neurospheres. Nat Protoc. 2007;2:1490–1498. - PubMed
    1. Brown CH, Bains JS, Ludwig M, Stern JE. Physiological regulation of magnocellular neurosecretory cell activity: integration of intrinsic, local and afferent mechanisms. J Neuroendocrinol. 2013;25:678–710. - PMC - PubMed
    1. Chen Y, Wu H, Wang S, Koito H, Li J, Ye F, Hoang J, Escobar SS, Gow A, Arnett HA, et al. The oligodendrocyte-specific G protein-coupled receptor GPR17 is a cell-intrinsic timer of myelination. Nat Neurosci. 2009;12:1398–1406. - PMC - PubMed
    1. Denton DA, McKinley MJ, Weisinger RS. Hypothalamic integration of body fluid regulation. Proc Natl Acad Sci USA. 1996;93:7397–7404. - PMC - PubMed

Publication types

MeSH terms