

Distribution of Ki-67 values within HER2 & ER/PgR expression variants of ductal breast cancers as a potential link between IHC features and breast cancer biology
- PMID: 28356061
- PMCID: PMC5372302
- DOI: 10.1186/s12885-017-3212-x
Distribution of Ki-67 values within HER2 & ER/PgR expression variants of ductal breast cancers as a potential link between IHC features and breast cancer biology
Abstract
Background: Unexpected differences in Ki-67 values among HER2 & ER/PgR defined subgroups were found. This study aims to detect possible subdivisions beyond the conventional breast cancer types.
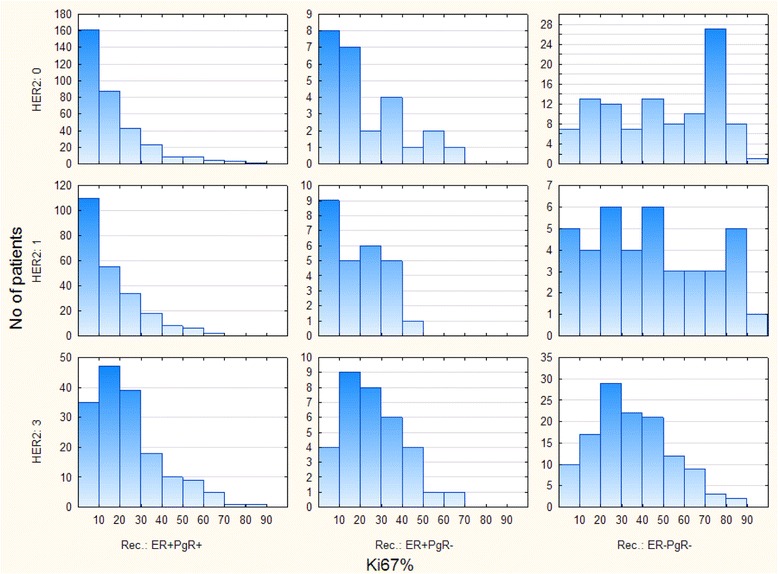
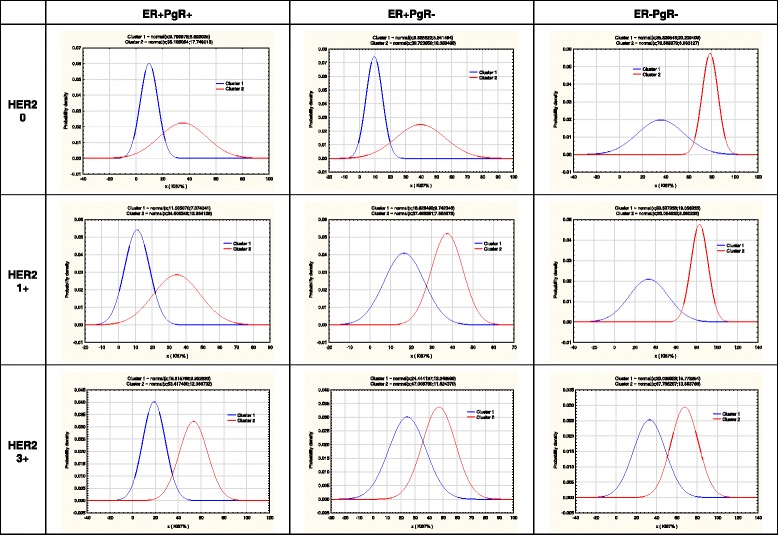
Methods: One thousand one hundred eighty consecutive patients with invasive ductal breast carcinoma were included and distributed in 16 subgroups (four HER2 phenotypes (0+, 1+, 2+ and 3+) times four ER/PgR phenotypes). Complex distributions of Ki-67 values were tested by expectation maximization (EM) clustering.
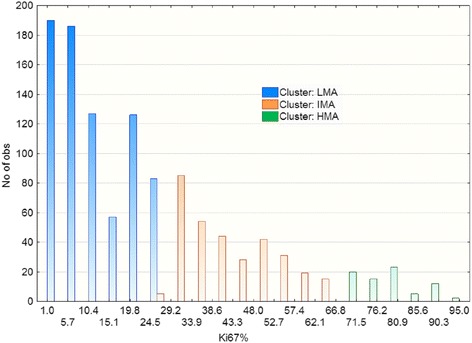
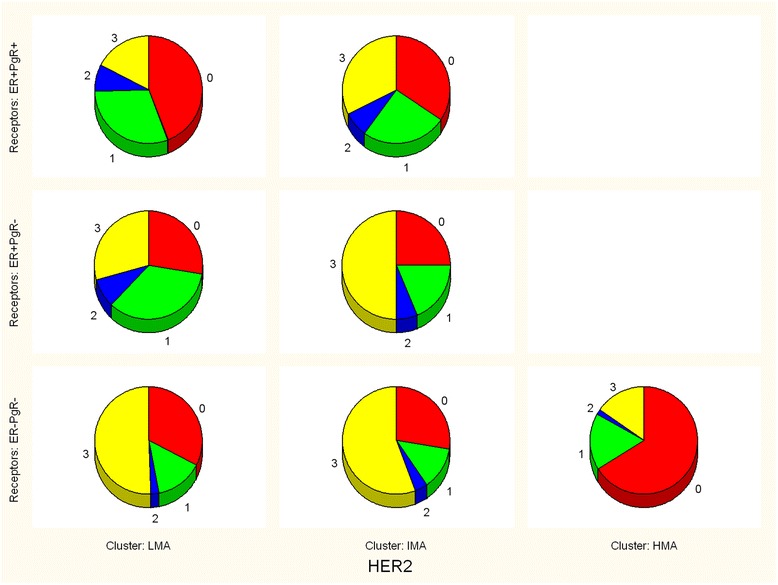
Results: Pooled Ki67 values of all patients showed the presence of three EM clusters (defined as LMA-low mitotic activity, IMA-intermediate mitotic activity and HMA-high mitotic activity) with expected mean Ki-67 values of 1.17%, 40.45% and 77.79%, respectively. Only ER-PgR- tumors significantly dispersed in three clusters (29.75% tumors in LMA, 46.95% in IMA and 23.30% in the HMA cluster), while almost no detected HMA tumors were of ER + PgR+ or ER + PgR- phenotypes. Among 799 ER + PgR+ patients distribution in clusters was HER2 dependent (p = 0.000243), due to increased number of IMA HER2 3+ tumors on the expense of LMA HER2 3+ tumors (52 IMA out of 162 HER2 3+ patients versus113 IMA out of 637 HER2 < 3+ patients). This was not found among ER + PgR- patients (p = 0.186968). Among ER-PgR- patients, HER2 overexpression also increased number of IMA tumor, but by reducing the number of HMA tumors (p < 0.000001). Here, difference between HER2 absent (0+) and HER2 3+ patients was evident (10 HMA out of 125 HER2 3+ patients versus 42 HMA out of 103 HER2 0+ patients).
Conclusions: Results suggest that distributions of breast cancers in three clusters of mitotic activity depend on different mechanisms for ER + PgR+ and ER negative tumors. Although HER2 overexpression increases number of IMA tumors in both settings, in the former it is done by reducing number of LMA tumors, while in the latter it reduces the number of HMA tumors. Mitotic activity of ER + PgR- tumors seems unrelated to the HER2 status, possibly as an indicator that ER dysfunctionality in cancers that lack PgR expression. Among ER negative tumors, the absence of HER2 (0+) might be as important as the HER2 overexpression.
Keywords: Breast cancer; Cancer phenotypes; Immunohistochemistry; Ki-67.
Figures
Similar articles
-
Power of PgR expression as a prognostic factor for ER-positive/HER2-negative breast cancer patients at intermediate risk classified by the Ki67 labeling index.BMC Cancer. 2017 May 22;17(1):354. doi: 10.1186/s12885-017-3331-4. BMC Cancer. 2017. PMID: 28532429 Free PMC article.
-
Apocrine carcinoma as triple-negative breast cancer: novel definition of apocrine-type carcinoma as estrogen/progesterone receptor-negative and androgen receptor-positive invasive ductal carcinoma.Jpn J Clin Oncol. 2012 May;42(5):375-86. doi: 10.1093/jjco/hys034. Epub 2012 Mar 26. Jpn J Clin Oncol. 2012. PMID: 22450930
-
Comparison of immunohistochemistry with PCR for assessment of ER, PR, and Ki-67 and prediction of pathological complete response in breast cancer.BMC Cancer. 2017 Feb 13;17(1):124. doi: 10.1186/s12885-017-3111-1. BMC Cancer. 2017. PMID: 28193205 Free PMC article.
-
Impact of molecular subtypes classification concordance between preoperative core needle biopsy and surgical specimen on early breast cancer management: Single-institution experience and review of published literature.Eur J Surg Oncol. 2017 Apr;43(4):642-648. doi: 10.1016/j.ejso.2016.10.025. Epub 2016 Nov 17. Eur J Surg Oncol. 2017. PMID: 27889196 Review.
-
Model of tumor-associated epigenetic changes of HER2, ER, and PgR expression in invasive breast cancer phenotypes.Tumour Biol. 2013 Aug;34(4):2011-7. doi: 10.1007/s13277-013-0809-9. Epub 2013 May 3. Tumour Biol. 2013. PMID: 23640060 Review.
Cited by
-
TICRR Contributes to Tumorigenesis Through Accelerating DNA Replication in Cancers.Front Oncol. 2019 Jun 18;9:516. doi: 10.3389/fonc.2019.00516. eCollection 2019. Front Oncol. 2019. PMID: 31275851 Free PMC article.
-
Nomograms for Predicting Disease-Free Survival Based on Core Needle Biopsy and Surgical Specimens in Female Breast Cancer Patients with Non-Pathological Complete Response to Neoadjuvant Chemotherapy.J Pers Med. 2023 Jan 29;13(2):249. doi: 10.3390/jpm13020249. J Pers Med. 2023. PMID: 36836483 Free PMC article.
-
Preclinical and Clinical Observations Implying Combination Therapy to Enhance the Efficacy of the Her-2/neu B-Cell Peptide-Based Vaccine HER-Vaxx and to Prevent Immune Evasion.Int J Mol Sci. 2023 Dec 24;25(1):287. doi: 10.3390/ijms25010287. Int J Mol Sci. 2023. PMID: 38203458 Free PMC article.
-
BCL-2 expression aids in the immunohistochemical prediction of the Oncotype DX breast cancer recurrence score.BMC Clin Pathol. 2018 Dec 18;18:14. doi: 10.1186/s12907-018-0082-3. eCollection 2018. BMC Clin Pathol. 2018. PMID: 30574014 Free PMC article.
-
A Preliminary Analysis of Ki-67 Expression in Breast Cancer in the Caribbean.Cureus. 2023 Apr 30;15(4):e38351. doi: 10.7759/cureus.38351. eCollection 2023 Apr. Cureus. 2023. PMID: 37266061 Free PMC article.
References
-
- Yamamoto-Ibusuki M, Yamamoto Y, Yamamoto S, Fujiwara S, Fu P, Honda Y, Iyama K, Iwase H. Comparison of prognostic values between combined immunohistochemical score of estrogen receptor, progesterone receptor, human epidermal growth factor receptor 2, Ki-67 and the corresponding gene expression score in breast cancer. Mod Pathol. 2013;26(1):79–86. doi: 10.1038/modpathol.2012.151. - DOI - PubMed
-
- Inwald EC, Koller M, Klinkhammer-Schalke M, Zeman F, Hofstädter F, Gerstenhauer M, Brockhoff G, Ortmann O. 4-IHC classification of breast cancer subtypes in a large cohort of a clinical cancer registry: use in clinical routine for therapeutic decisions and its effect on survival. Breast Cancer Res Treat. 2015;153(3):647–658. doi: 10.1007/s10549-015-3572-3. - DOI - PMC - PubMed
Publication types
MeSH terms
Substances
LinkOut - more resources
Full Text Sources
Other Literature Sources
Medical
Research Materials
Miscellaneous
