

Genome-wide association study and accuracy of genomic prediction for teat number in Duroc pigs using genotyping-by-sequencing
- PMID: 28356075
- PMCID: PMC5371258
- DOI: 10.1186/s12711-017-0311-8
Genome-wide association study and accuracy of genomic prediction for teat number in Duroc pigs using genotyping-by-sequencing
Abstract
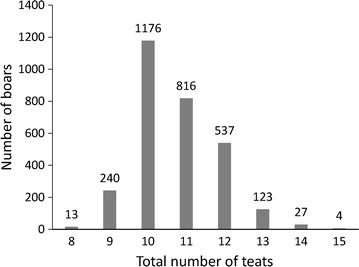
Background: The number of teats in pigs is related to a sow's ability to rear piglets to weaning age. Several studies have identified genes and genomic regions that affect teat number in swine but few common results were reported. The objective of this study was to identify genetic factors that affect teat number in pigs, evaluate the accuracy of genomic prediction, and evaluate the contribution of significant genes and genomic regions to genomic broad-sense heritability and prediction accuracy using 41,108 autosomal single nucleotide polymorphisms (SNPs) from genotyping-by-sequencing on 2936 Duroc boars.
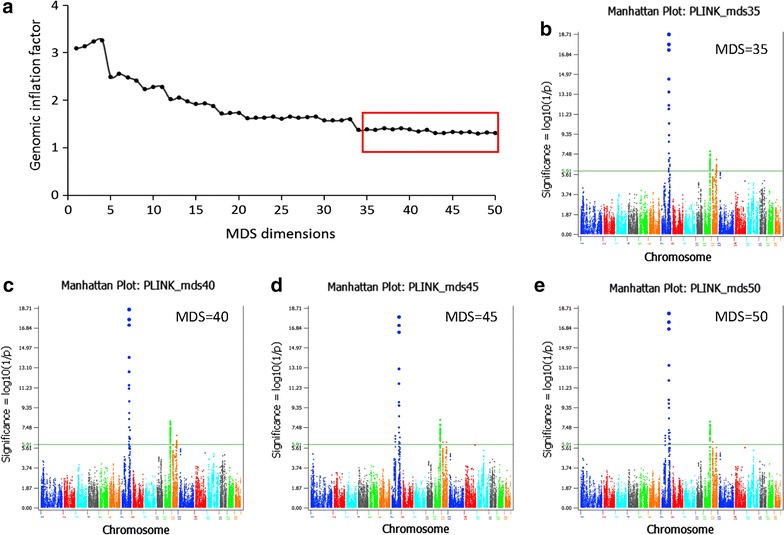
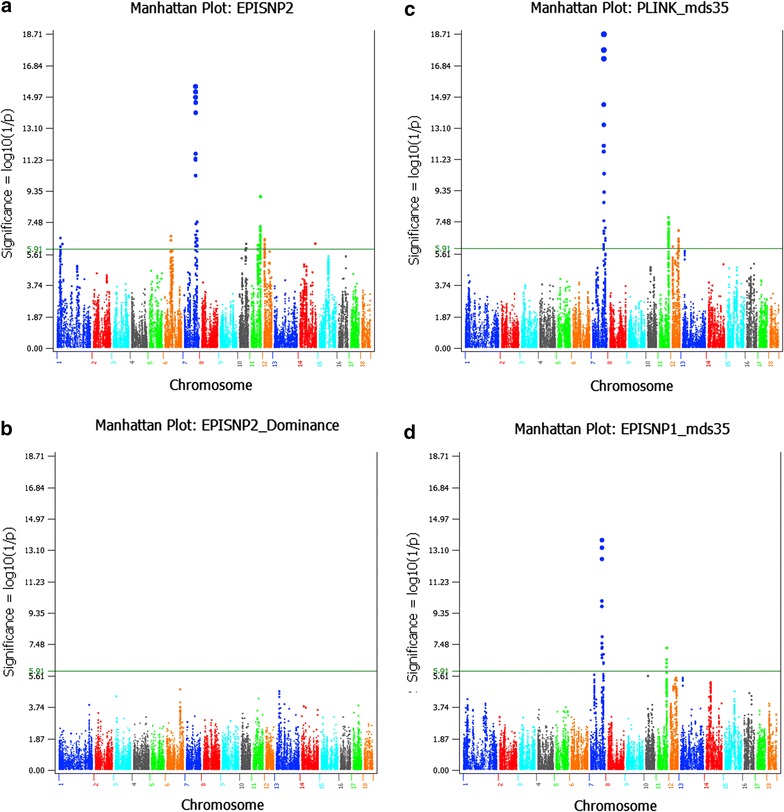
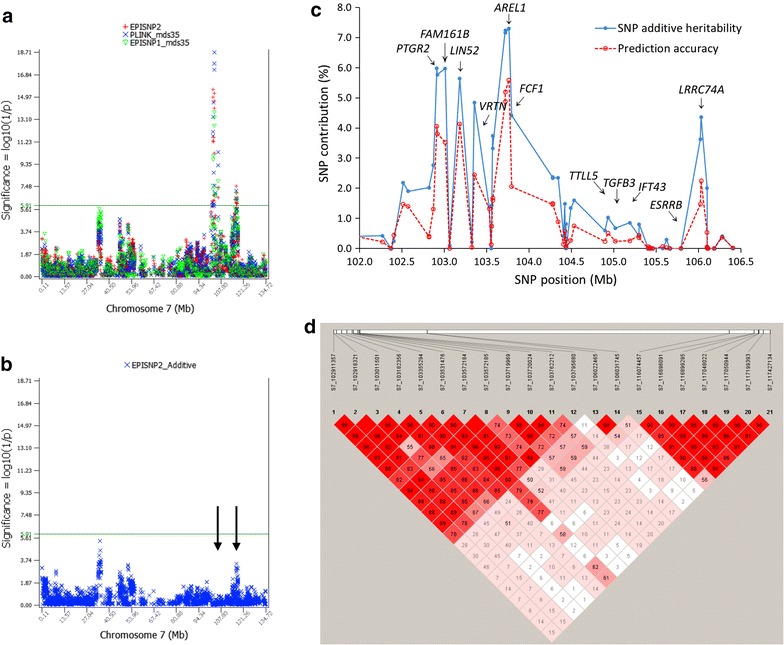
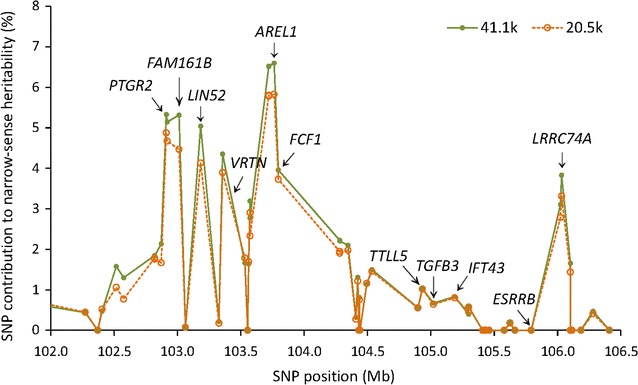
Results: Narrow-sense heritability and dominance heritability of teat number estimated by genomic restricted maximum likelihood were 0.365 ± 0.030 and 0.035 ± 0.019, respectively. The accuracy of genomic predictions, calculated as the average correlation between the genomic best linear unbiased prediction and phenotype in a tenfold validation study, was 0.437 ± 0.064 for the model with additive and dominance effects and 0.435 ± 0.064 for the model with additive effects only. Genome-wide association studies (GWAS) using three methods of analysis identified 85 significant SNP effects for teat number on chromosomes 1, 6, 7, 10, 11, 12 and 14. The region between 102.9 and 106.0 Mb on chromosome 7, which was reported in several studies, had the most significant SNP effects in or near the PTGR2, FAM161B, LIN52, VRTN, FCF1, AREL1 and LRRC74A genes. This region accounted for 10.0% of the genomic additive heritability and 8.0% of the accuracy of prediction. The second most significant chromosome region not reported by previous GWAS was the region between 77.7 and 79.7 Mb on chromosome 11, where SNPs in the FGF14 gene had the most significant effect and accounted for 5.1% of the genomic additive heritability and 5.2% of the accuracy of prediction. The 85 significant SNPs accounted for 28.5 to 28.8% of the genomic additive heritability and 35.8 to 36.8% of the accuracy of prediction.
Conclusions: The three methods used for the GWAS identified 85 significant SNPs with additive effects on teat number, including SNPs in a previously reported chromosomal region and SNPs in novel chromosomal regions. Most significant SNPs with larger estimated effects also had larger contributions to the total genomic heritability and accuracy of prediction than other SNPs.
Figures
Similar articles
-
Genome-wide association analyses identify known and novel loci for teat number in Duroc pigs using single-locus and multi-locus models.BMC Genomics. 2020 May 7;21(1):344. doi: 10.1186/s12864-020-6742-6. BMC Genomics. 2020. PMID: 32380955 Free PMC article.
-
Genome-wide association study and genomic predictions for exterior traits in Yorkshire pigs1.J Anim Sci. 2019 Jul 2;97(7):2793-2802. doi: 10.1093/jas/skz158. J Anim Sci. 2019. PMID: 31087081 Free PMC article.
-
Haplotype genomic prediction of phenotypic values based on chromosome distance and gene boundaries using low-coverage sequencing in Duroc pigs.Genet Sel Evol. 2021 Oct 7;53(1):78. doi: 10.1186/s12711-021-00661-y. Genet Sel Evol. 2021. PMID: 34620094 Free PMC article.
-
[Physiology and genetics research progress of teat traits in pigs].Yi Chuan. 2019 May 20;41(5):384-390. doi: 10.16288/j.yczz.18-336. Yi Chuan. 2019. PMID: 31106774 Review. Chinese.
-
A review of SNP heritability estimation methods.Brief Bioinform. 2022 May 13;23(3):bbac067. doi: 10.1093/bib/bbac067. Brief Bioinform. 2022. PMID: 35289357 Review.
Cited by
-
Accuracy of genomic prediction of maternal traits in pigs using Bayesian variable selection methods.J Anim Breed Genet. 2022 Nov;139(6):654-665. doi: 10.1111/jbg.12729. Epub 2022 Jun 27. J Anim Breed Genet. 2022. PMID: 35758628 Free PMC article.
-
Fine Mapping Identifies Candidate Genes Associated with Swine Inflammation and Necrosis Syndrome.Vet Sci. 2025 May 21;12(5):508. doi: 10.3390/vetsci12050508. Vet Sci. 2025. PMID: 40431601 Free PMC article.
-
Genetic Structure and Genome-Wide Association Analysis of Growth and Reproductive Traits in Fengjing Pigs.Animals (Basel). 2024 Aug 23;14(17):2449. doi: 10.3390/ani14172449. Animals (Basel). 2024. PMID: 39272234 Free PMC article.
-
Genome-Wide Association Study for Reproductive Traits in a Duroc Pig Population.Animals (Basel). 2019 Sep 26;9(10):732. doi: 10.3390/ani9100732. Animals (Basel). 2019. PMID: 31561612 Free PMC article.
-
Genome‑wide association study and genomic prediction for growth traits in yellow-plumage chicken using genotyping-by-sequencing.Genet Sel Evol. 2021 Oct 27;53(1):82. doi: 10.1186/s12711-021-00672-9. Genet Sel Evol. 2021. PMID: 34706641 Free PMC article.
References
Publication types
MeSH terms
LinkOut - more resources
Full Text Sources
Other Literature Sources
Miscellaneous
