Multicenter Study
. 2017 Mar 29;19(1):44.
doi: 10.1186/s13058-017-0812-y.

Integrative clustering reveals a novel split in the luminal A subtype of breast cancer with impact on outcome

Collaborators, Affiliations
Multicenter Study

Integrative clustering reveals a novel split in the luminal A subtype of breast cancer with impact on outcome

Miriam Ragle Aure et al. Breast Cancer Res. .

Abstract

Background: Breast cancer is a heterogeneous disease at the clinical and molecular level. In this study we integrate classifications extracted from five different molecular levels in order to identify integrated subtypes.

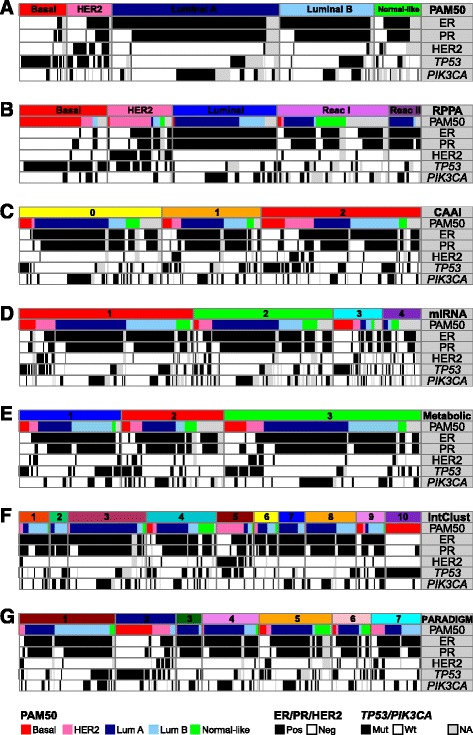
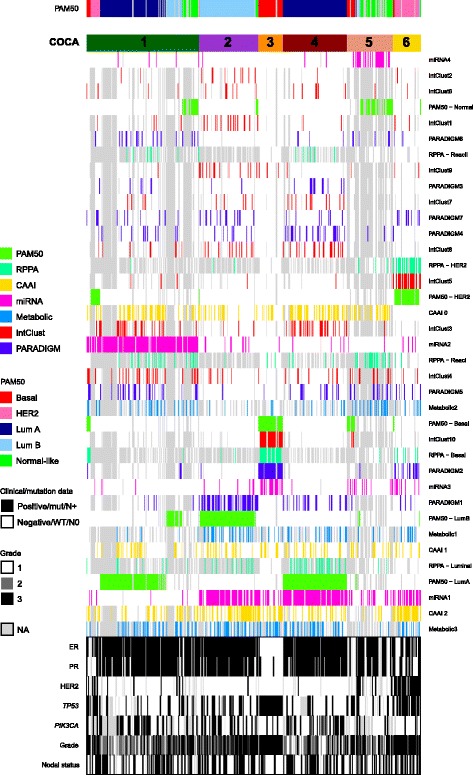
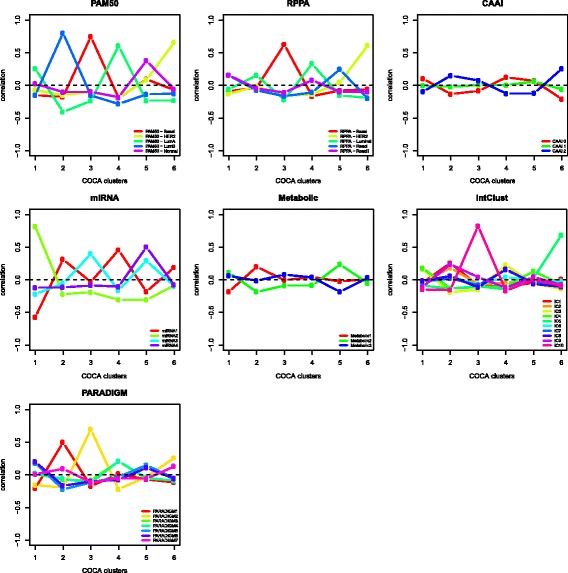
Methods: Tumor tissue from 425 patients with primary breast cancer from the Oslo2 study was cut and blended, and divided into fractions for DNA, RNA and protein isolation and metabolomics, allowing the acquisition of representative and comparable molecular data. Patients were stratified into groups based on their tumor characteristics from five different molecular levels, using various clustering methods. Finally, all previously identified and newly determined subgroups were combined in a multilevel classification using a "cluster-of-clusters" approach with consensus clustering.

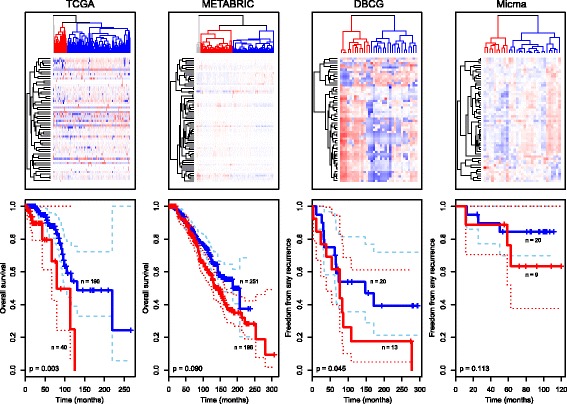
Results: Based on DNA copy number data, tumors were categorized into three groups according to the complex arm aberration index. mRNA expression profiles divided tumors into five molecular subgroups according to PAM50 subtyping, and clustering based on microRNA expression revealed four subgroups. Reverse-phase protein array data divided tumors into five subgroups. Hierarchical clustering of tumor metabolic profiles revealed three clusters. Combining DNA copy number and mRNA expression classified tumors into seven clusters based on pathway activity levels, and tumors were classified into ten subtypes using integrative clustering. The final consensus clustering that incorporated all aforementioned subtypes revealed six major groups. Five corresponded well with the mRNA subtypes, while a sixth group resulted from a split of the luminal A subtype; these tumors belonged to distinct microRNA clusters. Gain-of-function studies using MCF-7 cells showed that microRNAs differentially expressed between the luminal A clusters were important for cancer cell survival. These microRNAs were used to validate the split in luminal A tumors in four independent breast cancer cohorts. In two cohorts the microRNAs divided tumors into subgroups with significantly different outcomes, and in another a trend was observed.

Conclusions: The six integrated subtypes identified confirm the heterogeneity of breast cancer and show that finer subdivisions of subtypes are evident. Increasing knowledge of the heterogeneity of the luminal A subtype may add pivotal information to guide therapeutic choices, evidently bringing us closer to improved treatment for this largest subgroup of breast cancer.

Keywords: Breast cancer; Consensus clustering; Integration; Luminal A; MicroRNA.


Figures

Fig. 1
Fig. 1
The seven input levels for integrative clustering and association with clinical/molecular classifications. Original subtypes/clusters of each input level and corresponding PAM50 gene expression subtype, estrogen receptor (ER), progesterone receptor (PR) and epidermal growth factor receptor 2 (HER2) status, and TP53 and PIK3CA mutation status of the tumor samples. The tumor samples are sorted in the following order: molecular level, PAM50 gene expression subtype, ER, PR, HER2, TP53 and PIK3CA status. a PAM50 gene expression subtypes (n = 377). b Reverse-phase protein array (RPPA) subtypes (n = 173). c Complex arm aberration index (CAAI) subtypes (n = 349). 0 no CAAI events, 1 one CAAI event, 2 at least two CAAI events. d miRNA clusters (n = 423). e Metabolic clusters (n = 233). f Integrated clusters (IntClust; n = 291). g Pathway recognition algorithm using data integration on genomic models (PARADIGM) clusters (n = 312). Lum luminal, Pos positive, Neg negative, Mut mutant, Wt wild-type, NA not applicable
Fig. 2
Fig. 2
Cluster-of-clusters analysis (COCA) identifies six major groups based on seven molecular input levels. Consensus clustering was used to cluster 419 primary breast cancers in the Oslo2 study. The six resulting COCA clusters are numbered and the corresponding PAM50 subtype indicated (top). Heatmap representation of the subtypes/clusters independently defined: PAM50 mRNA subtypes, reverse-phase protein array (RPPA) expression subtypes, complex arm aberration index (CAAI) subtypes based on copy numbers, miRNA clusters, metabolic clusters, pathway recognition algorithm using data integration on genomic models (PARADIGM) clusters and integrated clusters (IntClust). Colored bar indicates membership of a subtype/cluster type, white indicates no membership to a given subtype and gray represents data not available (NA). The rows in the heatmap are ordered according to clustering. Clinical annotation of the tumors is shown (bottom). HER2 human epidermal growth factor receptor 2, Lum luminal, Mut mutant, WT wild-type
Fig. 3
Fig. 3
Correlation between cluster-of-clusters analysis (COCA) clusters and molecular input levels. Pearson correlation coefficient (y-axis) calculated between each molecular subtype level and each COCA cluster (x-axis) by coding membership to a cluster as 1 and 0 otherwise. Each panel represents one molecular input level to the COCA analysis. RPPA reverse-phase protein array, CAAI complex arm aberration index, PARADIGM pathway recognition algorithm using data integration on genomic models, IntClust integrated clusters, HER2 human epidermal growth factor receptor 2, Lum luminal
Fig. 4
Fig. 4
miRNA expression separates luminal A tumors into clusters with different outcomes. Top panel Luminal A tumors in The Cancer Genome Atlas (TCGA), Molecular Taxonomy of Breast Cancer International Consortium (METABRIC), Danish Breast Cancer Cooperative Group (DBCG) and the Oslo Micrometastasis cohort (Micma) breast cancer cohorts were clustered based on the expression of selected miRNAs using Pearson correlation and complete linkage (patients in columns and miRNAs in rows). Bottom panel Kaplan-Meier survival curves for the red and blue clusters in the top panel. The p-values are from log-rank tests (METABRIC p-value was adjusted for hospital site and DBCG p-value was adjusted for radiation therapy and lymph node status). Dashed lines indicate confidence intervals for the survival curves

Similar articles

Cited by

References

    1. Perou CM, Sorlie T, Eisen MB, van de Rijn M, Jeffrey SS, Rees CA, Pollack JR, Ross DT, Johnsen H, Akslen LA, et al. Molecular portraits of human breast tumours. Nature. 2000;406(6797):747–52. doi: 10.1038/35021093. - DOI - PubMed
    1. Sørlie T, Perou CM, Tibshirani R, Aas T, Geisler S, Johnsen H, Hastie T, Eisen MB, van de Rijn M, Jeffrey SS, et al. Gene expression patterns of breast carcinomas distinguish tumor subclasses with clinical implications. Proc Natl Acad Sci. 2001;98(19):10869–74. doi: 10.1073/pnas.191367098. - DOI - PMC - PubMed
    1. Curtis C, Shah SP, Chin S-F, Turashvili G, Rueda OM, Dunning MJ, Speed D, Lynch AG, Samarajiwa S, Yuan Y, et al. The genomic and transcriptomic architecture of 2,000 breast tumours reveals novel subgroups. Nature. 2012;486(7403):346–52. - PMC - PubMed
    1. Pereira B, Chin S-F, Rueda OM, Vollan H-KM, Provenzano E, Bardwell HA, Pugh M, Jones L, Russell R, Sammut S-J, et al. The somatic mutation profiles of 2,433 breast cancers refine their genomic and transcriptomic landscapes. Nat Commun. 2016;7:11479. - PMC - PubMed
    1. Kristensen VN, Vaske CJ, Ursini-Siegel J, Van Loo P, Nordgard SH, Sachidanandam R, Sørlie T, Wärnberg F, Haakensen VD, Helland Å, et al. Integrated molecular profiles of invasive breast tumors and ductal carcinoma in situ (DCIS) reveal differential vascular and interleukin signaling. Proc Natl Acad Sci. 2012;109(8):2802–7. doi: 10.1073/pnas.1108781108. - DOI - PMC - PubMed

Publication types