. 2017 May 5:273:55-68.
doi: 10.1016/j.toxlet.2017.03.024. Epub 2017 Mar 27.

Hepatic effects of tartrazine (E 102) after systemic exposure are independent of oestrogen receptor interactions in the mouse

Affiliations

Hepatic effects of tartrazine (E 102) after systemic exposure are independent of oestrogen receptor interactions in the mouse

Stephanie K Meyer et al. Toxicol Lett. .

Abstract

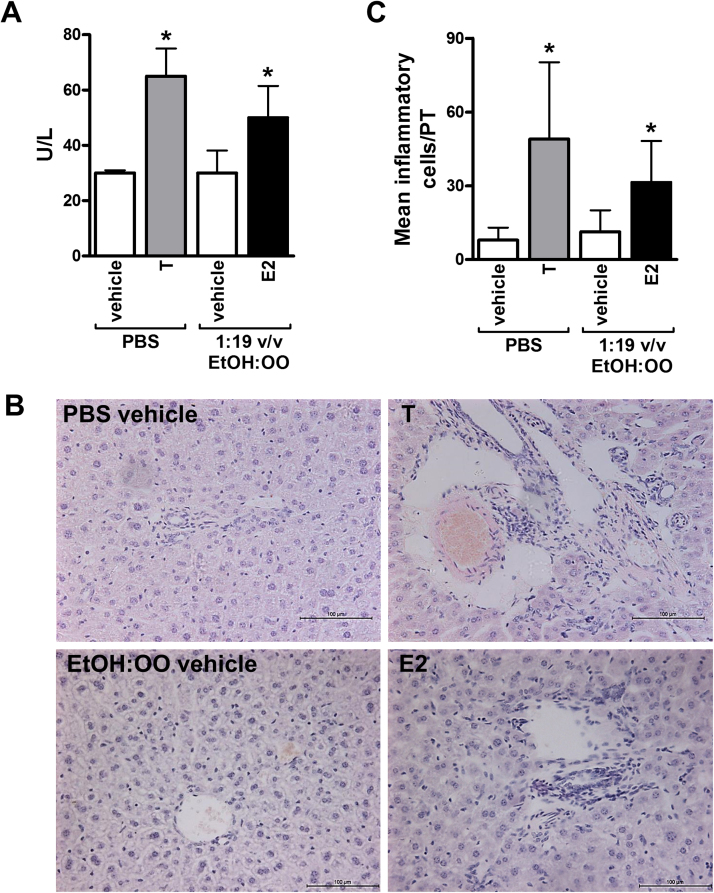
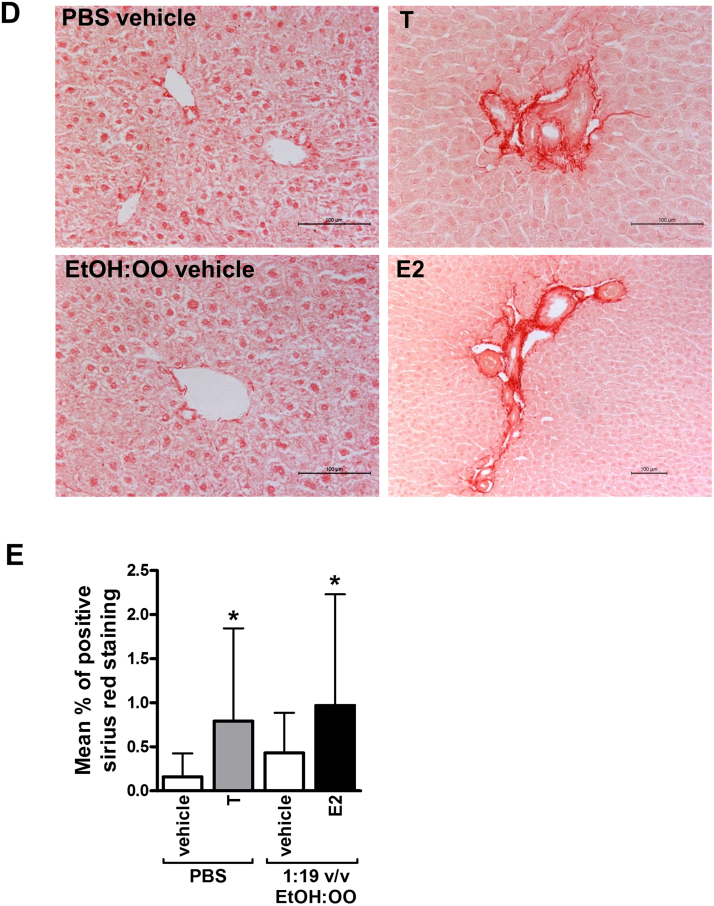
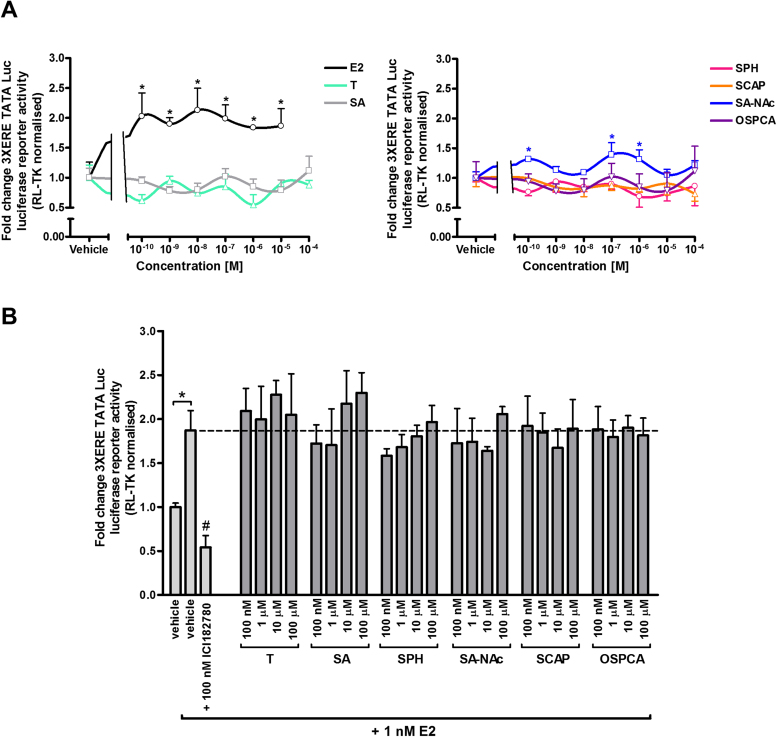
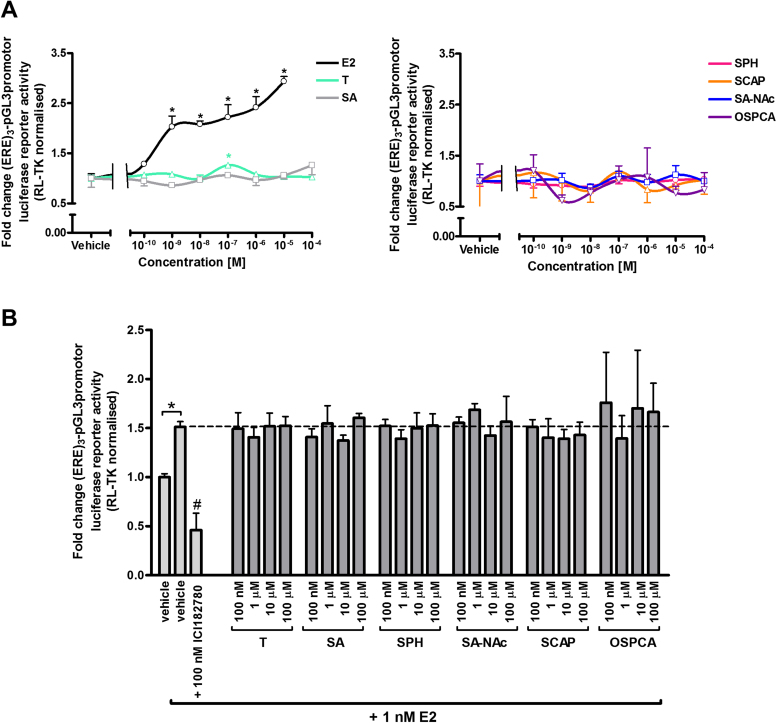
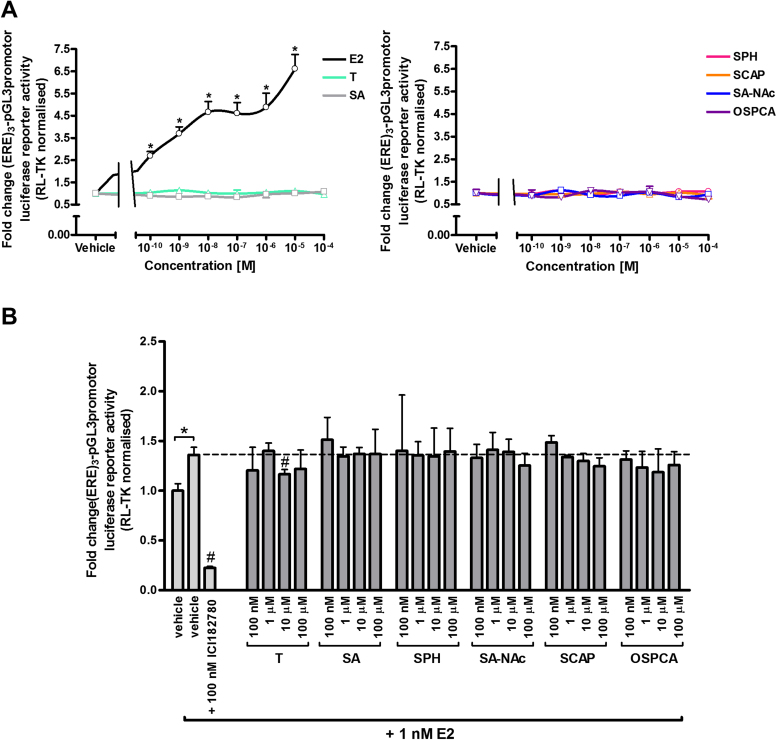
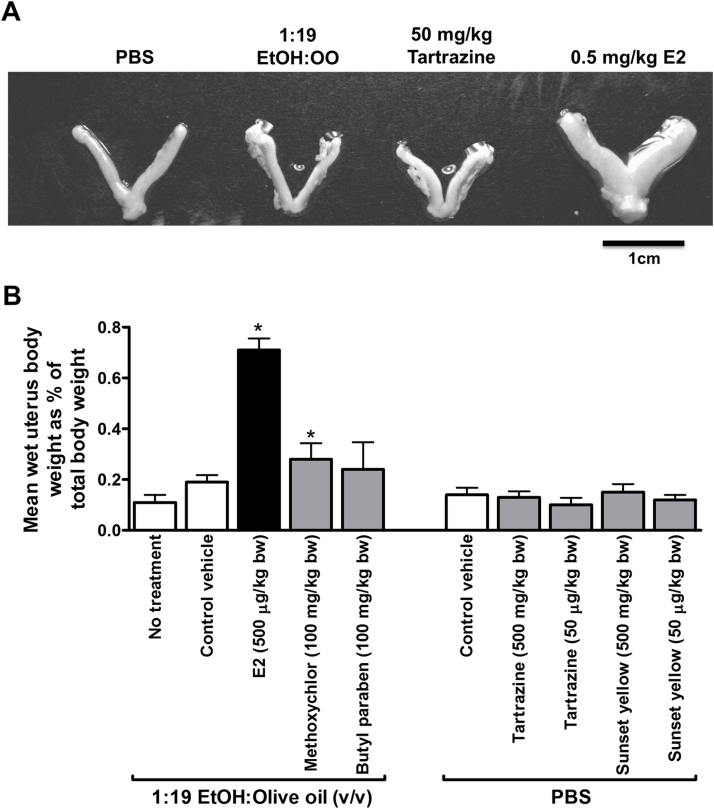
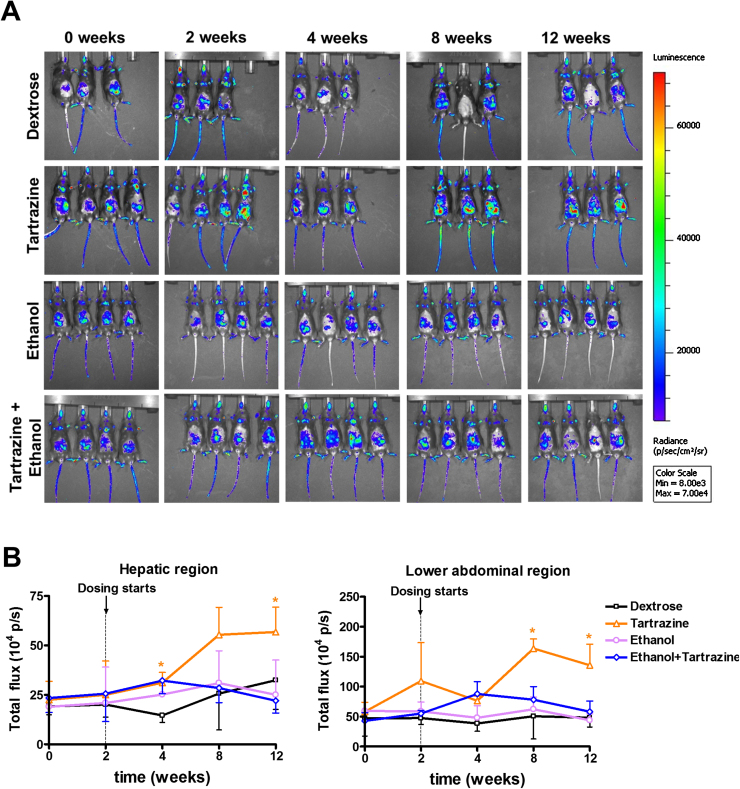
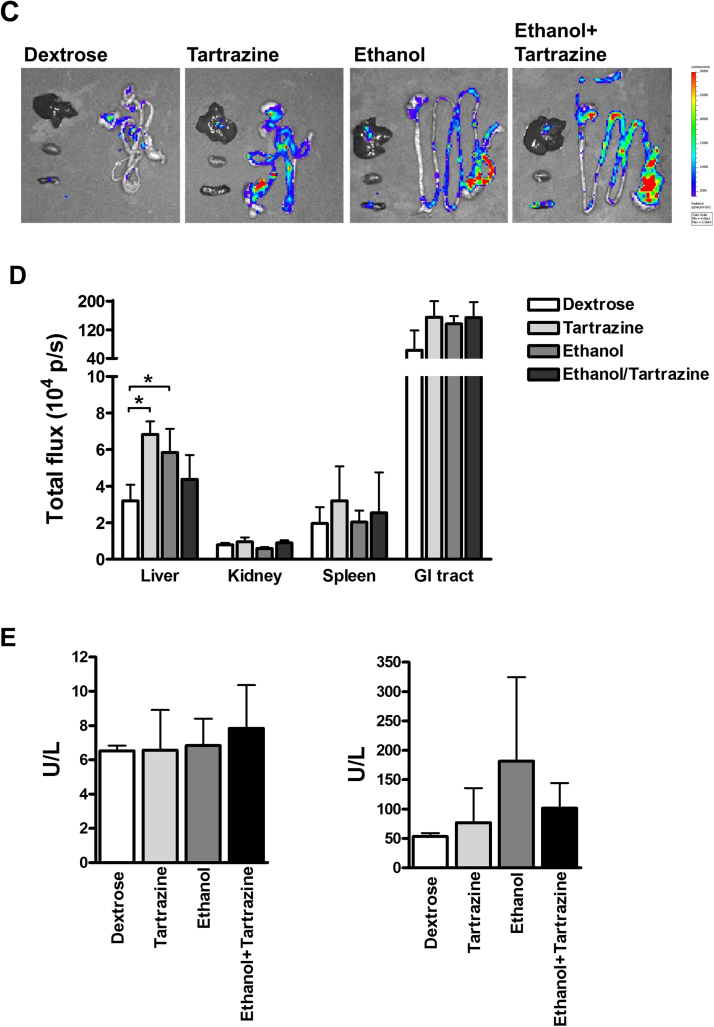
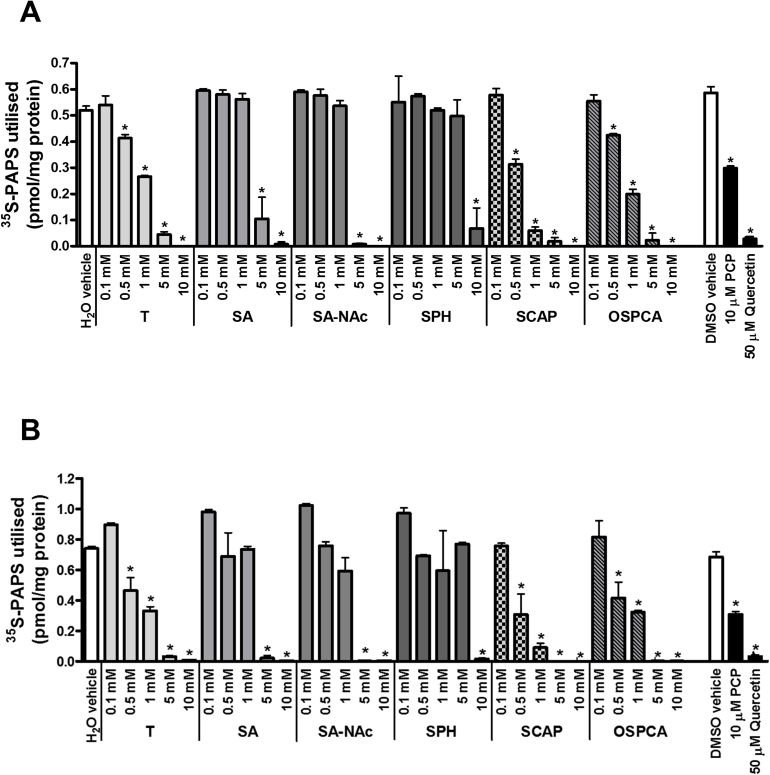
Tartrazine is a food colour that activates the transcriptional function of the human oestrogen receptor alpha in an in vitro cell model. Since oestrogens are cholestatic, we hypothesised tartrazine will cause periportal injury to the liver in vivo. To test this hypothesis, tartrazine was initially administered systemically to mice resulting in a periportal recruitment of inflammatory cells, increased serum alkaline phosphatase activity and mild periportal fibrosis. To determine whether an oestrogenic effect may be a key event in this response, tartrazine, sulphonated metabolites and a food additive contaminant were screened for their ability to interact with murine oestrogen receptors. In all cases, there were no interactions as agonists or antagonists and further, no oestrogenicity was observed with tartrazine in an in vivo uterine growth assay. To examine the relevance of the hepatic effects of tartrazine to its use as a food additive, tartrazine was orally administered to transgenic NF-κB-Luc mice. Pre- and concurrent oral treatment with alcohol was incorporated given its potential to promote gut permeability and hepatic inflammation. Tartrazine alone induced NF- κB activities in the colon and liver but there was no periportal recruitment of inflammatory cells or fibrosis. Tartrazine, its sulphonated metabolites and the contaminant inhibited sulphotransferase activities in murine hepatic S9 extracts. Given the role of sulfotransferases in bile acid excretion, the initiating event giving rise to periportal inflammation and subsequent hepatic pathology through systemic tartrazine exposure is therefore potentially associated an inhibition of bile acid sulphation and excretion and not on oestrogen receptor-mediated transcriptional function. However, these effects were restricted to systemic exposures to tartrazine and did not occur to any significant effect after oral exposure.

Keywords: Alcohol; E 102; Food; Liver; NF-κB; oestrogen.


Figures

Fig. 1
Fig. 1
Systemic exposure to tartrazine results in a periportal inflammatory cell recruitment in mice. Adult male C57Bl/6 mice were administered either tartrazine (T, 4 animals), E2 (4 animals) or relevant vehicle control (PBS for tratrazine, 3 animals; 1:19 ethanol:olive oil (v/v) for E2, 4 animals) by 10 daily intraperitoneal injections over 14 days. A, serum ALP, *significantly different activity versus vehicle control using the Student’s t-test (two tailed), p > 0.95. B, H&E-stained liver sections from animals treated as indicated, typical views chosen. C, quantification of portal tract inflammatory cells, *significantly different number of portal tract cells versus vehicle control using the Student’s t-test (two tailed), p > 0.95 based on at least 10 randomly selected portal tracts per animal. D, sirius red-stained liver sections from animals treated as indicated, typical views chosen. E, quantification of sirius red positive stained area, *significantly different activity versus vehicle control using the Student’s t-test (two tailed), p > 0.95.
Fig. 1
Fig. 1
Systemic exposure to tartrazine results in a periportal inflammatory cell recruitment in mice. Adult male C57Bl/6 mice were administered either tartrazine (T, 4 animals), E2 (4 animals) or relevant vehicle control (PBS for tratrazine, 3 animals; 1:19 ethanol:olive oil (v/v) for E2, 4 animals) by 10 daily intraperitoneal injections over 14 days. A, serum ALP, *significantly different activity versus vehicle control using the Student’s t-test (two tailed), p > 0.95. B, H&E-stained liver sections from animals treated as indicated, typical views chosen. C, quantification of portal tract inflammatory cells, *significantly different number of portal tract cells versus vehicle control using the Student’s t-test (two tailed), p > 0.95 based on at least 10 randomly selected portal tracts per animal. D, sirius red-stained liver sections from animals treated as indicated, typical views chosen. E, quantification of sirius red positive stained area, *significantly different activity versus vehicle control using the Student’s t-test (two tailed), p > 0.95.
Fig. 2
Fig. 2
Tartrazine, its sulphonated metabolites or major sulphonated contaminant are neither agonists nor antagonists of the mouse ERα. Luciferase reporter gene (3XERE TATA Luc) assay in LTPA cells co-transfected with a pcDNA3.1 expression construct encoding the mERα. A, cells were treated with E2, tartrazine (T) or its sulphonated metabolites (SA, sulphanilic acid; SA-NAc, sulphanilic acid N-acetate; SCAP, 1-(4-sulphophenyl)-3-carboxy-4-amino-5-pyrazolone; SPH, sulphophenylhydrazine) or major sulphonated contaminant 5-oxo-1-(4-sulphophenyl)-2-pyrazoline-3-carboxylic acid (OSPCA); at the indicated concentrations for 24 h. Data are the mean and standard deviation luciferase activity from 3 separate determinations from the same experiment, typical of at least 3 separate experiments. Data are expressed as fold change versus vehicle-treated cells (vehicle: 0.1% v/v DMSO for E2 and tartrazine or 0.1% (v/v) PBS for SA, SPH, SCAP, SA-NAc and OSPCA). *Significant increase (p > 0.95) over vehicle treated cells using one-way ANOVA with Dunnett’s post-hoc test. B, cells were pre-treated with 100 nM ICI182780 for 6 h followed by treatment with ICI182780, tartrazine or metabolites in the presence of 1 nM E2 for 24 h. Data are the mean and standard deviation luciferase activity from 3 separate determinations from the same experiment, typical of at least 3 separate experiments and expressed in fold change versus vehicle-treated cells (vehicle: 0.1% v/v DMSO for E2 and tartrazine or 0.1% v/v PBS for SA, SPH, SCAP, SA-NAc and OSPCA). *Significant increase (p > 0.95) over cells treated with vehicle only using Student’s T-test (two-tailed). #Significant decrease (p > 0.95) over cells treated with 1 nM E2 in the absence of ICI182780 using One-way ANOVA with Dunnett’s post-hoc test.
Fig. 3
Fig. 3
Tartrazine, its sulphonated metabolites or major sulphonated contaminant are neither agonists nor antagonists of the mouse ERβ variant 1. Luciferase reporter gene ((ERE)3-pGL3promotor) assay in 603B cells co-transfected with a pcDNA3.1 expression construct encoding the mouse ERβ variant 1. A, cells were treated with E2, tartrazine or its sulphonated metabolites or major sulphonated contaminant at the indicated concentrations for 24 h. Data are the mean and standard deviation luciferase activity from 3 separate determinations from the same experiment, typical of at least 3 separate experiments. Data are expressed in fold change versus vehicle-treated cells (vehicle: 0.1% v/v DMSO for E2 and tartrazine or 0.1% v/v PBS for SA, SPH, SCAP, SA-NAc and OSPCA). *Significant increase (p > 0.95) over cells treated with the equivalent vehicle using One-way ANOVA with Dunnett’s post-hoc test. B, cells were pre-treated with 100 nM ICI182780, followed by treatment with ICI182780, tartrazine, sulphonated metabolites or major sulphonated contaminant with the addition of 1 nM E2 for 24 h. Data are the mean and standard deviation luciferase activity from 3 separate determinations from the same experiment, typical of at least 3 separate experiments and expressed in fold change versus vehicle-treated cells (vehicle: 0.1% v/v DMSO for E2 and tartrazine or 0.1% v/v PBS for SA, SPH, SCAP, SA-NAc and OSPCA). *Significant increase (p > 0.95) over cells treated with vehicle only using Student’s T-test (two-tailed). #Significant decrease (p > 0.95) over cells treated with 1 nM E2 in the absence of ICI182780 using one-way ANOVA with Dunnett’s post-hoc test.
Fig. 4
Fig. 4
Tartrazine, its sulphonated metabolites or major sulphonated contaminant are neither agonists nor antagonists of the mouse ERβ variant 2. Luciferase reporter gene ((ERE)3-pGL3promotor) assay in 603B cells co-transfected with a pcDNA3.1 expression construct encoding the mouse ERβ variant 2. A, constitutively activate mouse ERβ variant 2 was de-activated with 100 nM ICI182780 for 6 h followed by several wash steps with sterile PBS. Cells were then treated with E2, tartrazine or its sulphonated metabolites or major sulphonated contaminant at the indicated concentrations for 24 h. Data are the mean and standard deviation luciferase activity from 3 separate determinations from the same experiment, typical of at least 3 separate experiments. Data are expressed in fold change versus vehicle-treated cells (vehicle: 0.1% v/v DMSO for E2 and tartrazine or 0.1% v/v PBS for SA, SPH, SCAP, SA-NAc and OSPCA). *Significant increase (p > 0.95) over cells treated with the equivalent vehicle using one-way ANOVA with Dunnett’s post-hoc test. B, cells were pre-treated with 100 nM ICI182780 for 6 h followed by treatment with ICI182780, tartrazine, sulphonated metabolites or major sulphonated contaminant with the addition of 1 nM E2 for 24 h. Data are the mean and standard deviation luciferase activity from 3 separate determinations from the same experiment, typical of at least 3 separate experiments and expressed in fold change versus vehicle-treated cells (vehicle: 0.1% v/v DMSO for E2 and tartrazine or 0.1% v/v PBS for SA, SPH, SCAP, SA-NAc and OSPCA). *Significant increase (p > 0.95) over cells treated with vehicle only using Student’s T-test (two-tailed). #Significant decrease (p < 0.95) over cells treated with 1 nM E2 in the absence of ICI182780 using one-way ANOVA with Dunnett’s post-hoc test.
Fig. 5
Fig. 5
Tartrazine lacks an uterotrophic effect in mice in vivo. Nineteen day old female C57Bl6 mice were administered the indicated compound by single intraperitoneal injection for four consecutive days before study termination and excision of uteri on day 5. A, photomicrograph of typical uteri at termination demonstrating physiological effect of treatments. B, mean relative wet weight of uteri at study termination. Data are the mean and standard deviation of at least 4 animals/group, *significantly different wet weight versus vehicle control using the Student’s t-test (two tailed), p > 0.95.
Fig. 6
Fig. 6
Oral exposure to tartrazine results in gastrointestinal and hepatic inflammation without leading to cholestasis. Adult male C57Bl/6 Tg(NF-kB) and wild type mice were initially orally administered twice daily with either ethanol or dextrose for 2 weeks and then additionally with or without tartrazine for a further 10 weeks as outlined in methods section. Mice in the control groups were dosed with ethanol or dextrose solution alone. A, IVIS images of Tg(NF-kB) mice at the indicated times after initial treatment. B, Integrated photon emission analysis of light emission profiles of the hepatic and abdominal regions of live Tg(NF-kB) animal images and the indicated times after initial treatment, data are the mean and standard deviation of at least 3 animals/group, *significantly different from control vehicle treated mice using the Student’s t-test, two-tailed, p > 0.95. C, IVIS images of Tg(NF-kB) mouse organs at termination of the study (12 weeks after study initiation). D, Integrated photon emission analysis of light emission profiles of the organs from Tg(NF-kB) animal images at termination of the study (12 weeks after study initiation), data are the mean and standard deviation of at least 3 animals/group, *significantly different from control vehicle treated mice using the Student’s t-test, two-tailed, p > 0.95. E, serum ALP (left panel) and ALT (right panel) at termination of the study (12 weeks after study initiation), data are the mean and standard deviation of at least 3 animals/group, *significantly different from control vehicle treated mice using the Student’s t-test, two-tailed, p > 0.95.
Fig. 6
Fig. 6
Oral exposure to tartrazine results in gastrointestinal and hepatic inflammation without leading to cholestasis. Adult male C57Bl/6 Tg(NF-kB) and wild type mice were initially orally administered twice daily with either ethanol or dextrose for 2 weeks and then additionally with or without tartrazine for a further 10 weeks as outlined in methods section. Mice in the control groups were dosed with ethanol or dextrose solution alone. A, IVIS images of Tg(NF-kB) mice at the indicated times after initial treatment. B, Integrated photon emission analysis of light emission profiles of the hepatic and abdominal regions of live Tg(NF-kB) animal images and the indicated times after initial treatment, data are the mean and standard deviation of at least 3 animals/group, *significantly different from control vehicle treated mice using the Student’s t-test, two-tailed, p > 0.95. C, IVIS images of Tg(NF-kB) mouse organs at termination of the study (12 weeks after study initiation). D, Integrated photon emission analysis of light emission profiles of the organs from Tg(NF-kB) animal images at termination of the study (12 weeks after study initiation), data are the mean and standard deviation of at least 3 animals/group, *significantly different from control vehicle treated mice using the Student’s t-test, two-tailed, p > 0.95. E, serum ALP (left panel) and ALT (right panel) at termination of the study (12 weeks after study initiation), data are the mean and standard deviation of at least 3 animals/group, *significantly different from control vehicle treated mice using the Student’s t-test, two-tailed, p > 0.95.
Fig. 7
Fig. 7
Tartrazine, its sulphonated metabolites or major sulphonated contaminant inhibit murine hepatic dopamine sulphotransferase activity in murine S9 preparations. A, 35S PAPS utilisation in murine hepatic S9 fraction prepared from C57Bl/6 mice. S9 fractions were incubated with 60 μM substrate dopamine (with pargyline at 1 mM to inhibit monoamine oxidases) alone (vehicle) or in combination with inhibitors PCP, quercetin or tartrazine, its gut-derived metabolites (SA, SA-NAc, SPH, SCAP) and the contaminant OSPCA at concentrations as indicated. B, S9 fractions were incubated with 1 μM substrate oestrone alone (vehicle) or in combination with inhibitors PCP, quercetin or tartrazine, its gut-derived metabolites (SA, SA-NAc, SPH, SCAP) and the contaminant OSPCA at concentrations as indicated. All results were normalised to protein concentration. Data are mean and standard deviation of 3 separate determinations. *Significantly different versus vehicle control using One-way ANOVA with Dunnett’s post-hoc modifications, p > 0.95.

References

    1. Abdelmegeed M.A., Banerjee A., Jang S., Yoo S.H., Yun J.W., Gonzalez F.J., Keshavarzian A., Song B.J. CYP2E1 potentiates binge alcohol-induced gut leakiness, steatohepatitis, and apoptosis. Free Radic. Biol. Med. 2013;65:1238–1245. - PMC - PubMed
    1. Ahlbory-Dieker D.L., Stride B.D., Leder G., Schkoldow J., Trölenberg S., Seidel H., Otto C., Sommer A., Parker M.G., Schütz G., Wintermantel T.M. DNA binding by estrogen receptor-alpha is essential for the transcriptional response to estrogen in the liver and the uterus. Mol. Endocrinol. 2009;23:1544–1555. - PMC - PubMed
    1. Alnouti Y. Bile Acid sulfation: a pathway of bile acid elimination and detoxification. Toxicol. Sci. 2009;108:225–246. - PubMed
    1. Alvaro D., Invernizzi P., Onori P., Franchitto A., De Santis A., Crosignani A., Sferra R., Ginanni-Corradini S., Mancino M.G., Maggioni M., Attili A.F., Podda M., Gaudio E. Estrogen receptors in cholangiocytes and the progression of primary biliary cirrhosis. J. Hepatol. 2004;41:905–912. - PubMed
    1. Alvaro D., Mancino M.G., Onori P., Franchitto A., Alpini G., Francis H., Glaser S., Gaudio E. Estrogens and the pathophysiology of the biliary tree. World J. Gastroenterol. 2006;12:3537–3545. - PMC - PubMed

MeSH terms

LinkOut - more resources