. 2017 Jun 16;292(24):9865-9881.
doi: 10.1074/jbc.M117.782987. Epub 2017 Mar 29.

Rearrangement of a polar core provides a conserved mechanism for constitutive activation of class B G protein-coupled receptors

Affiliations

Rearrangement of a polar core provides a conserved mechanism for constitutive activation of class B G protein-coupled receptors

Yanting Yin et al. J Biol Chem. .

Abstract

The glucagon receptor (GCGR) belongs to the secretin-like (class B) family of G protein-coupled receptors (GPCRs) and is activated by the peptide hormone glucagon. The structures of an activated class B GPCR have remained unsolved, preventing a mechanistic understanding of how these receptors are activated. Using a combination of structural modeling and mutagenesis studies, we present here two modes of ligand-independent activation of GCGR. First, we identified a GCGR-specific hydrophobic lock comprising Met-338 and Phe-345 within the IC3 loop and transmembrane helix 6 (TM6) and found that this lock stabilizes the TM6 helix in the inactive conformation. Disruption of this hydrophobic lock led to constitutive G protein and arrestin signaling. Second, we discovered a polar core comprising conserved residues in TM2, TM3, TM6, and TM7, and mutations that disrupt this polar core led to constitutive GCGR activity. On the basis of these results, we propose a mechanistic model of GCGR activation in which TM6 is held in an inactive conformation by the conserved polar core and the hydrophobic lock. Mutations that disrupt these inhibitory elements allow TM6 to swing outward to adopt an active TM6 conformation similar to that of the canonical β2-adrenergic receptor complexed with G protein and to that of rhodopsin complexed with arrestin. Importantly, mutations in the corresponding polar core of several other members of class B GPCRs, including PTH1R, PAC1R, VIP1R, and CRFR1, also induce constitutive G protein signaling, suggesting that the rearrangement of the polar core is a conserved mechanism for class B GPCR activation.

Keywords: 7-helix receptor; G protein-coupled receptor (GPCR); arrestin; glucagon; parathyroid hormone.


Conflict of interest statement

The authors declare that they have no conflicts of interest with the contents of this article

Figures

Figure 1.
Figure 1.
A hydrophobic core comprising Leu-329, Leu-333, Met-338, and Phe-345 in GCGR. a, a putative diagram of the human GCGR showing residues that are involved in the hydrophobic patch in this study. The positions of residues Leu-329, Leu-333, Met-338, and Phe-345 are indicated. b, close-up of the hydrophobic lock residues Leu-329, Leu-333, Met-338, and Phe-345 in GCGR; the yellow dashed lines indicate hydrophobic van der Waals interactions. c, the structure of inactive GCCR (Protein Data Bank code 5EE7) is in schematic representation, viewed from the membrane. The MK-0893 antagonist (GCGR antagonist) is shown as a red stick model, and Phe-345 is shown as a green stick model. d, view as in c but rotated 90° to view from the cytoplasm. e, alignment of partial amino acid sequences of several representative class B GPCRs shows that the hydrophobic lock is only partially conserved. The blue stars mark the position of these four hydrophobic amino acids.
Figure 2.
Figure 2.
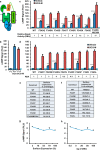
cAMP signaling and cell surface expression of the Phe-345-mutated GCGR. a, schematic presentation of G protein activation by the full-length GCGR when co-expressed with membrane-tethered GCG. b, comparison of cAMP signaling of WT GCGR induced by 1.0 μm exogenous GCG and GCG-M. c and d, basal and membrane-tethered GCG-stimulated cAMP signaling by WT and Phe-345-mutated GCGR with hydrophilic residues (c) or hydrophobic residues (d). The blue background indicates the basal activity of WT full-length GCGR. Relative basal activity (RBA), -fold increase in basal activity of the mutated receptors relative to the WT. Error bars represent S.D. of triplicate determinations. Two-tailed Student's t test was used to determine p values for data point versus wild-type basal activity: **, p ≤ 0.01; ***, p ≤ 0.001; ****, p ≤ 0.0001. e and f, cell surface expression of WT and Phe-345-mutated GCGR with hydrophilic amino acids (e) and hydrophobic residues (f). Data are presented as percentage of the WT GCGR expression level. g and h, correlation of cAMP signal with surface expression levels of GCGR (g) and amounts of transfected DNA (h). Note that the cAMP signal is relatively constant at varying amounts of transfected DNA and surface expression levels. RLU, relative luciferase unit, which is the ratio of the CRE-luciferase activity to the Renilla luciferase activity.
Figure 3.
Figure 3.
cAMP signaling and cell surface expression of Met-338-mutated GCGR. a and b, basal and membrane-tethered GCG-stimulated cAMP signaling of WT and Met-338-mutated GCGR with hydrophilic amino acids (a) and hydrophobic amino acids (b). The blue bars represent the basal activity, and red bars represent the activity stimulated by membrane-tethered GCG. The blue background indicates the basal activity of WT full-length GCGR. Relative basal activity (RBA), -fold increase in basal activity of the mutated receptors relative to the WT. Error bars represent S.D. of triplicate determinations. Two-tailed Student's t test was used to determine p values for data point versus wild-type basal activity: ***, p ≤ 0.001; ****, p ≤ 0.0001. c and d, cell surface expression of GCGR mutated with hydrophilic amino acids (c) and hydrophobic amino acids (d) at position Met-338. Data are presented as percent expression level relative to that of the WT receptor (100%). RLU, relative luciferase unit, which is the ratio of the CRE-luciferase activity to the Renilla luciferase activity.
Figure 4.
Figure 4.
cAMP signaling and cell surface expression of GCGR with mutations at positions Leu-329 and Leu-333 located at TM5. a and b, the basal and membrane-tethered GCG peptide-stimulated cAMP signaling of GCGR with mutations introduced at position Leu-329 (a) and Leu-333 (b). The blue bars represent the basal activity, and red bars represent the activity stimulated by membrane-tethered GCG. Relative basal activity (RBA), -fold increase in basal activity of the mutated receptors relative to the WT receptor. The blue background indicates basal activity of the wild-type full-length GCGR. Error bars represent S.D. of triplicate determinations. Two-tailed Student's t test was used to determine p values for data point versus wild-type basal activity: *, p ≤ 0.05; **, p ≤ 0.01; ***, p ≤ 0.001. c and d, cell surface expression of GCGR with amino acid substitutions at positions Leu-329 (c) and Leu-333 (d) are shown. Data are presented as percentage of the WT GCGR expression level (100%). RLU, relative luciferase unit, which is the ratio of the CRE-luciferase activity to the Renilla luciferase activity.
Figure 5.
Figure 5.
Role of the ECD in the constitutive activation of mutated GCGR. a, cAMP signal of the GCGR TMD with mutations in hydrophobic lock residues (F345K; M338K; and F345K,M338K) or in TM6 Phe-345 (F345W, F345G, and F345P) and of full-length GCGR with mutations in ECL3 and Tyr-65. Relative basal activity (RBA), -fold increase in basal activity of the mutated receptors relative to the WT receptor. Error bars represent S.D. of triplicate determinations. Two-tailed Student's t test was used to determine p values for data point versus the basal activity of the WT TMD: ***, p ≤ 0.001; ****, p ≤ 0.0001. b, Western blot analysis of WT GCGR TMD or TMD with constitutively activating mutations. All immunoblottings were performed with anti-FLAG antibody for detection and anti-β-actin antibody for normalization. Each lane was normalized by β-actin. Relative expression was calculated from the glycosylated band (TMD-G), which roughly represents the surface expression of TMDs, with expression of wild-type TMD as 1.00. FL, full-length; FL-G, glycosylated full-length WT GCGR. RLU, relative luciferase unit, which is the ratio of the CRE-luciferase activity to the Renilla luciferase activity.
Figure 6.
Figure 6.
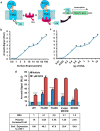
Mutations that constitutively activate G protein signaling also induced constitutive arrestin recruitment. a, diagram of the Tango assay to detect arrestin binding through luciferase reporter signals. tTA/transcriptional response element (TRE)-luciferase reporter signals serve as a measure for β-arrestin1 recruitment by WT and mutant receptors. b and c, correlation of arrestin recruitment signals with surface expression levels of WT GCGR (b) and with amounts of transfected DNA (c). Note that the arrestin recruitment signals change along with the increasing amounts of transfected DNA and the levels of surface-expressed WT GCGR. d, basal and exogenous GCG-stimulated arrestin signals by mutant receptors that can constitutively activate the G protein signaling pathway. Plasmid Increased Fold, -fold increase in the amount of transfected DNA based on the difference of surface expression between wild-type and mutant GCGR (see Figs. 2c and 3c). Relative basal activity (RBA), -fold increase in basal activity of the mutated receptors relative to the WT receptor. Surf. Expression % of WT, relative surface expression of constructs at the indicated -fold amount of transfected DNA. The blue background indicates basal activity of wild-type full-length GCGR. Error bars represent S.D. of triplicate determinations. Two-tailed Student's t test was used to determine p values for data point versus the basal activity of the WT GCGR: *, p ≤ 0.05; **, p ≤ 0.01; ***, p ≤ 0.001; ****, p ≤ 0.0001. RLU, relative luciferase unit, which is the ratio of the CRE-luciferase activity to the Renilla luciferase activity.
Figure 7.
Figure 7.
Function of the GCGR hydrophobic lock is not conserved in other class B GPCRs. Basal (blue bars) and ligand-activated (red bars) cAMP signals of the WT and mutant receptors CRF1R (a), PAC1R (b), PTH1R (c), and GLP-1R (d) are shown. The mutations in different receptors correspond to M338D and F347K in GCGR. All ligands were used at saturated levels that were saturated for activation of their cognate receptors. Error bars represent S.D. of triplicate determinations. RLU, relative luciferase unit, which is the ratio of the CRE-luciferase activity to the Renilla luciferase activity. PTH, parathyroid hormone; EX4, exendin-4.
Figure 8.
Figure 8.
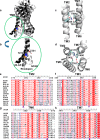
A conserved polar core formed by residues from TM2, TM3, TM6, and TM7 of class B GPCRs. a, structure superposition of rhodopsin in active and arrestin-bound conformation (gray; Protein Data Bank code 4ZWJ), β2AR in active and Gs-bound conformation (black; Protein Data Bank code 3SN6), and GCGR in inactive conformation (white; Protein Data Bank code 5EE7). Arrestin, Gs, and fusion protein were omitted for clarity. b, superposition of TM6 of rhodopsin, β2AR, and GCGR. The conserved GCGR residue Thr-351 at the pivot point of TM6 is shown in red stick representation, and the corresponding residues rhodopsin Thr-251and β2AR Thr-274 are shown in orange and blue stick representations, respectively. c and d, two 90° views of the GCGR polar core structure. Extracellular and intracellular loops have been removed for clarity. The polar core residues His-177 at TM2, Glu-245 at TM3, Thr-351 at TM6, and Tyr-400 at TM7 are labeled in blue stick. The red dashed lines indicate hydrogen bonding between polar core residues. e–h, sequence alignment of the polar core helices of class B GPCRs: TM2 (e), TM3 (f), TM6 (g), and TM7 (h). Purple triangles, conserved polar core residues. CALCR, calcitonin receptor; SCTR, secretin receptor; GIPR, gastric inhibitory polypeptide receptor; GHRHR, growth hormone-releasing hormone receptor.
Figure 9.
Figure 9.
Effect of Thr-351 mutations on GCGR activity and expression. a, basal and GCG-stimulated cAMP accumulation by full-length WT and Thr-351-mutated GCGR, rearranged by the strength of the basal cAMP signal (from right to left). The blue background indicates the basal activity of full-length WT GCGR. Relative basal activity (RBA), -fold increase in basal activity of the mutated receptors relative to the WT receptor. Error bars represent S.D. of triplicate determinations. b, cell surface expression of full-length GCGR with amino acid substitutions at position Thr-351. Data are presented as percent expression levels relative to that of WT receptor. c, arrestin signal by mutant GCGRs that produces high basal G protein signal. Plasmid Increase Fold, -fold increase in the amount of transfected DNA based on the difference of surface expression between wild type and mutations (see Fig. 8b). Relative basal activity (RBA), -fold increase in basal activity of the mutated receptors relative to the WT receptor. Surf. Expression % of WT, relative surface expression of constructs at the indicated -fold amount of transfected DNA. The blue background marks the basal activity of full-length WT GCGR. Error bars represent S.D. of triplicate determinations. Two-tailed Student's t test was used to determine p values for data point versus the basal activity of the WT GCG receptor: **, p ≤ 0.01; ****, p ≤ 0.0001. d, dose-dependent arrestin recruitment signals by mutant receptors. All values are means ± S.E. (error bars) of two independent experiments, each conducted in triplicate. RLU, relative luciferase unit, which is the ratio of the CRE-luciferase activity to the Renilla luciferase activity.
Figure 10.
Figure 10.
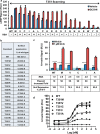
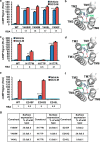
Polar core mutations increase basal GCGR activity. a, c, and e, basal and membrane-tethered GCG-stimulated cAMP signals of GCGR with mutations at position Tyr-400 (a), His-177 (c), and Glu-245 (e). The blue background marks the basal activity of the wild-type full-length GCGR. Relative basal activity (RBA), -fold increase in basal activity of mutant receptors relative to WT receptor. Error bars represent S.D. of triplicate determinations. Two-tailed Student's t test was used to determine p values for data point versus the basal activity of WT GCGR: **, p ≤ 0.01; ****, p ≤ 0.0001. b, d, and f, structure of the GCGR polar core in which residues Tyr-400 (b), His-177 (d), and Glu-245 (f) are highlighted in green. g, cell surface expression of GCGR with substitutions at position Tyr-400, His-177, and Glu-245. Data are presented as percent expression levels relative to that of WT receptor (100%). RLU, relative luciferase unit, which is the ratio of the CRE-luciferase activity to the Renilla luciferase activity.
Figure 11.
Figure 11.
Polar core presents a conserved mechanism for inactivation of class B GPCRs. a and b, basal and PAC27(1–27)-stimulated cAMP signals produced by full-length PAC1R with amino acid substitutions at positions Thr-383 (a) and His-185 and Tyr-396 (b). c and d, basal and membrane-tethered VIP(1–28)-stimulated cAMP signals produced by full-length VIP1R with amino acid substitutions at positions Thr-343 (c) and His-178 and Tyr-388 (d). VIP-M, membrane-tethered VIP(1–28). e and f, basal and UCN1-stimulated cAMP signal produced by full-length CRF1R with amino acid substitutions at positions Thr-316 (e) and His-155 and Tyr-363 (f). g, basal and parathyroid hormone (PTH)-stimulated cAMP signals produced by full-length PTH1R with amino acid substitutions at position Tyr-459. h, basal and exendin-4 (EX4)-stimulated cAMP signals produced by full-length GLP-1R with amino acid substitutions at position Thr-353, His-180, and Glu-247. Relative basal activity (RBA), -fold increase in basal activity of mutated receptors relative to WT receptor. Error bars represent S.D. of triplicate determinations. Two-tailed Student's t test was used to determine p values for data point versus the basal activity of the WT receptor: ***, p ≤ 0.001; ****, p ≤ 0.0001. RLU, relative luciferase unit, which is the ratio of the CRE-luciferase activity to the Renilla luciferase activity.

References

    1. Lagerström M. C., and Schiöth H. B. (2008) Structural diversity of G protein-coupled receptors and significance for drug discovery. Nat. Rev. Drug Discov. 7, 339–357 - PubMed
    1. Hancock A. S., Du A., Liu J., Miller M., and May C. L. (2010) Glucagon deficiency reduces hepatic glucose production and improves glucose tolerance in adult mice. Mol. Endocrinol. 24, 1605–1614 - PMC - PubMed
    1. Kumar S., Pioszak A., Zhang C., Swaminathan K., and Xu H. E. (2011) Crystal structure of the PAC1R extracellular domain unifies a consensus fold for hormone recognition by class B G-protein coupled receptors. PLoS One 6, e19682. - PMC - PubMed
    1. Hoare S. R. (2005) Mechanisms of peptide and nonpeptide ligand binding to Class B G-protein-coupled receptors. Drug Discov. Today 10, 417–427 - PubMed
    1. Parthier C., Reedtz-Runge S., Rudolph R., and Stubbs M. T. (2009) Passing the baton in class B GPCRs: peptide hormone activation via helix induction? Trends Biochem. Sci. 34, 303–310 - PubMed

MeSH terms

Substances