. 2017 May 15;28(10):1288-1300.
doi: 10.1091/mbc.E16-12-0852. Epub 2017 Mar 29.

Clustering of integrin α5 at the lateral membrane restores epithelial polarity in invasive colorectal cancer cells

Affiliations

Clustering of integrin α5 at the lateral membrane restores epithelial polarity in invasive colorectal cancer cells

Alina Starchenko et al. Mol Biol Cell. .

Abstract

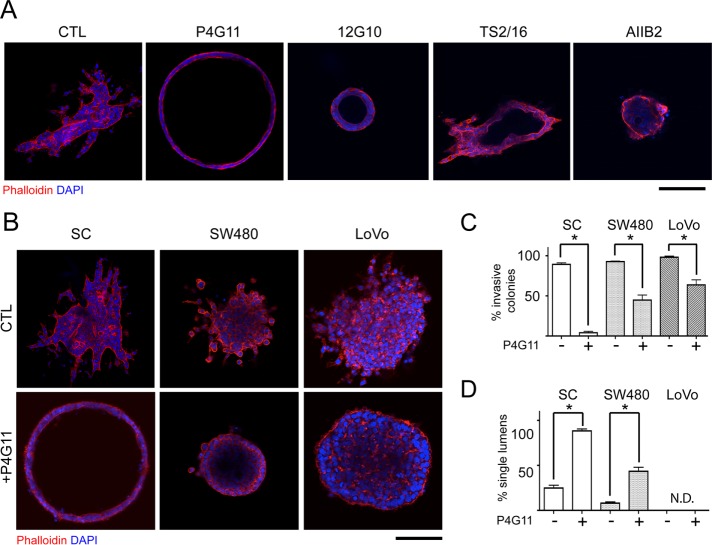
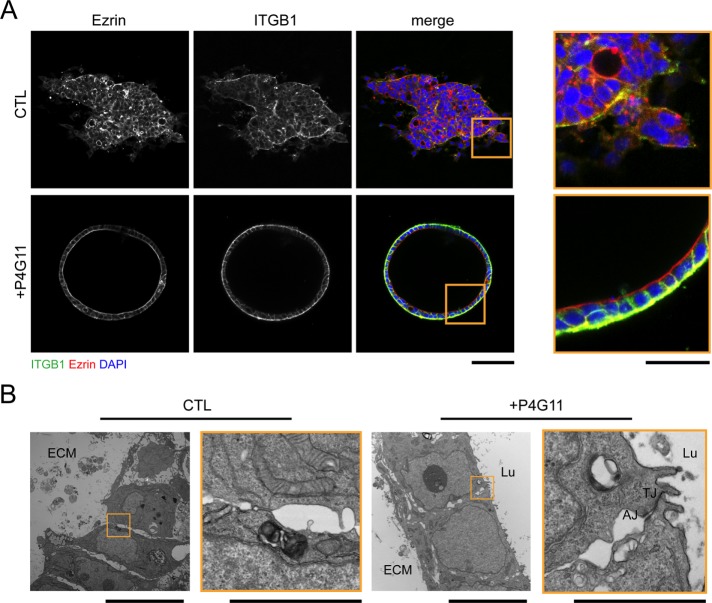
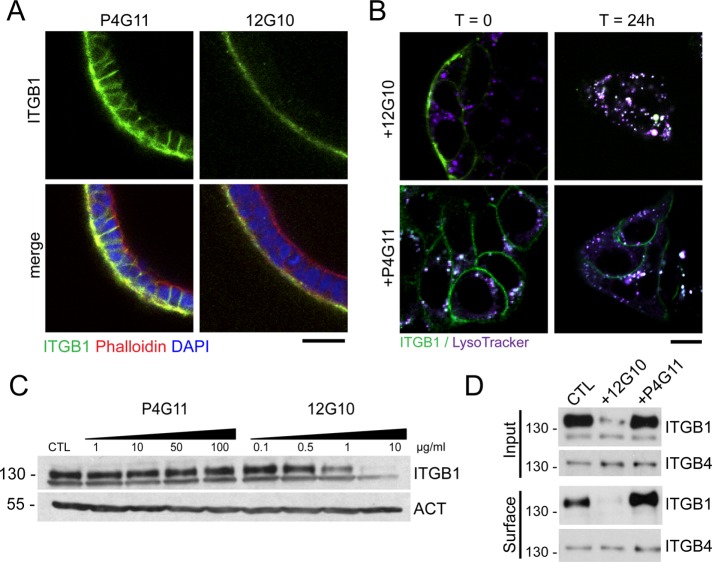
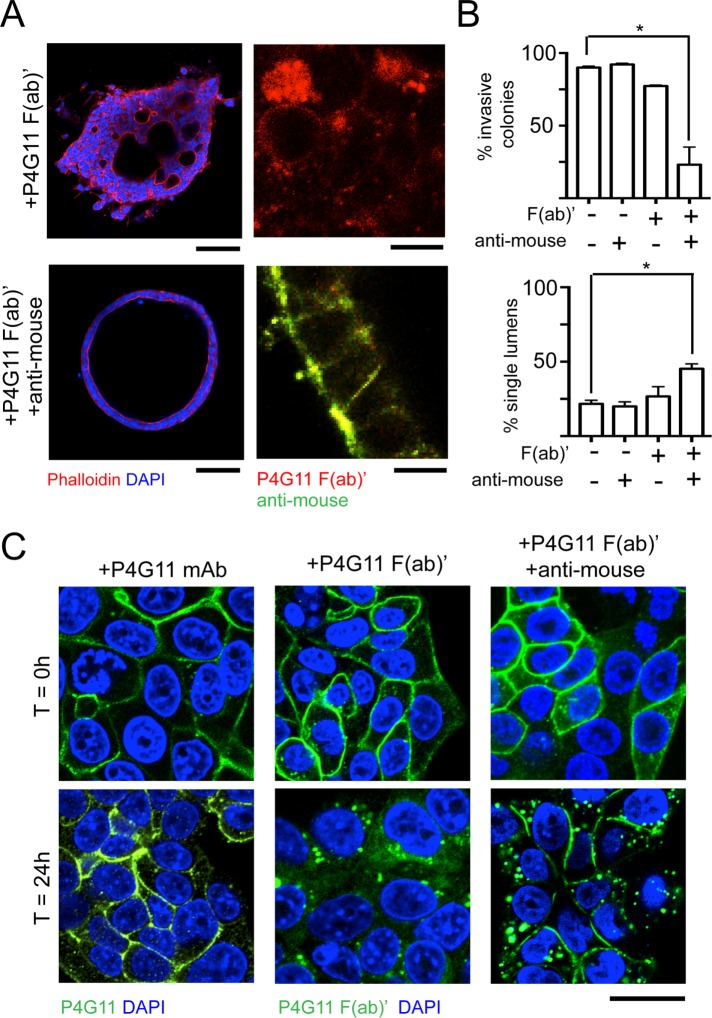
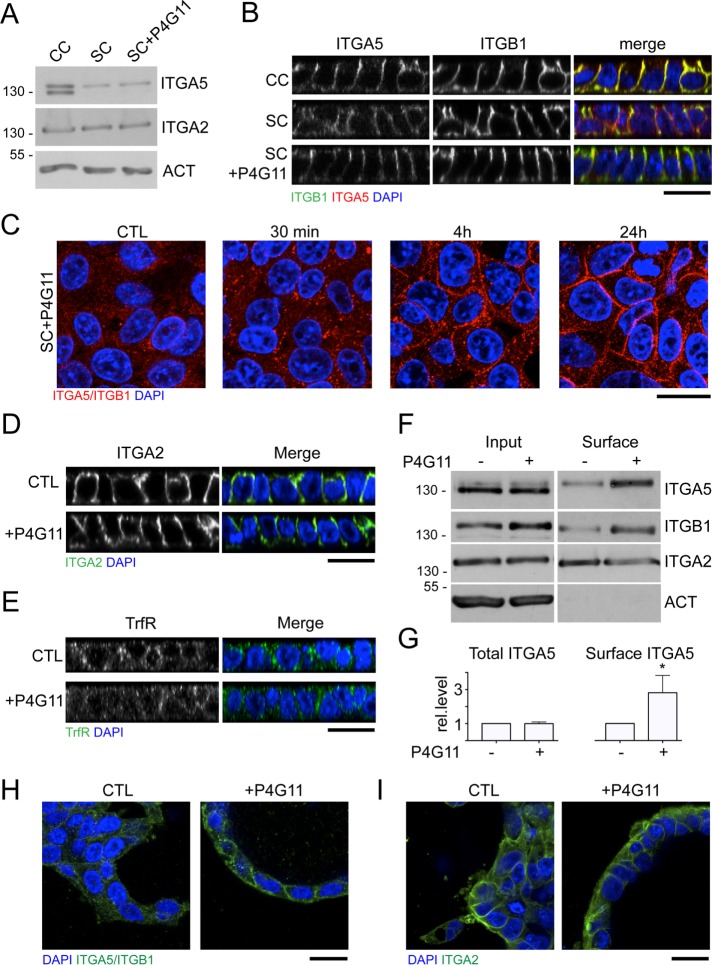
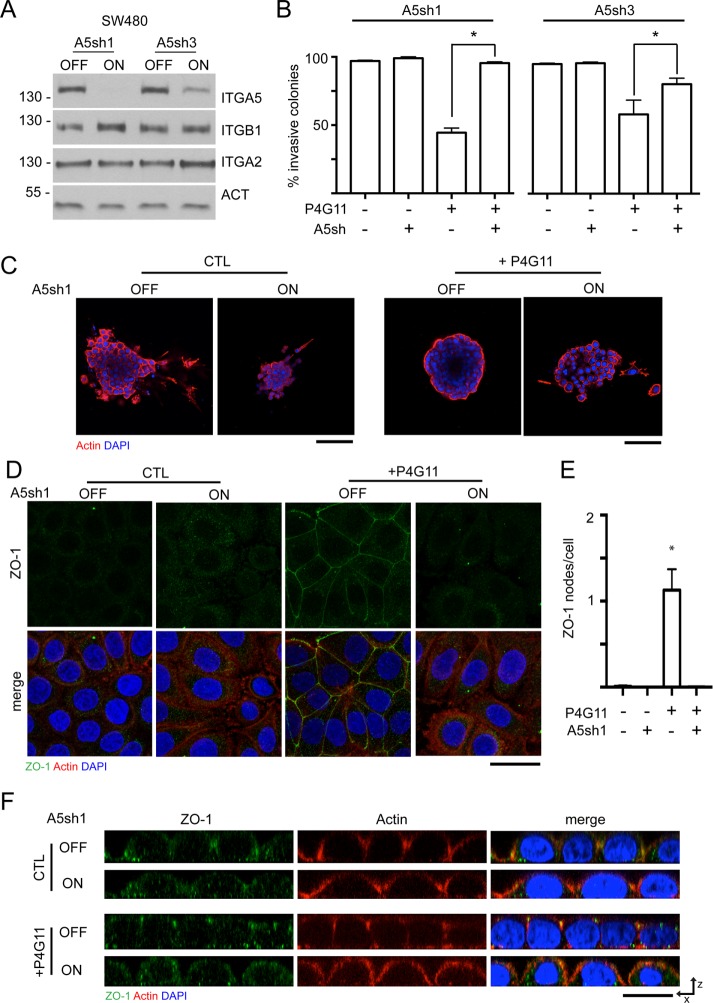
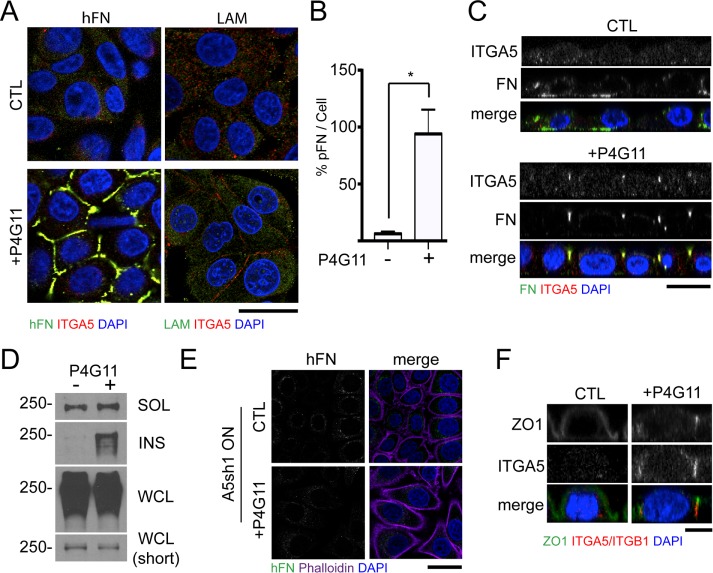
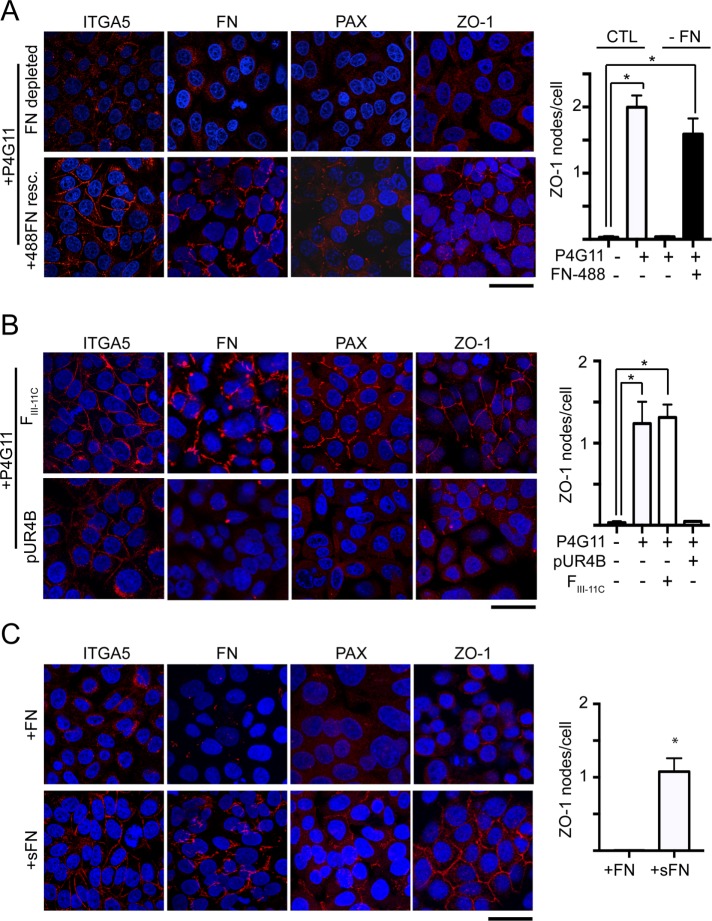
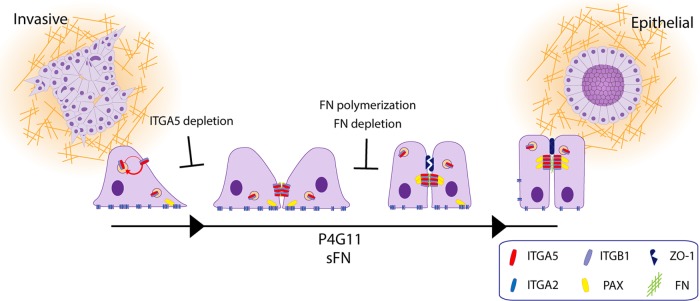
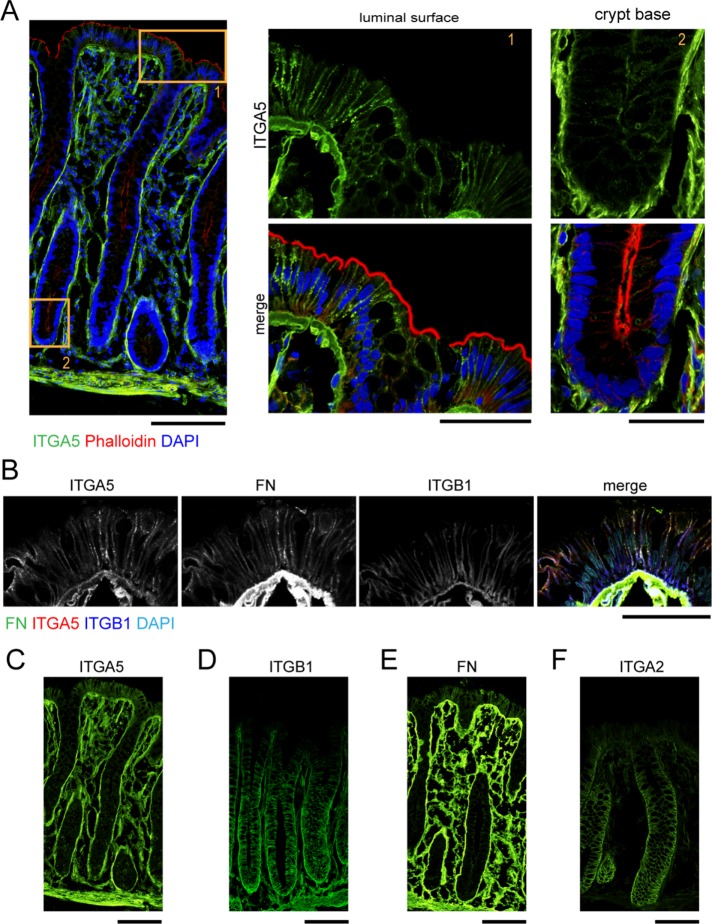
Apicobasolateral polarity is a fundamental property of epithelial cells, and its loss is a hallmark of cancer. Integrin-mediated contact with the extracellular matrix defines the basal surface, setting in motion E-cadherin-mediated cell-cell contact, which establishes apicobasolateral polarity. Role(s) for lateral integrins in this polarization process and the consequences of their disruption are incompletely understood. We show that addition of an integrin β1-activating monoclonal antibody, P4G11, to invasive colorectal cancer cells in three-dimensional type 1 collagen reverts the invasive phenotype and restores apicobasolateral polarity. P4G11 induces clustering of integrin α5β1 at lateral, intercellular surfaces. This leads to deposition and polymerization of fibronectin and recruitment of paxillin to sites of lateral integrin α5β1 clustering and is followed by tight junction formation, as determined by ZO-1 localization. Inducible elimination of integrin α5 abrogates the epithelial-organizing effects of P4G11. In addition, polymerization of fibronectin is required for the effects of P4G11, and addition of polymerized superfibronectin is sufficient to induce tight junction formation and apicobasolateral polarization. In the normal human colon, we show that integrin α5 localizes to the lateral membrane of terminally differentiated colonocytes and that integrin α5 staining may be reduced in colorectal cancer. Thus we propose a novel role for integrin α5β1 in regulating epithelial morphogenesis.


Figures

FIGURE 1:
FIGURE 1:
The integrin β1–activating mAb P4G11 abrogates the invasive phenotype in CRC cells in 3D. (A) SC cells were plated in 3D type 1 collagen as single cells in the presence or absence of integrin β1 mAbs (10 µg/ml) as indicated. The medium was replaced every 2–3 d until day 15, when colonies were fixed and stained with phalloidin (red) and DAPI (blue). Scale bar, 100 µm. (B) SC, SW480, and LoVo cells were plated as single cells in type 1 collagen, and medium was replaced every 2–3 d. At day 8, P4G11 (10 μg/ml) was added, and medium was again changed every 2–3 d until day 15, when colonies were processed as in A. Scale bar, 100 µm. (C) Quantification of invasive phenotype of colonies growing in type 1 collagen in the presence or absence of P4G11 (mean ± SEM; >400 colonies from three separate replicates). (D) Quantification of percentage of colonies forming a single central lumen in B (mean ± SEM; >400 colonies in each of three separate replicates). N.D., not detected. Asterisks signify statistical significance with p < 0.05.
FIGURE 2:
FIGURE 2:
P4G11 restores apicobasolateral polarity and epithelial cell–cell junctions in 3D. (A) SC cells were plated as single cells in type 1 collagen, and medium was replaced every 2–3 d. At day 8, P4G11 (10 μg/ml) was added, and medium was again changed every 2–3 d until day 15, when colonies were fixed and stained with antibodies against integrin β1 (green), ezrin (red), and DAPI (blue). Representative confocal cross section through the equatorial plane of SC colonies. Scale bar, 100 μm (main images), 25 μm (insets). (B) Representative TEM images of SC colonies treated with P4G11. Highlighted sections are displayed at higher magnification on the right of each morphology. AJ, adherens junction; ECM, extracellular matrix; Lu, lumen; TJ, tight junction. Note the appearance of AJ and TJ in the magnified region in SC colonies treated with P4G11. Scale bars, 5 μm (main images), 2.5 μm (insets).
FIGURE 3:
FIGURE 3:
Differential processing of integrin β1 after treatment with two integrin β1–activating mAbs. (A) Representative confocal images of SC colonies grown as in Figure 1A, fixed, and stained with DAPI (blue), phalloidin (red), and anti–Ms-488 (green) to determine localization of integrin β1–bound P4G11 or 12G10 after treatment with antibody on days 1–15. Scale bar, 25 μm. (B) Representative confocal image of SC grown on MMC-coated coverglass for 48 h and stained with LysoTracker-FarRed (LysoTracker) before 24 h of treatment with primary labeled P4G11 or 12G10. Initial and final localizations of the antibodies show different patterns in the cells, with substantial P4G11 remaining at the cell/cell surface and 12G10 being largely internalized and colocalized with LysoTracker-positive vesicles. Scale bar, 10 μm. (C) SC cells grown on MMC-coated Transwell filters were treated with different concentrations of P4G11 or 12G10 for 24 h. The cells were examined by immunoblot analysis with antibodies to integrin β1 and phalloidin. Treatment of cells with 12G10 caused decreased cellular levels of integrin β1 at highest concentrations (1 and 10 μg/ml). Data are from one of at least three similar experiments with independent SC preparations. (D) Surface levels of integrin β1 in SC cells grown on MMC-coated Transwell filters treated with 12G10 or P4G11 (10 μg/ml) for 24 h were analyzed using cell-surface biotinylation and streptavidin immunoprecipitation, followed by immunoblot analysis with antibodies against integrin β1 and integrin β4 as a control.
FIGURE 4:
FIGURE 4:
P4G11 clustering of integrin β1 is necessary for rescue of epithelial cyst architecture in SC cells grown in 3D type 1 collagen. (A) Representative confocal image of SC grown as in Figure 1A. At day 1, P4G11 f(ab)′-dy594 fragment at 10 μg/ml in the presence or absence of a 488-conjugated anti-mouse secondary antibody. Colonies were grown until day 15, fixed, and stained with phalloidin (red) and DAPI (blue). Scale bar, 100 μm. Inset, localization of F(ab)′-dy594 alone (red) or in the presence of anti-Ms (green). Scale bar, 10 μm. (B) Quantification of the percentage of colonies exhibiting an invasive morphology, as well as a single lumen, with F(ab)′-dy594 fragment and with anti-Ms rescue (mean ± SEM; >400 colonies from three separate replicates). (C) Representative confocal image through the midline of SC grown on MMC-coated coverglass and treated with 10 μg/ml P4G11 mAb, F(ab)′-dy594, or F(ab)′ with anti-mouse (H+L) chain antibody at 4°C (time 0). Cells were then incubated at 37°C for 24 h. Shown are cells treated at T = 0 and 24 h. Note long-term membrane retention of F(ab)′-dy594 in the presence of anti-mouse secondary antibody. Scale bar, 20 μm. Asterisks signify statistical significance with p < 0.05.
FIGURE 5:
FIGURE 5:
P4G11 selectively induces membrane localization of integrin α5β1. (A) CC, SC, and SC treated with P4G11 were grown in 3D type 1 collagen as in Figure 1A. Immunoblot analysis of total levels of integrin α5, integrin α2, and actin. (B) Representative XZ-plane reconstruction of CC, SC, and SC treated with P4G11, grown on MMC-coated Transwell filters for 5 d, and treated with P4G11 on days 5–6, stained with antibodies against integrin α5β1 (red), integrin α2 (green), and DAPI (blue). Scale bar, 20 μm. (C) Representative confocal image of SC cells treated with P4G11 for indicated lengths of time, stained with antibody against integrin α5β1 (red) and DAPI (blue). Scale bar, 20 μm. (D, E) Representative XZ-plane of SC cells grown on Transwell filters for 5 d, stained with antibodies against integrin α2 (H, green), TrfR (I, green), and DAPI (blue). Scale bar, 20 μm. (F) SC grown on Transwell filters as in B underwent cell-surface biotinylation at 4°C, followed by lysis and streptavidin (SA) pull down of biotinylated protein. Relative levels of integrin α5, integrin β1, integrin α2, and actin in total and after SA pull down were analyzed in each fraction by immunoblotting. (G) Levels of integrin α5 in F were quantified using ImageJ (mean ± SEM; n = 3). (H) Representative confocal image of SC treated with P4G11 in 3D type 1 collagen as in Figure 1A, stained with antibody against integrin α5β1 green) and DAPI (blue). Scale bar, 20 μm. (I) Representative confocal image of SC treated with P4G11 in 3D type 1 collagen, stained with an antibody against integrin α2 (green) and DAPI (blue). Scale bar, 20 μm. Asterisks signify statistical significance with p < 0.05.
FIGURE 6:
FIGURE 6:
Integrin α5 is necessary for P4G11-mediated restoration of epithelial junctions in vitro. (A) Immunoblot analysis of total levels of integrin α5, integrin β1, integrin α2, and β-actin in SW480 cells engineered to produce anti–integrin α5 shRNA in the presence (ON) or absence (OFF) of doxycycline. Two different shRNAs (A5sh1 and A5sh3) targeting different parts of the integrin α5 gene were compared. (B) Quantification of the percentage of invasive SC colonies present when cells in A were grown in 3D type 1 collagen and treated with P4G11 in the presence (shA5 +) or absence (shA5 –) of anti–integrin α5 shRNA. Note lack of response to P4G11 in colonies expressing anti–integrin α5 shRNA (mean ± SEM; >300 colonies from three separate replicates). (C) Representative confocal image of cells in A grown in 3D type 1 collagen as in Figure 1A and treated with P4G11 in presence (ON) or absence (OFF) of anti–integrin α5 shRNA (A5sh1 shown) stained with phalloidin (red) and DAPI (blue). Scale bar, 100 μm. (D) Representative maximum intensity projections of SW480 cells grown on MMC-coated coverglass stained with phalloidin (red), DAPI (blue), and an antibody against ZO-1 (green). Scale bar, 20 μm. (E) Quantification of number of cells exhibiting ZO-1 localization of cell–cell membranes through ImageJ analysis (see Materials and Methods; mean ± SEM; more than five 20× fields of view from three separate replicates). (F) Representative XZ-plane reconstruction of cells in A stained with antibodies against ZO-1 (green), phalloidin (red), and DAPI (blue). Scale bar, 20 μm. Asterisks signify statistical significance with p < 0.05.
FIGURE 7:
FIGURE 7:
Integrin α5 clustering leads to fibronectin polymerization and paxillin localization to the lateral surface in vitro. (A) SW480 cells were grown on MMC-coated coverglass and treated with P4G11 for 48 h. Representative confocal image of SW480 cells stained with antibodies against DAPI (blue), integrin α5β1 (red), and either human fibronectin or laminin (green). Note that only fibronectin is assembled and deposited laterally in response to P4G11 treatment. Scale bar, 20 μm. (B) Quantification of amount of fibronectin deposits per field of view normalized to cell number as in A (mean ± SEM; more than five fields of view from three separate replicates). (C) Representative XZ-plane reconstruction of SW480 cells stained with antibodies against integrin α5β1 (red), human fibronectin (green), and DAPI (blue). Scale bar, 20 μm. (D) Analysis of fibronectin polymerization in SW480 cells grown as in A by 1% DOC solubility assay (SOL, soluble in 1% DOC; INS, insoluble in 1% DOC; WCL, whole-cell lysate), followed by immunoblotting with an antibody against fibronectin. (E) Representative confocal cross section of SW480-A5sh1 cells treated with P4G11 in the presence of Dox and stained with antibodies against human fibronectin, phalloidin (purple), and DAPI (blue). Scale bar, 10 μm. (F) Representative XZ-plane reconstruction of cell–cell junction between SW480 cells stained with antibodies against ZO-1 (green), integrin α5β1 (red), and DAPI (blue). Scale bar, 5 μm. Asterisks signify statistical significance with p < 0.05.
FIGURE 8:
FIGURE 8:
Fibronectin is necessary and sufficient to induce redistribution of integrin α5 and paxillin to lateral membrane and induce TJ formation. SW480 cells were grown on MMC-coated coverglass and treated for 48 h as indicated and stained with antibodies against integrin α5, human fibronectin, paxillin, or ZO-1 (all shown in red) and DAPI (blue). Representative maximum intensity projections generated using confocal optical sectioning and quantification of number of cells exhibiting ZO-1 localization of cell–cell membranes through ImageJ analysis as described in Materials and Methods (mean ± SEM; more than five 20× fields of view from three separate replicates). Scale bars, 50 μm. (A) Cells were grown in medium depleted of serum fibronectin and treated with P4G11 for 48 h with or without addition of 200 μg/ml 488–bovine fibronectin. (B) SW480 cells were treated with P4G11 for 48 h in the presence of 250 nM fibronectin polymerization–blocking peptide pUR4B or control peptide FIII-11C. (C) SW480 cells were treated with 20 μg/ml polymerized superfibronectin or an equivalent amount of 488–bovine fibronectin for 48 h. Asterisks signify statistical significance with p < 0.05.
FIGURE 9:
FIGURE 9:
Model depicting the process of P4G11- and fibronectin-mediated restoration of apicobasolateral polarity. See the text for details.
FIGURE 10:
FIGURE 10:
Integrin α5 is present at the lateral surface in the terminally differentiated compartment of the normal human colon. (A) Representative confocal images of a normal human colon section stained with antibody against integrin α5 (green), phalloidin (red), and DAPI (blue); scale bar, 100 μm. High-magnification view of differentiated (1) and progenitor (2) regions of crypt. Scale bar, 50 μm. (B) High magnification of epithelial cells at the luminal surface stained with antibodies against integrin α5 (red), fibronectin (green), integrin β1 (blue), and DAPI (teal). (C–F) Sections of normal human colon stained with antibodies against integrin α5 (C), integrin β1 (D), fibronectin (E), and integrin α2 (F). Scale bars, 50 μm.

Similar articles

Cited by

References

    1. Akhtar N, Streuli CH. An integrin-ILK-microtubule network orients cell polarity and lumen formation in glandular epithelium. Nat Cell Biol. 2013;15:17–27. - PMC - PubMed
    1. Araki E, Momota Y, Togo T, Tanioka M, Hozumi K, Nomizu M, Miyachi Y, Utani A. Clustering of syndecan-4 and integrin beta 1 by laminin alpha 3 chain-derived peptide promotes keratinocyte migration. Mol Biol Cell. 2009;20:3012–3024. - PMC - PubMed
    1. Arjonen A, Alanko J, Veltel S, Ivaska J. Distinct recycling of active and inactive beta1 integrins. Traffic. 2012;13:610–625. - PMC - PubMed
    1. Beaulieu JF, Vachon PH, Chartrand S. Immunolocalization of extracellular matrix components during organogenesis in the human small intestine. Anat Embryol (Berl) 1991;183:363–369. - PubMed
    1. Bouvard D, Pouwels J, De Franceschi N, Ivaska J. Integrin inactivators: balancing cellular functions in vitro and in vivo. Nat Rev Mol Cell Biol. 2013;14:430–442. - PubMed

MeSH terms