. 2017 Jul 1;118(1):93-102.
doi: 10.1152/jn.00045.2017. Epub 2017 Mar 29.

PICs in motoneurons do not scale with the size of the animal: a possible mechanism for faster speed of muscle contraction in smaller species

Affiliations

PICs in motoneurons do not scale with the size of the animal: a possible mechanism for faster speed of muscle contraction in smaller species

Seoan Huh et al. J Neurophysiol. .

Abstract

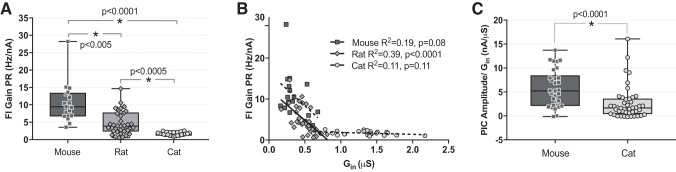
The majority of studies on the electrical properties of neurons are carried out in rodents, and in particular in mice. However, the minute size of this animal compared with humans potentially limits the relevance of the resulting insights. To be able to extrapolate results obtained in a small animal such as a rodent, one needs to have proper knowledge of the rules governing how electrical properties of neurons scale with the size of the animal. Generally speaking, electrical resistances of neurons increase as cell size decreases, and thus maintenance of equal depolarization across cells of different sizes requires the underlying currents to decrease in proportion to the size decrease. Thus it would generally be expected that voltage-sensitive currents are smaller in smaller animals. In this study, we used in vivo preparations to record electrical properties of spinal motoneurons in deeply anesthetized adult mice and cats. We found that PICs do not scale with size, but instead are constant in their amplitudes across these species. This constancy, coupled with the threefold differences in electrical resistances, means that PICs contribute a threefold larger depolarization in the mouse than in the cat. As a consequence, motoneuronal firing rate sharply increases as animal size decreases. These differences in firing rates are likely essential in allowing different species to control muscles with widely different contraction speeds (smaller animals have faster muscle fibers). Thus from our results we have identified a possible new mechanism for how electrical properties are tuned to match mechanical properties within the motor output system.NEW & NOTEWORTHY The small size of the mouse warrants concern over whether the properties of their neurons are a scaled version of those in larger animals or instead have unique features. Comparison of spinal motoneurons in mice to cats showed unique features. Firing rates in the mouse were much higher, in large part due to relatively larger persistent inward currents. These differences likely reflect adaptations for controlling much faster muscle fibers in mouse than cat.

Keywords: adult spinal motoneurons; electrical properties; persistent inward currents; voltage clamp.


Figures

Fig. 1.
Fig. 1.
Examples of current-voltage (I-V) and frequency-current (f-I) relationships in adult motoneurons. A1 and B1: raw current traces from 2 mouse motoneurons, recorded in response to voltage ramps at 5 mV/s. A2 and B2: overlay of I-V relationships. Ascending ramp is represented by black lines, descending ramp by gray lines, and leak current by dashed lines. A3 and B3: leak-subtracted I-V relationship. PIC amplitude is measured between dashed lines. A4 and B4: responses to triangular current ramps. Horizontal black bars at top indicate the regions that are enlarged in A5 and B5. A5 and B5: closer look at subprimary range. Arrows point to subthreshold oscillations. A6 and B6: f-I relationship. Ascending ramp is represented by black lines and descending ramp by gray lines; dashed line corresponds to the slope of the primary range (shown on ascending ramp only). C and D show examples of I-V and f-I relationships in 2 adult cat motoneurons. C1 and D1: overlay of I-V relationships. Ascending ramp is represented by black lines, descending ramp by gray lines, and leak current by dashed lines. C2 and D2: leak-subtracted I-V relationship. Amplitude is measured between dashed lines. C3 and D3: responses to triangular current ramps, with ramp sizes varied between 10 and 30 nA. C4 and D4: f-I relationship. Ascending ramp is represented by black lines and descending ramp by gray lines; dashed line corresponds to the slope of the primary range (shown on ascending ramp only).
Fig. 2.
Fig. 2.
PIC amplitude scale with input conductance (Gin). A: comparison of input conductances between mouse and cat lumbar motoneurons (*P < 0.0001). The box upper and lower limits are the 75th and 25th quartiles, respectively. Each box is divided by the median. The whiskers extend all the way to the highest and lowest data points. B: comparison of PIC amplitudes in mouse (squares) and cat (circles) motoneurons. On both ascending and descending voltage ramps, PIC amplitudes were not significantly different between mouse and cat motoneurons. Box plot definitions are the same as in A. C: PIC amplitude (ascending ramp) vs. Gin (R2 = 0.20, P = 0.0131) in mouse motoneurons. D: PIC amplitude (descending ramp) vs. Gin (R2 = 0.15, P = 0.0339) in mouse motoneurons. E: PIC amplitude (ascending ramp) vs. Gin (R2 = 0.16, P = 0.0079) in cat motoneurons. F: PIC amplitude (descending ramp) vs. Gin (R2 = 0.10, P = 0.0334) in cat motoneurons. Both mouse and cat motoneurons with larger input conductance tend to have larger PIC values in ascending as well as descending I-V relationships.
Fig. 3.
Fig. 3.
Cells that do not fire repetitively have smaller PICs. A: example I-V relationship of a cell that is not able to repetitively fire on a current step protocol. i, Voltage ramps, with acceleration at 5 mV/s. ii, Overlay of I–V relationship. Ascending ramp is represented by black lines, descending ramp by gray lines, and leak current by dashed lines. iii, Leak-subtracted I-V relationship. PIC amplitude is measured under the dashed line. iv, Triangular current ramp elicited no repetitive firing. v, Current step protocol elicited only 2 action potentials. B: comparison of Gin of cells that are able to repetitively fire (squares) and of cells that are not able to repetitively fire (diamond). Gin of cells that are not able to fire repetitively is significantly larger than that of cells that are able to fire repetitively (*P = 0.022). C: comparison of PIC amplitude, on both ascending and descending ramp, of cells that could repetitively fire with ones that could not. Cells that are able to fire repetitively had larger amplitudes than cells that could not, but this slight increase was not statistically significant. D: comparison of PIC amplitude normalized to Gin between cells that are able to repetitively fire (squares) and cells that are not able to repetitively fire (diamonds). In both ascending and descending ramps, normalized PIC amplitude are larger in cells that are able to repetitively fire (*P = 0.021 and *P = 0.036, respectively). Box plot definitions in B–D are the same as in Fig. 2.
Fig. 4.
Fig. 4.
Relationships between PICs and firing characteristics. A: I-V relationship overlay. Ascending ramp is represented by black lines, descending ramp by gray lines, and leak current by dashed lines. Current at PIC onset (I-PIC onset) is represented by a dash-dotted arrow and I-PIC max by a dotted arrow. B: f-I relationship of the same motoneuron recorded in A. Ascending ramp is represented by black lines and descending ramp by gray lines, dotted line indicates the limit between the subprimary (SPR) and primary range (PR), and dashed line represents the slope of the PR. The firing frequency at the transition between the SPR and PR is indicated with a dash-dotted arrow. C: recruitment current (Ion) vs. I-PIC onset (R2 = 0.24, P = 0.0083) in mouse motoneurons. Onset of recruitment on a current ramp had a significantly positive correlation with current at PIC onset. D: Ion vs. I-PIC onset (R2 = 0.58, P < 0.0001) in cat motoneurons. Onset of recruitment on a current ramp had a significantly positive correlation with current at PIC onset. E: derecruitment current (Ioff) vs. current at I-PIC offset (R2 = 0.09, P = 0.1184) in mouse motoneurons. Offset of recruitment on a current ramp did not have a significant correlation with current at PIC offset. F: Ioff vs. I-PIC offset (R2 = 0.46, P < 0.0001) in cat motoneurons. Offset of recruitment on a current ramp had a significant correlation with current at PIC offset. G: current where PR starts in a f-I relationship vs. I-PIC peak (R2 = 0.75, P < 0.0001). Current where SPR switches to PR showed a significantly positive correlation with current where PIC peaks. Note that some cells were not able to reach the primary range of firing, which is why there are fewer points in F than in C and E. H: current where PR starts in a f-I relationship vs. I-PIC peak (R2 = 0.64, P < 0.0001). Current where SPR switches to PR showed a significantly positive correlation with current where PIC peaks.
Fig. 5.
Fig. 5.
Relationship between PIC and hysteresis. A and B: PIC amplitude on the descending I-V ramp, normalized by input conductance (Gin) plotted against ΔI (IoffIon). The larger the PIC amplitude on the descending ramp, the more hysteresis shown in the f-I relationship in mouse motoneurons (A). This correlation did not reach statistical significance in cat motoneurons (B).
Fig. 6.
Fig. 6.
Comparisons between cat, rat, and mouse motoneurons. A: f-I gain in primary range (PR) is highest in mouse motoneurons (average = 10.62 ± 5.69 Hz/nA, n = 17), followed by that in rat (average = 4.7 ± 3.3 Hz/nA, n = 37; data provided by T. M. Hamm) and then cat motoneurons (average = 1.68 ± 0.47 Hz/nA, n = 24). All differences were statistically significant (Krusal-Wallis followed by Dunn’s post hoc test) as indicated by asterisks. B: f-I gain in PR plotted against Gin in mouse (squares), rat (diamonds), and cat (circles) motoneurons. C: PIC amplitude normalized by Gin is significantly larger (*P < 0.0001) in mouse (average = 5.82 ± 3.87 nA/μS, n = 30) compared with cat motoneurons (average = 2.64 ± 3.42 nA/μS, n = 44). Box plot definitions in A and C are the same as in Fig. 2.

Similar articles

Cited by

References

    1. Bennett DJ, Hultborn H, Fedirchuk B, Gorassini M. Short-term plasticity in hindlimb motoneurons of decerebrate cats. J Neurophysiol 80: 2038–2045, 1998a. - PubMed
    1. Bennett DJ, Hultborn H, Fedirchuk B, Gorassini M. Synaptic activation of plateaus in hindlimb motoneurons of decerebrate cats. J Neurophysiol 80: 2023–2037, 1998b. - PubMed
    1. Bennett DJ, Li Y, Siu M. Plateau potentials in sacrocaudal motoneurons of chronic spinal rats, recorded in vitro. J Neurophysiol 86: 1955–1971, 2001. - PubMed
    1. Burke R.. Motor units: anatomy, physiology, and functional organization. In: Handbook of Physiology. The Nervous System. Motor Control. Bethesda, MD: American Physiological Society, 1981, p. 345–421.
    1. Button DC, Gardiner K, Marqueste T, Gardiner PF. Frequency-current relationships of rat hindlimb alpha-motoneurones. J Physiol 573: 663–677, 2006. doi:10.1113/jphysiol.2006.107292. - DOI - PMC - PubMed

Publication types

LinkOut - more resources