. 2017 Mar 29;9(383):eaag1166.
doi: 10.1126/scitranslmed.aag1166.

The druggable genome and support for target identification and validation in drug development

Affiliations

The druggable genome and support for target identification and validation in drug development

Chris Finan et al. Sci Transl Med. .

Abstract

Target identification (determining the correct drug targets for a disease) and target validation (demonstrating an effect of target perturbation on disease biomarkers and disease end points) are important steps in drug development. Clinically relevant associations of variants in genes encoding drug targets model the effect of modifying the same targets pharmacologically. To delineate drug development (including repurposing) opportunities arising from this paradigm, we connected complex disease- and biomarker-associated loci from genome-wide association studies to an updated set of genes encoding druggable human proteins, to agents with bioactivity against these targets, and, where there were licensed drugs, to clinical indications. We used this set of genes to inform the design of a new genotyping array, which will enable association studies of druggable genes for drug target selection and validation in human disease.


Conflict of interest statement

Competing interests: The authors declare that they have no competing interests.

Figures

Fig. 1
Fig. 1
Overlap between targets on the DrugDev array and three previously published sets. The Venn diagram shows the overlap of targets on the DrugDev array with the union (circle composed of blue, purple, gray, and turquoise segments), as well as the intersection (circle composed of gray, and turquoise segments) of the druggable gene sets defined by Hopkins and Groom (28), Russ and Lampel (29), and Kumar (30).
Fig. 2
Fig. 2
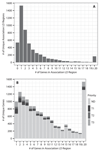
LD region summary. A shows the numbers of unique GWAS significant associations (p≤5×10⁻⁸) in the GWAS catalog that have 0 or more genes in their LD regions. Note that there are 299 associations that had no LD region or were not present in the 1000 genomes, which are not shown in this figure. B shows the number of unique genes that occupy LD regions with at least 1 gene. The counts are partitioned into genes that are not predicted (ND) to be druggable or the various druggable tiers (T1: Tier 1, T2: Tier2, T3: Tier 3A and Tier 3B combined)
Fig. 3
Fig. 3
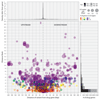
Proximity and distance rank of druggable genes to GWAS SNPs. Each point in the scatterplot corresponds to a GWAS signal located in an interval containing a druggable gene. The position on the x-axis indicates the distance of the SNP from the druggable gene. Position in the y-axis indicates the number of genes in the same interval that are closer to the signal than the druggable gene. The top panel indicates the signal density for all such SNPs, and the side panel provides the counts of signals by the distance rank of the druggable gene divided by Tier.
Fig. 4
Fig. 4
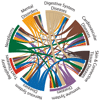
Potential repurposing opportunities from the discordant GWAS phenotype/drug indication matches. The disease categories on the circumference are MeSH root disease terms. The directional chords represent a connection from an indication class of drug to a GWAS phenotype. This connection is determined by a drug target gene occurring within 50 kbp of a GWAS association (a fixed distance was used to reduce the possibility of discordance due to confounding by linkage disequilibrium). The width of the chords is proportional to the number of genes connecting two therapeutic classes.
Fig. 5
Fig. 5
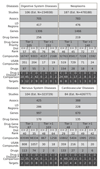
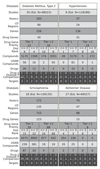
Translational potential for the top 4 most studied MeSH root disease areas. For each disease area, the figure illustrates the estimated number of GWAS (Studies Row), the number of associations (p≤5×10⁻⁸) (Assocs), the number of LD regions corresponding to those associations (LD Regions), the number of genes in those regions (Genes), and the number of those genes that encode druggable targets (Drug Genes). Subsequent rows quantify the number of druggable genes by priority tier (Drug Gene Priority) and by distance rank of the druggable gene from the GWAS SNP (Dist Rank). The total numbers of compounds (Compounds), compounds with an USAN/INN (USAN Compounds), and drugs corresponding to the drugged targets are also listed (Drugs). In the penultimate row, the numbers of drugs with an indication that is concordant (C) or discordant (D) with the GWAS phenotype are displayed (Drug I/Disease P Comparison). In the final row, the numbers of cognate targets for the concordant or discordant drugs are shown (Targets). Note that for the purposes of the figure, a drug target is a single gene even if it is part of a complex that is targeted by the drug. Within each cell, the values represent the number of unique entities, for example the cells in the Assocs row represent the number of unique associations (rsids). However, some values can be replicated across the figure because a GWAS study may have researched several of the disease areas. Additionally, there is some non-additivity between consecutive rows, namely Druggable Gene Priority (Drug Gene Priority) - Distance Rank (Dist Rank) and Drugs - Drug indication/Disease Phenotypes Comparison (Drug I/Disease P Comparison). In the case of the former, this is due to the same gene being further away from the associated variant in different studies, such that it falls into a different partition. For the latter, this is due to missing indications for some of the drugs, such that concordance or discordance could not be assigned. The estimated number of samples (Est. N) is the sum of all the cases involved in the respective studies.
Fig. 6
Fig. 6
Translational potential for 4 specific diseases. Refer to Fig. 5 legend for detailed explanation.
Fig. 7
Fig. 7
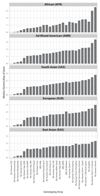
Tagged coverage of druggable genes in the 1000 genomes super populations. Coverage of the druggable gene set is represented as the median number of directly typed variants and variants in LD of r2 ≥ 0.8 (tagged) per kbp of druggable gene sequence.
Fig. 8
Fig. 8
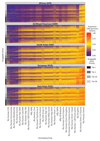
Tagged coverage of druggable genes in the 1000 genomes super populations. Coverage of the druggable gene set is represented as a proportion of 1000 genomes phase 3 variants (bi-allelic with maf ≥ 0.005) that are either directly typed or in LD with r2 ≥ 0.8 (tagged). Each column represents a genotyping array and each row a druggable gene. The druggable genes are grouped according to their druggability tier, which is indicated by the bar at the left side of each plot. To aid visualization, the druggable genes are further sorted within each tier on their median coverage across all the arrays, and the genotyping arrays are sorted based on their median coverage of the druggable genome across all the 1000 genomes super populations. Note that all of the arrays contained some content that could not be mapped to the 1000 genomes phase 3 (see fig. S10). Note also that when deployed in real datasets, additional variation could be captured by all arrays through imputation.

Similar articles

Cited by

References

    1. Munos B. Lessons from 60 years of pharmaceutical innovation. Nat Rev Drug Discov. 2009;8:959–968. - PubMed
    1. Paul SM, Mytelka DS, Dunwiddie CT, Persinger CC, Munos BH, Lindborg SR, Schacht AL. How to improve R&D productivity: the pharmaceutical industry’s grand challenge. Nat Rev Drug Discov. 2010;9:203–214. - PubMed
    1. Macleod MR, Lawson McLean A, Kyriakopoulou A, Serghiou S, de Wilde A, Sherratt N, Hirst T, Hemblade R, Bahor Z, Nunes-Fonseca C, Potluru A, et al. Sena, Risk of Bias in Reports of In Vivo Research: A Focus for Improvement. PLoS Biol. 2015;13:e1002273. - PMC - PubMed
    1. Perel P, Roberts I, Sena E, Wheble P, Briscoe C, Sandercock P, Macleod M, Mignini LE, Jayaram P, Khan KS. Comparison of treatment effects between animal experiments and clinical trials: systematic review. BMJ. 2007;334:197. - PMC - PubMed
    1. van der Worp HB, Howells DW, Sena ES, Porritt MJ, Rewell S, O’Collins V, Macleod MR. Can Animal Models of Disease Reliably Inform Human Studies? PLoS Med. 2010;7:e1000245. - PMC - PubMed