. 2017 Apr 11;114(15):E3110-E3118.
doi: 10.1073/pnas.1619302114. Epub 2017 Mar 29.

Efficacy, long-term toxicity, and mechanistic studies of gold nanorods photothermal therapy of cancer in xenograft mice

Affiliations

Efficacy, long-term toxicity, and mechanistic studies of gold nanorods photothermal therapy of cancer in xenograft mice

Moustafa R K Ali et al. Proc Natl Acad Sci U S A. .

Abstract

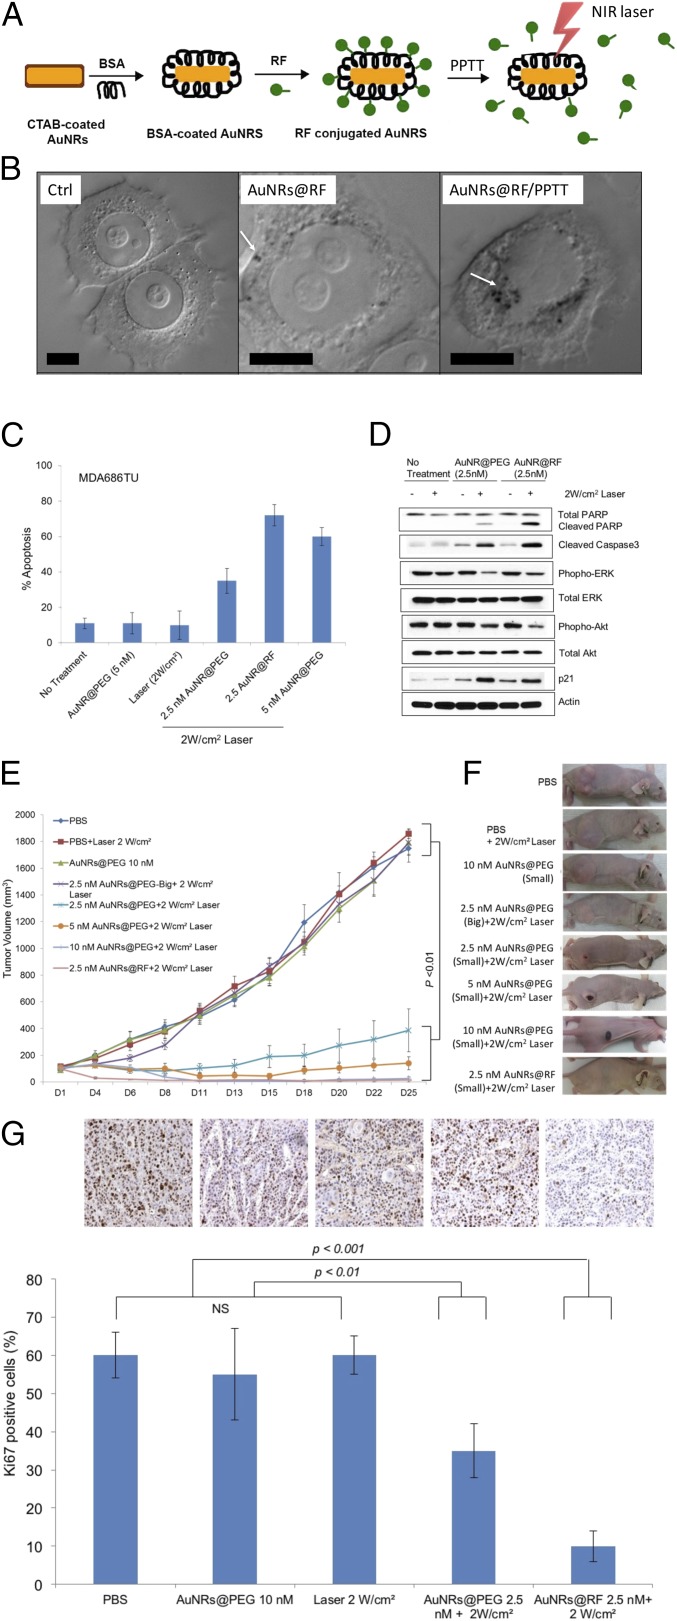
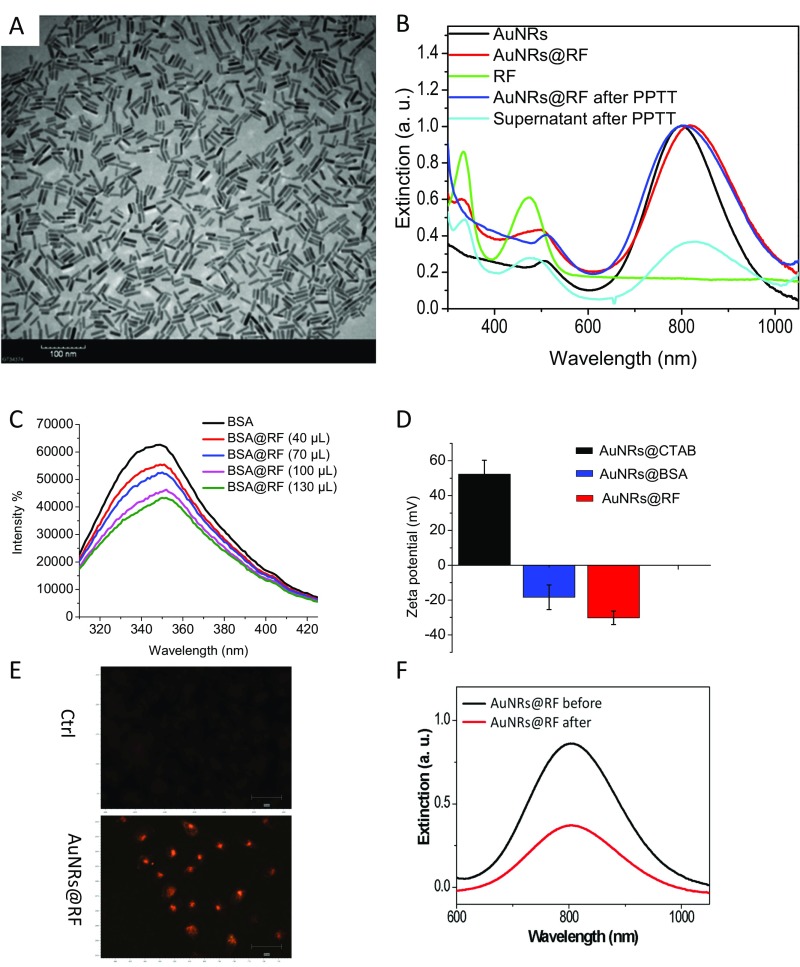
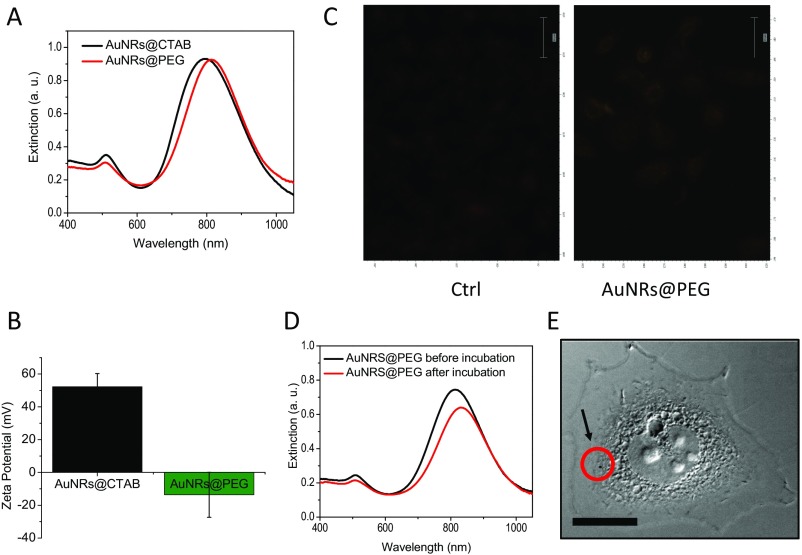
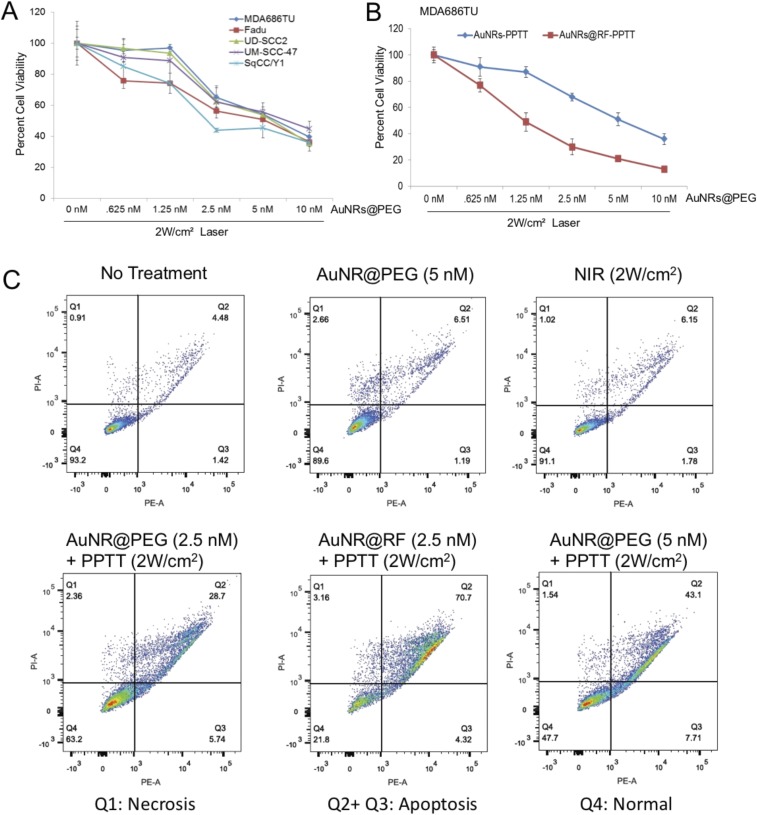
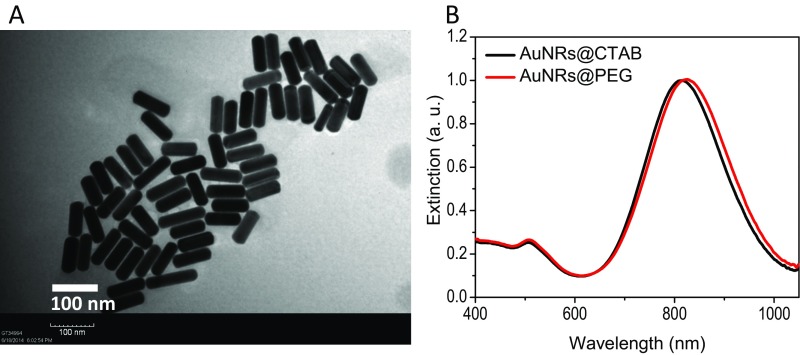
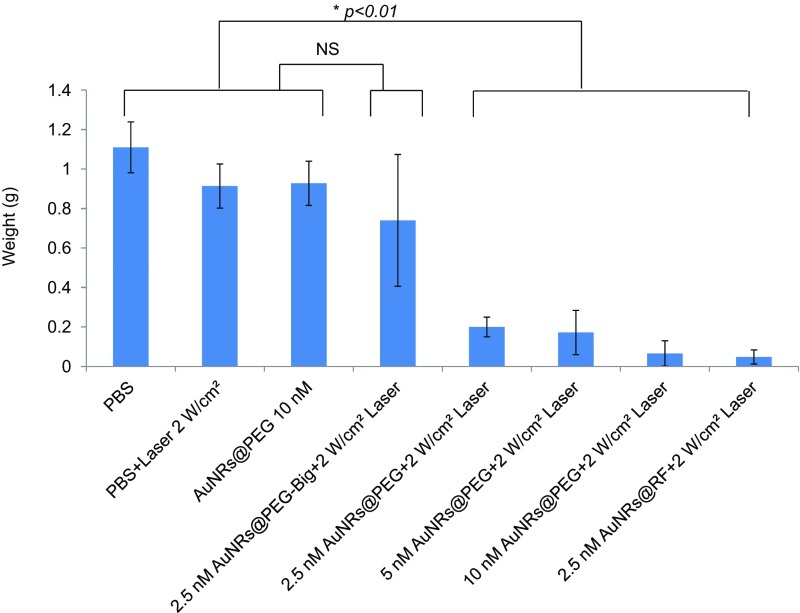
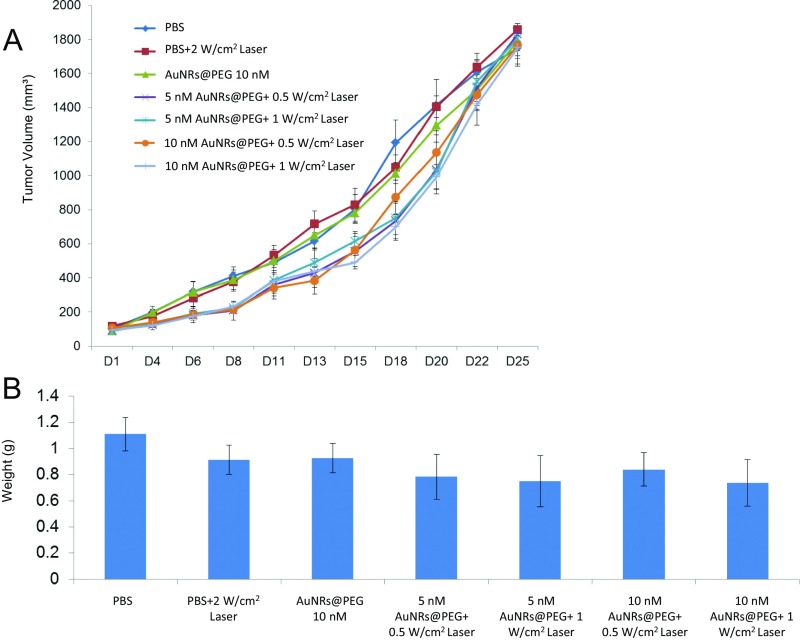
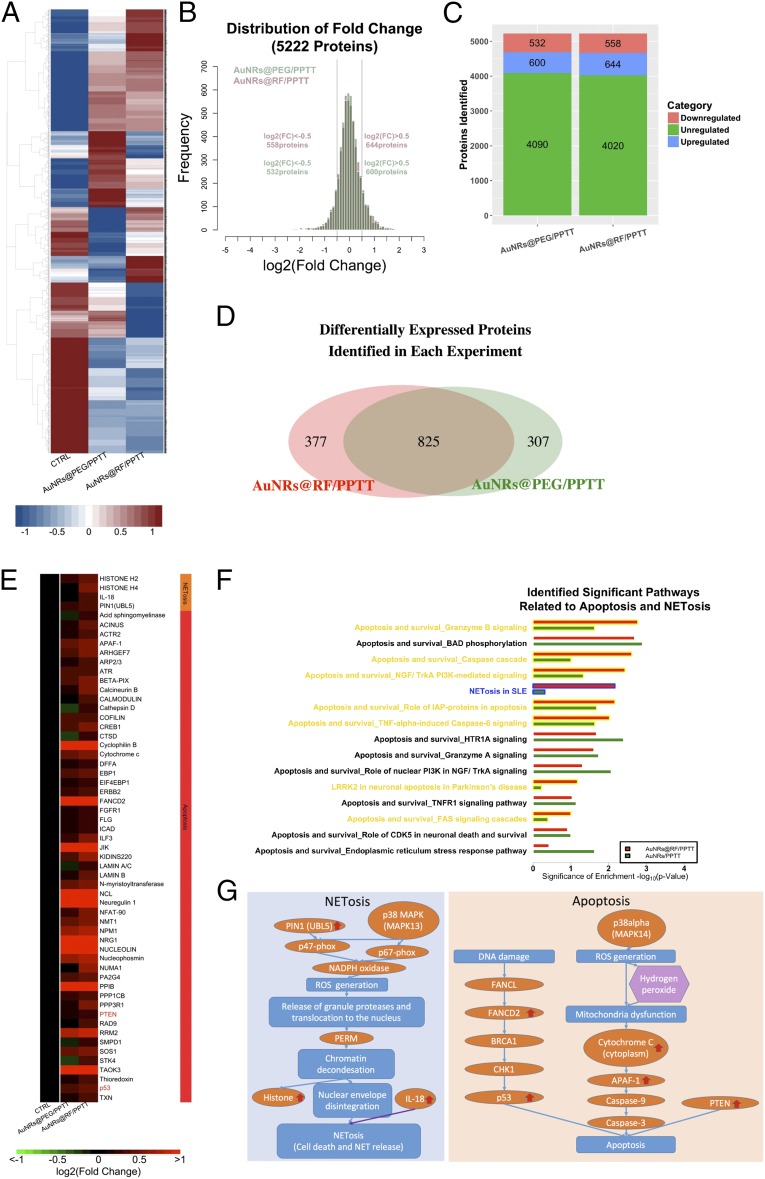
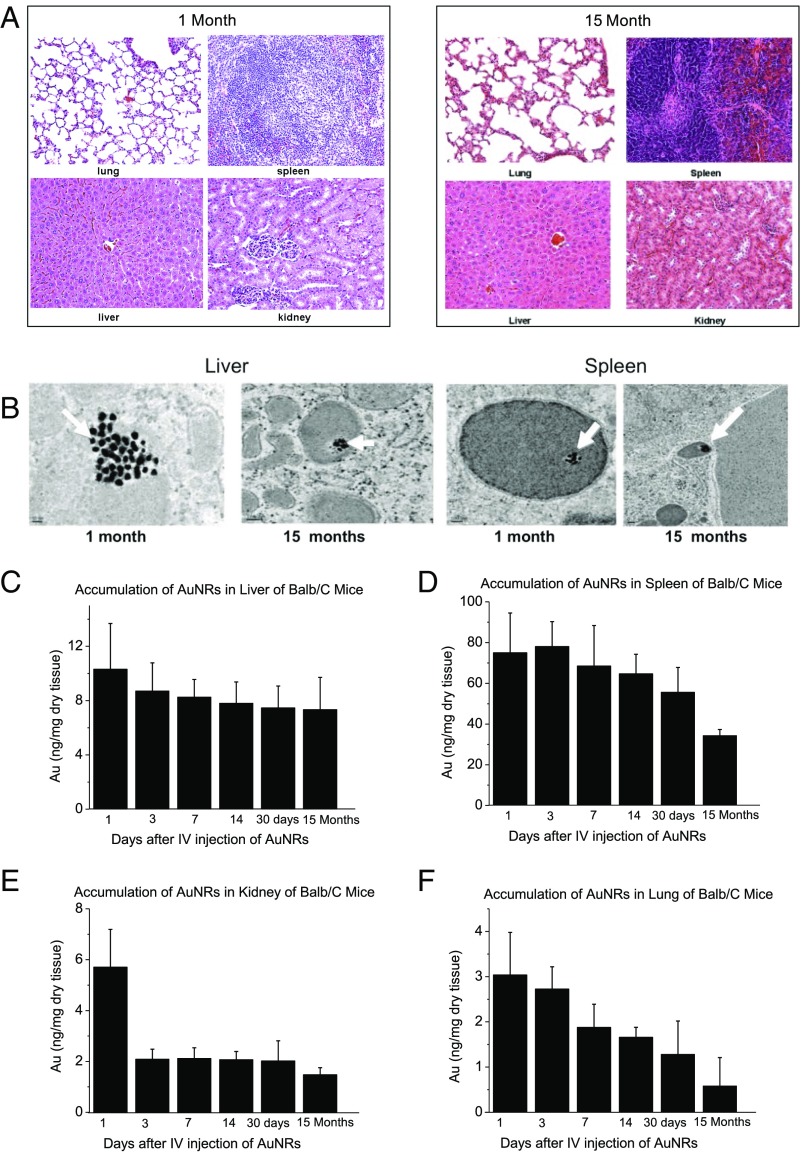
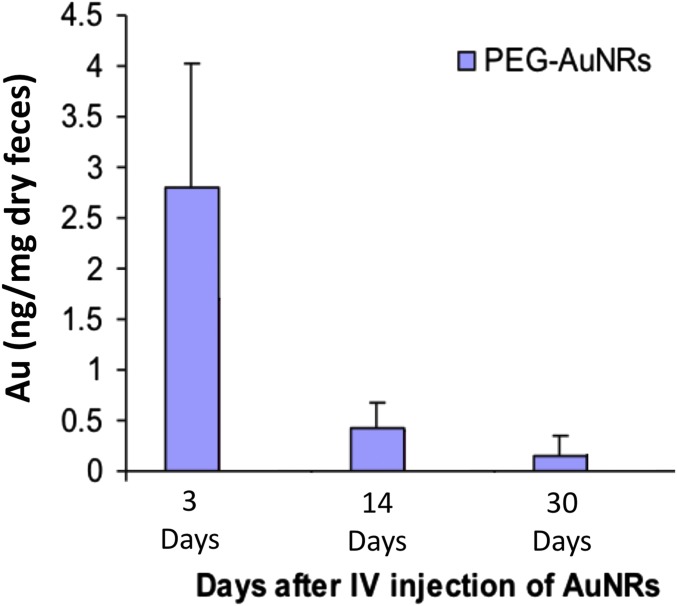
Gold nanorods (AuNRs)-assisted plasmonic photothermal therapy (AuNRs-PPTT) is a promising strategy for combating cancer in which AuNRs absorb near-infrared light and convert it into heat, causing cell death mainly by apoptosis and/or necrosis. Developing a valid PPTT that induces cancer cell apoptosis and avoids necrosis in vivo and exploring its molecular mechanism of action is of great importance. Furthermore, assessment of the long-term fate of the AuNRs after treatment is critical for clinical use. We first optimized the size, surface modification [rifampicin (RF) conjugation], and concentration (2.5 nM) of AuNRs and the PPTT laser power (2 W/cm2) to achieve maximal induction of apoptosis. Second, we studied the potential mechanism of action of AuNRs-PPTT using quantitative proteomic analysis in mouse tumor tissues. Several death pathways were identified, mainly involving apoptosis and cell death by releasing neutrophil extracellular traps (NETs) (NETosis), which were more obvious upon PPTT using RF-conjugated AuNRs (AuNRs@RF) than with polyethylene glycol thiol-conjugated AuNRs. Cytochrome c and p53-related apoptosis mechanisms were identified as contributing to the enhanced effect of PPTT with AuNRs@RF. Furthermore, Pin1 and IL18-related signaling contributed to the observed perturbation of the NETosis pathway by PPTT with AuNRs@RF. Third, we report a 15-month toxicity study that showed no long-term toxicity of AuNRs in vivo. Together, these data demonstrate that our AuNRs-PPTT platform is effective and safe for cancer therapy in mouse models. These findings provide a strong framework for the translation of PPTT to the clinic.

Keywords: apoptosis; gold nanorods; long-term toxicity; plasmonic photothermal therapy; xenograft mice.


Conflict of interest statement

The authors declare no conflict of interest.

Figures

Fig. 1.
Fig. 1.
Efficacy of AuNRs@RF in vivo and in vitro. (A) Schematic showing the characterization and conjugation of AuNRs@Rifampicin and the release of surface ligands after PPTT. (B) DIC images of optical sectioning of control sample (without nanoparticles), cells incubated with AuNRs@RF, and cells after PPTT. White arrows indicate AuNRs aggregates. (Scale bars, 10 µm.) (C) Comparative apoptosis analysis in MDA686TU HNSCC cells treated with AuNRs or AuNRs@RF and PPTT after 72h (error bars are mean ± SD, n = 3). (D) Western blotting for the indicated proteins in MDA686TU HNSCC cell line after treatment with AuNRs@PEG-PPTT and AuNRs@RF-PPTT. A representative blot of three independent experiments is presented. (E) MDA686TU HNSCC tumor xenograft growth (tumor volume = 0.5×l×w2) progression in groups: PBS, 2 W/cm2 laser, 10 nM small AuNRs@PEG as control groups; 5 nM, 10 nM small AuNRs@PEG with 2W/cm2 laser; 2.5 nM small and large AuNR@PEG with 2 W/cm2 laser; 2.5 nM AuNRs@RF with 2 W/cm2 laser. First and only dose was given on day 1 (tumor volume ∼70 mm3) and tumor growth was monitored until day 25 (endpoint of tumor volume 1,800 mm3) (error bars are mean ± SEM, n = 5). Statistical analysis (t test) between control groups (PBS, laser, and AuNRs@PEG) vs. treated groups (2.5, 5, and 10 nM AuNRs@PEG-PPTT, 2.5 nM AuNRs@RF-PPTT) was P < 0.01. (F) Representative mouse from each of the indicated groups presented. (G) Ki-67 expression detected in xenograft tissue by IHC analysis. Representative images shown from indicated groups (brown stain for Ki-67 and nuclei were counterstained by hematoxylin, blue; magnification ×200). For comparison with other studies, 5 nM = 1 OD for small AuNRs (35).
Fig. S1.
Fig. S1.
Characterization and TU686 cell uptake of RF-conjugated AuNRs@RF. (A) TEM image of conjugated nanorods (AuNRs). (Scale bar, 100 nm.) (B) UV-vis absorption spectra of the as-synthesized AuNRs (black line), BSA and RF conjugated AuNRs@RF (red line), free RF in solution (green line), AuNRs after PPTT (blue), and the supernatant after PPTT (cyan). (C) BSA fluorescent emission quenching of BSA (10−4 M) after adding various amounts of RF (10−4 M) from 0 to 130 μL. (D) Zeta potential of AuNRs with different surface ligands: CTAB, BSA, and BSA + RF. (E) Dark-field microscopic imaging showing TU686 cellular uptake of 2.5 nM AuNRs@RF after 24-h incubation. (Scale bar, 50 μm.) (F) UV-vis absorption spectra of the nanoparticle–media mixture before and after cell culture. For comparison with other studies, 5 nM = 1 OD for small AuNRs (35).
Fig. S2.
Fig. S2.
Three-dimensional reconstruction of AuNRs@RF inside cells. Z-stacks were acquired using the multidimensional acquisition function in Micro-Manager. More specifically, the DIC optical sectioning through the whole cell thickness was achieved by moving the objective on the motorized nosepiece using PFS at 65 nm per step at 33 ms (30 frames per s) of AuNRs@RF inside cells. (A) Cells incubated with AuNRs@RF. (B) Cells after PPTT. For more details, see Movies S1 and S2.
Fig. S3.
Fig. S3.
Characterization of AuNRs@PEG (25 × 5.5 nm). (A) UV-Vis spectra showing the surface plasmon peaks of as-synthesized AuNRs and the red-shifted peak of PEGylated AuNRs. (B) Zeta potential of AuNRs@CTAB (black) and AuNRs@PEG (green). (C) Dark-field images of cells with and without 2.5 nM AuNRs@PEG incubation for 24 h. (Scale bar, 50 μm.) (D) UV-Vis spectra showing the intensities of AuNRs plasmon peaks before and after incubation with cells. (E) DIC images of cells incubated with 2.5 nM AuNRs@PEG. The red circle and black arrow indicate a nanoparticle aggregate inside the cell. (Scale bar, 10 µm.) For comparison with other studies, 5 nM = 1 OD for small AuNRs (35).
Fig. S4.
Fig. S4.
AuNRs-PPTT efficiently inhibits cell viability and induces apoptosis (in vitro). (A) Cell viabilities of five HNSCC cell lines under treatment with various concentrations of small AuNR for 2 h followed by 2 W/cm2 NIR laser power for 2 min. Seventy-two hours after laser treatment, cell viability was analyzed by SRB assay. The percentage of cell viability was then calculated based on the absorbance values relative to the nontreated samples. Error bars are mean ± SD from three independent experiments. (B) Cell viability analysis as above of MDA686TU cells 72 h after treatment with AuNRs@PEG-PPTT and AuNRs@RF-PPTT (error bars are mean ± SD from three independent experiments). (C) Apoptosis/necrosis assay of cells treated with PPTT under different conditions. Q1, necrosis cells; Q2+Q3, apoptosis cells; and Q4, normal cells. For comparison with other studies, 5 nM = 1 OD for small AuNRs (35).
Fig. S5.
Fig. S5.
Characterization of large AuNRs with size of 72 (± 7) nm × 16 (± 4) nm. (A) TEM image. (B) UV-Vis absorption spectra of AuNRs before and after PEG conjugation.
Fig. S6.
Fig. S6.
Tumor weight of treated mice. Mice were killed, tumors were collected from each treatment group on day 25, and tumors were weighed (error bars are mean ± SD, n = 5). Statistical analysis (t test) shows that the difference between control (PBS, laser, and AuNRs@PEG) vs. the big AuNRs@PEG-treated group was not significant (NS), whereas control (PBS, laser, and AuNRs@PEG) vs. other treated groups was *P < 0.01. For comparison with other studies, 5 nM = 1 OD for small AuNRs (35).
Fig. S7.
Fig. S7.
Lower power of laser with AuNRs is unable to reduce tumor growth in a MDA686TU xenograft model. (A) Tumor growth (tumor volume = 0.5×l×w2) progression in groups: PBS, 2 W/cm2 laser, 10 nM small AuNRs as control groups; 5 nM, 10 nM small AuNRs with 0.5 and 1 W/cm2 laser. First dose was given on day 1 (tumor volume ∼100 mm3) and tumor growth was monitored until day 25 (endpoint of tumor volume 1,800 mm3) (error bars are mean ± SE, n = 5). (B) Mice were killed, tumors were collected from each treatment group on day 25, and tumors were weighed (error bars are mean ± SD, n = 5). For comparison with other studies, 5 nM = 1 OD for small AuNRs (35).
Fig. 2.
Fig. 2.
Quantitative proteomics. (A) Comprehensive heat map showing the proteome perturbed by AuNRs@PEG-PPTT and AuNRs@RF-PPTT compared with control group. (B) Distribution of fold changes in proteins perturbed by AuNRs@PEG-PPTT and AuNRs@RF-PPTT compared with control group. (C) Bar graph showing numbers of proteins unregulated, increased, and decreased in each group. (D) Venn diagram showing the differentially expressed proteins identified in each group. (E) Heat map for proteins related to apoptosis and NETosis contributing to the better efficacy of AuNRs@RF-PPTT compared with AuNRs@PEG-PPTT. The values of protein fold change are listed in Dataset S1. (F) Identified significant pathways related to apoptosis and NETosis. (G) Simplified pathway map of NETosis and apoptosis.
Fig. 3.
Fig. 3.
Effect of AuNRs on organ toxicity and accumulation. (A) Histopathological images of the liver, spleen, kidney, and lung of BALB/c mice at different time points after i.v. injection of a single dose of AuNRs (Au: 0.18 mg/kg, three mice per group). (B) TEM images at two time points AuNRs (Au: 0.18 mg/kg, three mice per group); 10,000 PEG/AuNR (indicated by arrow) were found in the liver and spleen without morphology changes (up to 15 months) when treated with 25-nm-length AuNRs. (CF) Accumulation of AuNRs in different organs over 15 months. Au concentrations are shown in the liver (C), spleen (D), kidney (E), and lung (F) of BALB/c mice at different time points after i.v. injection of a single dose of AuNRs (Au: 0.18 mg/kg, three mice per group) (error bars are mean ± SEM).
Fig. S8.
Fig. S8.
Excretion of AuNRs in mice feces (Au 0.18 mg/kg, three mice per group).

Similar articles

Cited by

References

    1. Huang X, El-Sayed IH, Qian W, El-Sayed MA. Cancer cell imaging and photothermal therapy in the near-infrared region by using gold nanorods. J Am Chem Soc. 2006;128(6):2115–2120. - PubMed
    1. Dickerson EB, et al. Gold nanorod assisted near-infrared plasmonic photothermal therapy (PPTT) of squamous cell carcinoma in mice. Cancer Lett. 2008;269(1):57–66. - PMC - PubMed
    1. Hirsch LR, et al. Nanoshell-mediated near-infrared thermal therapy of tumors under magnetic resonance guidance. Proc Natl Acad Sci USA. 2003;100(23):13549–13554. - PMC - PubMed
    1. Abadeer NS, Murphy CJ. Recent progress in cancer thermal therapy using gold nanoparticles. J Phys Chem C. 2016;120(9):4691–4716.
    1. Steinmetz NF. Review of “Cancer Nanotechnology: Methods and Protocols (Methods in Molecular Biology)” by Stephen R. Grobmyer (Editor), Brij M. Moudgil (Editor) BioMedical Engineering OnLine. 2010;9:55.

Publication types

MeSH terms