. 2016 Dec;24(4):561-575.
doi: 10.1142/S0218339016500285. Epub 2016 Dec 7.

BIOPHYSICAL PROPERTIES OF SUBTHRESHOLD RESONANCE OSCILLATIONS AND SUBTHRESHOLD MEMBRANE OSCILLATIONS IN NEURONS

Affiliations

BIOPHYSICAL PROPERTIES OF SUBTHRESHOLD RESONANCE OSCILLATIONS AND SUBTHRESHOLD MEMBRANE OSCILLATIONS IN NEURONS

Babak V-Ghaffari et al. J Biol Syst. 2016 Dec.

Abstract

Subthreshold-level activities in neurons play a crucial role in neuronal oscillations. These small-amplitude oscillations have been suggested to be involved in synaptic plasticity and in determining the frequency of network oscillations. Subthreshold membrane oscillations (STOs) and subthreshold resonance oscillations (SROs) are the main constituents of subthreshold-level activities in neurons. In this study, a general theoretical framework for analyzing the mechanisms underlying STOs and SROs in neurons is presented. Results showed that the resting membrane potential and the hyperpolarization-activated potassium channel (h-channel) affect the subthreshold-level activities in stellate cells. The contribution of h-channel on resonance is attributed to its large time constant, which produces the time lag between Ih and the membrane potential. Conversely, the persistent sodium channels (Nap-channels) only play an amplifying role in these neurons.

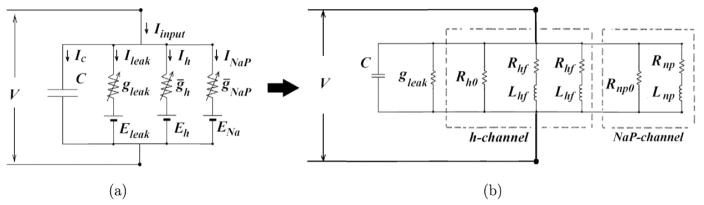
Keywords: Biophysical Model; Conductance-Based Model; Equivalent RLC Circuit; Stellate Cells; Subthreshold Membrane Oscillation; Subthreshold Resonance Oscillation.


Conflict of interest statement

Conflict of Interests The authors declare that there is no conflict of interests regarding the publication of this paper

Figures

Fig. 1
Fig. 1
Biophysical model and its equivalent RLC circuit model for SCs. (a) The biophysical model of SCs is a single compartmental neuronal model with h and NaP channels. V and C are the membrane potential and capacitance, respectively. gleak, gh and gNaP are the maximal conductances for leak, h and NaP channels, respectively. EL is the reversal potential. Eh and ENa are equilibrium potentials for h and NaP channels, respectively. Iinp is the synaptic input current. (b) The equivalent RLC electrical circuit model of SCs. The values of resistance and inductance elements for control condition are given in our previous work.
Fig. 2
Fig. 2
Comparison between the biophysical model and its equivalent RLC circuit model for SCs. The voltage response (a) and impedance profile (amplitude (b) and phase profile (c)) of biophysical model are similar to the voltage response (d) and impedance profile (amplitude (e) and phase profile (f)) of equivalent RLC circuit model. The results obtained under the control condition.
Fig. 3
Fig. 3
The effect of changing resting membrane potential in the resonant properties of biophysical model of SCs. (a) The voltage response for resting membrane potential at the control condition (upper trace), V = −65mV, and hyperpolarized value (lower trace), V = −70mV. (b) Three-dimensional plot of impedance amplitude profile (|Z|) at different resting membrane potentials. (c) Resonance frequency plotted as a function of membrane potential. (d) Q-values (strength of resonance) plotted as a function of membrane potential. For Q = 1, there is no resonance in model.
Fig. 4
Fig. 4
The effect of h-channel on impedance profile of the equivalent RLC circuit model of SCs. (a) The impedance amplitude profile shows that increasing of gh reduces the amplitude of fres. (b) The impedance phase profiles show that decreasing of gh reduces the zero-cross frequency (the frequency in which the φ(f) crosses over zero). (c) The total inductive phase (φL) in response to changing of gh. (d) The total inductive phase (φL) in response to the changing of resting membrane potential.
Fig. 5
Fig. 5
The evolution of SCs dynamics in response to the sinusoidal current. (a) The evolutions of INaP and Ih during STO. Noted that INaP closely follow the evolution of membrane potential. In contrast, Ih lags the membrane potential. The Increase and decrease in Ih correspond to minimum and maximum peaks of the membrane potential, respectively. The phase-plane of the amplitude of Ih (b) and INaP (c) versus the membrane potential. the plot corresponding to INaP, demonstrates a straight line. Therefore, the amplitude of INaP changes spontaneously. Plot corresponding to Ih shows the hysteresis. It means, during the downswing and upswing of STO, the amplitude of Ih changes with a significant delay.

References

    1. Narayanan R, Johnston D. The h channel mediates location dependence and plasticity of intrinsic phase response in rat hippocampal neurons. J Neurosci. 2008;28(22):5846–5860. - PMC - PubMed
    1. Acker CD, Kopell N, White JA. Synchronization of strongly coupled excitatory neurons: Relating network behavior to biophysics. J Comput Neurosci. 2003;15(1):71–90. - PubMed
    1. Wang X-J. Pacemaker neurons for the theta rhythm and their synchronization in the septohippocampalreciprocal loop. J Neurophysiol. 2002;87(2):889–900. - PubMed
    1. Gray CM, Konig P, Engel AK, Singer W. Oscillatory responses in cat visual cortex exhibit inter-columnar synchronization which reflects global stimulus properties. Nature. 1989;338(6213):334–337. - PubMed
    1. Buzsaki G. Two-stage model of memory trace formation: A role for ‘noisy’ brain states. Neuroscience. 1989;31(3):551–570. - PubMed

LinkOut - more resources