

The anti-inflammatory compound palmitoylethanolamide inhibits prostaglandin and hydroxyeicosatetraenoic acid production by a macrophage cell line
- PMID: 28357126
- PMCID: PMC5368964
- DOI: 10.1002/prp2.300
The anti-inflammatory compound palmitoylethanolamide inhibits prostaglandin and hydroxyeicosatetraenoic acid production by a macrophage cell line
Abstract
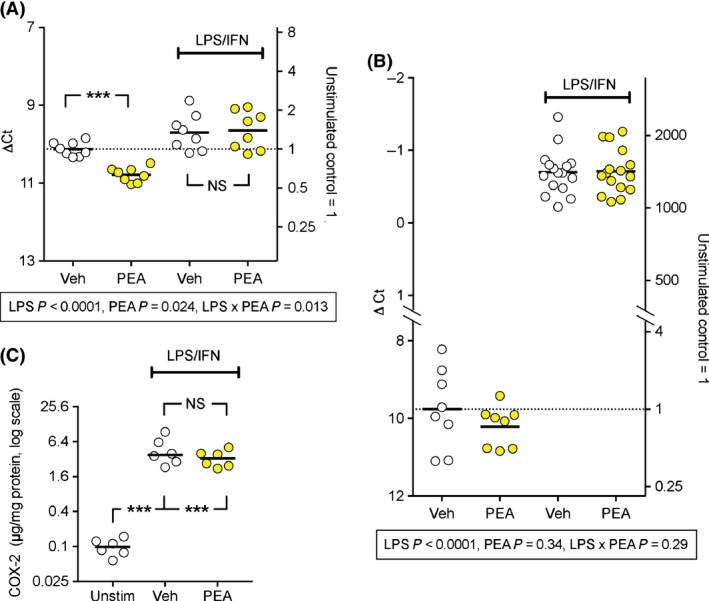
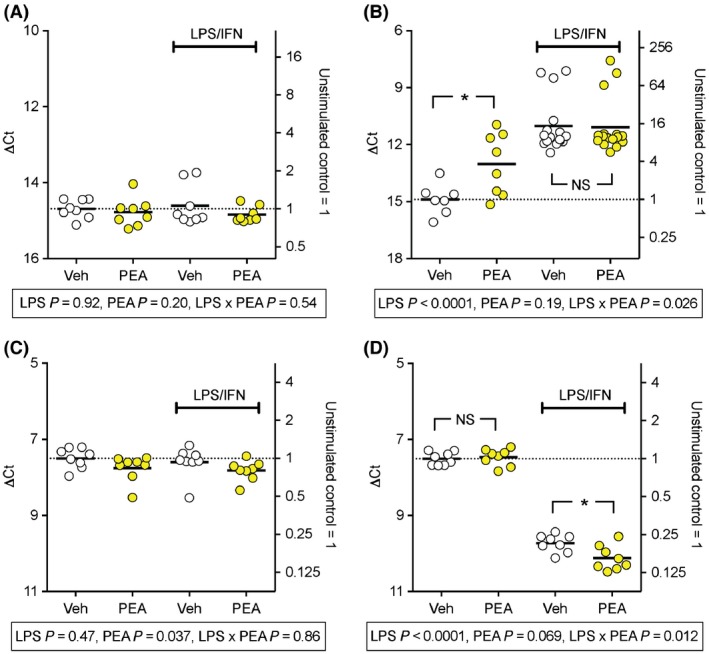
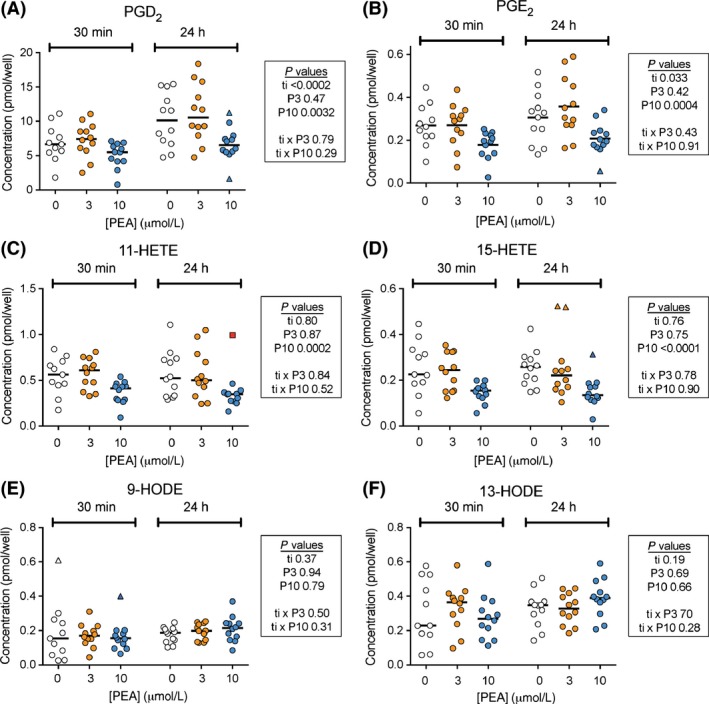
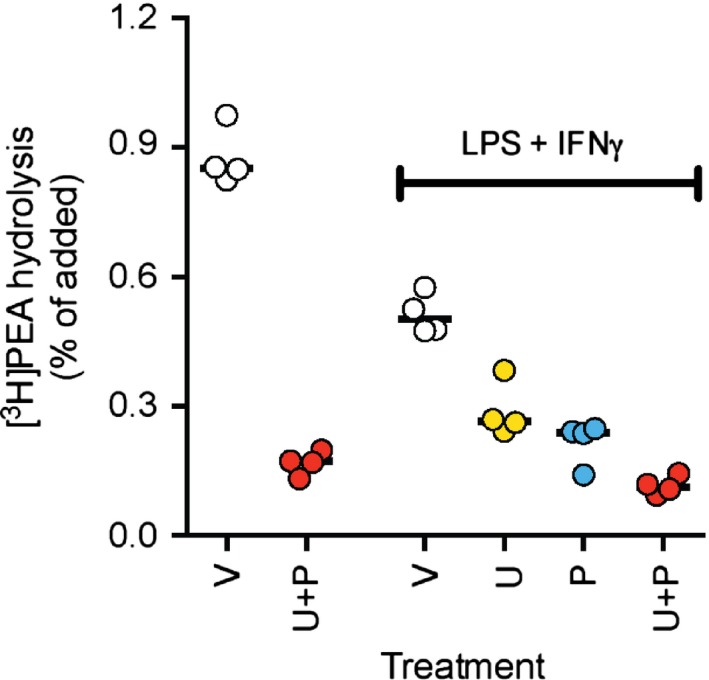
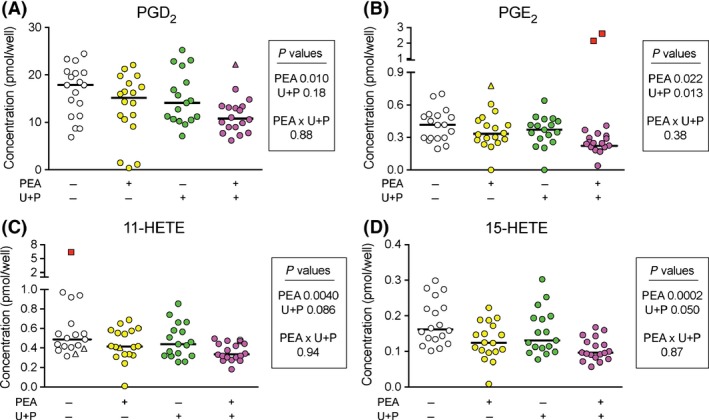
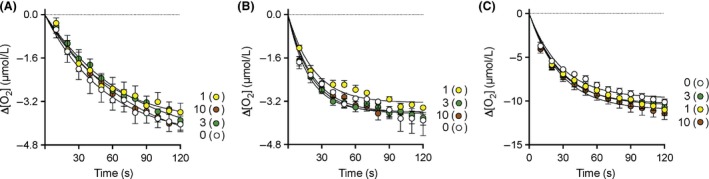
The anti-inflammatory agent palmitoylethanolamide (PEA) reduces cyclooxygenase (COX) activity in vivo in a model of inflammatory pain. It is not known whether the compound reduces prostaglandin production in RAW264.7 cells, whether such an action is affected by compounds preventing the breakdown of endogenous PEA, whether other oxylipins are affected, or whether PEA produces direct effects upon the COX-2 enzyme. RAW264.7 cells were treated with lipopolysaccharide and interferon-γ to induce COX-2. At the level of mRNA, COX-2 was induced >1000-fold following 24 h of the treatment. Coincubation with PEA (10 μmol/L) did not affect the levels of COX-2, but reduced the levels of prostaglandins D2 and E2 as well as 11- and 15-hydroxyeicosatetraenoic acid, which can also be synthesised by a COX-2 pathway in macrophages. These effects were retained when hydrolysis of PEA to palmitic acid was blocked. Linoleic acid-derived oxylipin levels were not affected by PEA. No direct effects of PEA upon the oxygenation of either arachidonic acid or 2-arachidonoylglycerol by COX-2 were found. It is concluded that in lipopolysaccharide and interferon-γ-stimulated RAW264.7 cells, PEA reduces the production of COX-2-derived oxylipins in a manner that is retained when its metabolism to palmitic acid is inhibited.
Keywords: N‐acylethanolamine hydrolysing acid amidase; Palmitoylethanolamide; RAW264.7 cells; bootstrapped linear model; cyclooxygenase; fatty acid amide hydrolase; oxylipin; prostaglandin.
Figures
Similar articles
-
Characterisation of (R)-2-(2-Fluorobiphenyl-4-yl)-N-(3-Methylpyridin-2-yl)Propanamide as a Dual Fatty Acid Amide Hydrolase: Cyclooxygenase Inhibitor.PLoS One. 2015 Sep 25;10(9):e0139212. doi: 10.1371/journal.pone.0139212. eCollection 2015. PLoS One. 2015. PMID: 26406890 Free PMC article.
-
N-acylethanolamine-hydrolyzing acid amidase and fatty acid amide hydrolase inhibition differentially affect N-acylethanolamine levels and macrophage activation.Biochim Biophys Acta Mol Cell Biol Lipids. 2017 May;1862(5):474-484. doi: 10.1016/j.bbalip.2017.01.001. Epub 2017 Jan 6. Biochim Biophys Acta Mol Cell Biol Lipids. 2017. PMID: 28065729
-
The inhibitory effects of mercaptoalkylguanidines on cyclo-oxygenase activity.Br J Pharmacol. 1997 Feb;120(3):357-66. doi: 10.1038/sj.bjp.0700892. Br J Pharmacol. 1997. PMID: 9031736 Free PMC article.
-
Harnessing the anti-inflammatory potential of palmitoylethanolamide.Drug Discov Today. 2014 Oct;19(10):1632-9. doi: 10.1016/j.drudis.2014.06.007. Epub 2014 Jun 17. Drug Discov Today. 2014. PMID: 24952959 Review.
-
Measurement of palmitoylethanolamide and other N-acylethanolamines during physiological and pathological conditions.CNS Neurol Disord Drug Targets. 2013 Feb 1;12(1):23-33. doi: 10.2174/1871527311312010007. CNS Neurol Disord Drug Targets. 2013. PMID: 23394528 Review.
Cited by
-
The Basal Pharmacology of Palmitoylethanolamide.Int J Mol Sci. 2020 Oct 26;21(21):7942. doi: 10.3390/ijms21217942. Int J Mol Sci. 2020. PMID: 33114698 Free PMC article. Review.
-
Palmitoylethanolamide and Related ALIAmides for Small Animal Health: State of the Art.Biomolecules. 2022 Aug 26;12(9):1186. doi: 10.3390/biom12091186. Biomolecules. 2022. PMID: 36139024 Free PMC article. Review.
-
Relative Deficiency of Anti-Inflammatory N-Acylethanolamines Compared to Prostaglandins in Oral Lichen Planus.Biomedicines. 2020 Nov 6;8(11):481. doi: 10.3390/biomedicines8110481. Biomedicines. 2020. PMID: 33172176 Free PMC article.
-
Novel COX-2 products of n-3 polyunsaturated fatty acid-ethanolamine-conjugates identified in RAW264.7 macrophages.J Lipid Res. 2019 Nov;60(11):1829-1840. doi: 10.1194/jlr.M094235. Epub 2019 Aug 27. J Lipid Res. 2019. PMID: 31455615 Free PMC article.
-
Serum levels of endocannabinoids and related lipids in painful vs painless diabetic neuropathy: results from the Pain in Neuropathy Study.Pain. 2024 Jan 1;165(1):225-232. doi: 10.1097/j.pain.0000000000003015. Epub 2023 Aug 11. Pain. 2024. PMID: 37578507 Free PMC article.
References
-
- Alhouayek M, Muccioli GG (2014). Harnessing the anti‐inflammatory potential of palmitoylethanolamide. Drug Discov Today 19: 1632–1639. - PubMed
-
- Benito C, Tolón RM, Castillo AI, Ruiz‐Valdepeñas L, Martínez‐Orgado JA, Fernández‐Sánchez FJ, et al. (2012). β‐Amyloid exacerbates inflammation in astrocytes lacking fatty acid amide hydrolase through a mechanism involving PPAR‐ α, PPAR‐γ and TRPV1, but not CB1 or CB2 receptors. Br J Pharmacol 166: 1474–1489. - PMC - PubMed
-
- Björklund E, Blomqvist A, Hedlin J, Persson E, Fowler CJ (2014). Involvement of fatty acid amide hydrolase and fatty acid binding protein 5 in the uptake of anandamide by cell lines with different levels of fatty acid amide hydrolase expression: a pharmacological study. PLoS ONE 9: e103479. - PMC - PubMed
LinkOut - more resources
Full Text Sources
Other Literature Sources
Research Materials
