. 2017:2017:4297025.
doi: 10.1155/2017/4297025. Epub 2017 Mar 5.

Diet-Induced Obesity Is Associated with an Impaired NK Cell Function and an Increased Colon Cancer Incidence

Affiliations

Diet-Induced Obesity Is Associated with an Impaired NK Cell Function and an Increased Colon Cancer Incidence

Ina Bähr et al. J Nutr Metab. 2017.

Abstract

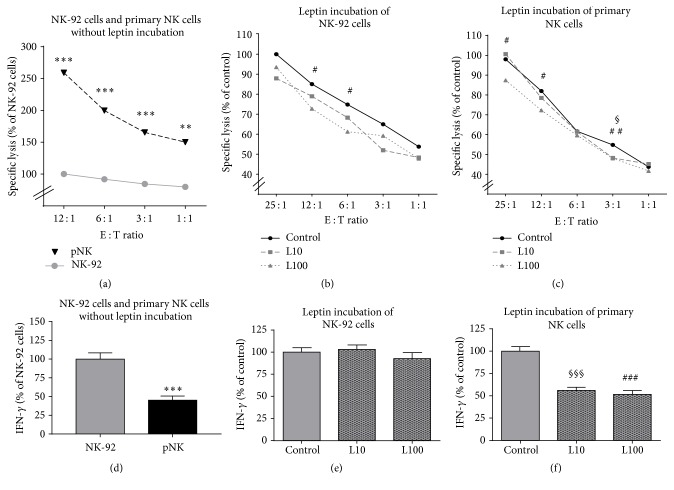
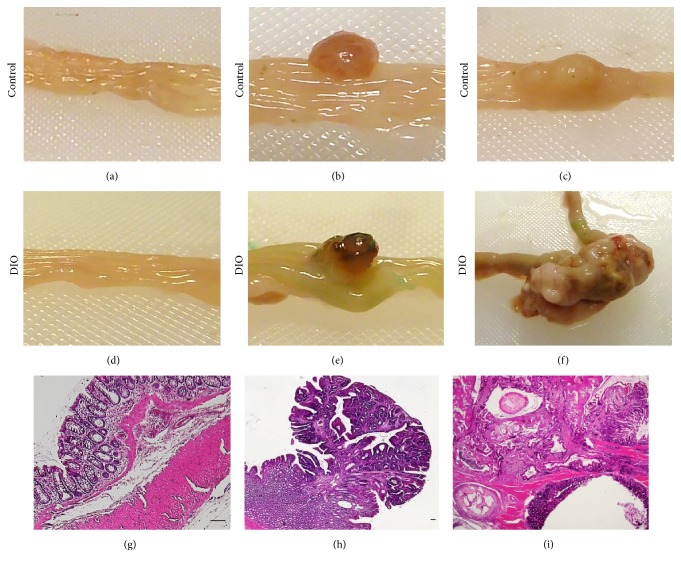
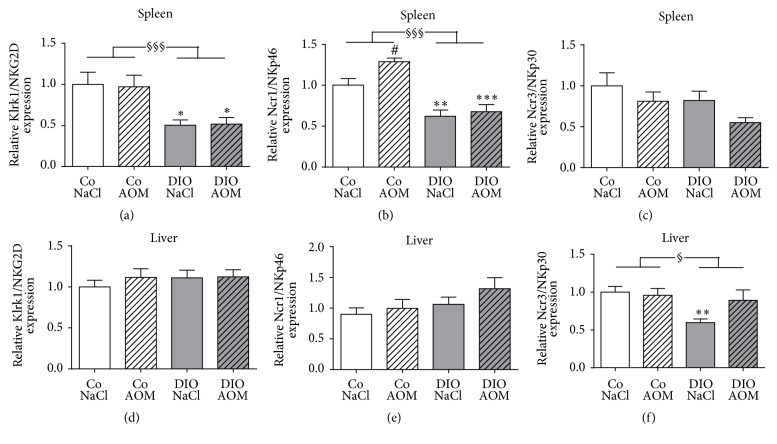
Obesity is associated with an increased colon cancer incidence, but underlying mechanisms remained unclear. Previous studies showed altered Natural killer (NK) cell functions in obese individuals. Therefore, we studied the impact of an impaired NK cell functionality on the increased colon cancer risk in obesity. In vitro investigations demonstrated a decreased IFN-γ secretion and cytotoxicity of human NK cells against colon tumor cells after NK cell preincubation with the adipokine leptin. In addition, leptin incubation decreased the expression of activating NK cell receptors. In animal studies, colon cancer growth was induced by injection of azoxymethane (AOM) in normal weight and diet-induced obese rats. Body weight and visceral fat mass were increased in obese animals compared to normal weight rats. AOM-treated obese rats showed an increased quantity, size, and weight of colon tumors compared to the normal weight tumor group. Immunohistochemical analyses demonstrated a decreased number of NK cells in spleen and liver in obesity. Additionally, the expression levels of activating NK cell receptors were lower in spleen and liver of obese rats. The results show for the first time that the decreased number and impaired NK cell function may be one cause for the higher colon cancer risk in obesity.


Conflict of interest statement

The authors declare that there is no conflict of interests regarding the publication of this paper.

Figures

Figure 1
Figure 1
Cytotoxicity assay (a–c) and IFN-γ secretion (d–f) of NK-92 or primary NK (pNK) effector cells [E] against DLD-1 colon tumor cells target cells [T]. (a) Cytotoxicity assay of unstimulated NK-92 cells and unstimulated pNK cells. (b and c) Cytotoxicity assay of NK-92 cells or pNK cells after leptin incubation with 10 ng/mL (L10) or 100 ng/mL (L100) leptin for 72 h. Values are expressed as means ± SEM of at least three individual experiments with each N = 3-4 well. (d) Interferon–γ (IFN-γ) secretion of unstimulated NK-92 cells and unstimulated pNK cells. (e and f) IFN-γ secretion of NK-92 cells or pNK cells after leptin incubation. Values are expressed as means ± SEM at least in three individual experiments. ∗∗P < 0.01 and ∗∗∗P < 0.001, NK-92 cells compared to pNK cells; §P < 0.05, §§§P < 0.001, control group versus L10; #P < 0.05, ##P < 0.01, and ###P < 0.001, control group versus L100.
Figure 2
Figure 2
Influence of leptin on the mRNA expression of the activating NK cell receptors Klrk1/NKG2D (a, d), Ncr1/NKp46 (b, e), and Ncr3/NKp30 (c, f). NK-92 cells were incubated in the absence or presence of 10 ng/mL (L10) or 100 ng/mL (L100) leptin for 4 h (a–c) or 24 h (d–e). Results are expressed as the mean ± SEM fold-change compared to control cells, from three individual experiments with each N = 4 well. P < 0.05, ∗∗P < 0.01, and ∗∗∗P < 0.001 compared to control cells.
Figure 3
Figure 3
(a–f) Macroscopic observation of normal colon tissue, colorectal adenoma, and colorectal adenocarcinoma from azoxymethane- (AOM-) treated normal weight rats (a–c) as well as diet-induced obese (DIO) rats (d–f). (g–i) Representative histopathology of healthy colon tissue (g), colorectal adenoma (h), and colorectal adenocarcinoma ((i) scale bar, 100 μm).
Figure 4
Figure 4
Plasma concentrations of leptin (a), TNF-α (b), IL-1β (c), and IL-10 (d) of normal weight [Co] and obese rats [DIO] treated with NaCl or azoxymethane (AOM). Data are expressed as mean ± SEM of n = 11–14 animals per group. #P < 0.05 compared to NaCl-treated control group; P < 0.05, compared to appropriate control group. §P < 0.05, two-way-ANOVA, normal weight control groups compared to DIO groups.
Figure 5
Figure 5
Exemplary FACS plots and frequencies of different leukocytes subset populations in peripheral blood of normal weight [Co] and obese [DIO] rats treated with NaCl or azoxymethane (AOM). Total T lymphocytes (a, c), monocytes (b, d), B lymphocytes (a, e), NKT cells (j, l, m), and NK cells (k, l, m) are demonstrated as percentage of peripheral blood mononuclear cells (PBMCs). NK cells are represented by cells with CD161abright and CD3 expression and denoted with NK cells (green colored population). CD4+ T lymphocytes (f, h, i) and CD8+ T lymphocytes (g, h, i) are illustrated as percentage of total T lymphocytes. Differences in frequencies of CD4+ and CD8+ T lymphocytes (h, i) as well as differences in NKT cell frequency (l, m) in normal weight (h, l) and obese rats (i, m) are exemplary demonstrated. Data are expressed as mean ± SEM of n = 11–14 animals per group. #P < 0.05 compared to NaCl-treated control group; P < 0.05, compared to appropriate control group. §P < 0.05, §§P < 0.01, two-way-ANOVA, normal weight control groups compared to DIO groups.
Figure 6
Figure 6
Numbers of NK cells in liver (a) and spleen (b) of normal weight [Co] and obese [DIO] rats treated with NaCl or azoxymethane (AOM). Data are expressed as mean ± SEM of n = 5 animals per group. §P < 0.05, two-way-ANOVA, normal weight control groups compared to DIO groups. (c–f) Representative immunohistological detection of NK cells in liver tissue (red colored (c), (d)) and splenic tissue (blue colored; (e), (f)) in normal weight and obese rats treated with AOM (scale bar, 100 μm).
Figure 7
Figure 7
Splenic (a–c) and hepatic (d–f) mRNA expression of the NK cell activating receptors Klrk1/NKG2D (a, d), Ncr1/NKp46 (b, e), and Ncr3/NKp30 (c, f) in normal weight [Co] and obese [DIO] rats treated with NaCl or azoxymethane (AOM). Data are expressed as mean ± SEM of n = 11–14 animals per group. #P < 0.05 compared to NaCl-treated control group; P < 0.05, ∗∗P < 0.01, and ∗∗∗P < 0.001, compared to appropriate control group. §P < 0.05, §§§P < 0.001, and two-way-ANOVA, normal weight control groups compared to DIO groups.

References

    1. WHO. Obesity and Overweight. Geneva, Switzerland: World Health Organisation; 2015. (WHO fact sheet N 311).
    1. Dobbins M., Decorby K., Choi B. C. The Association between obesity and cancer risk: a meta-analysis of observational studies from 1985 to 2011. ISRN Preventive Medicine. 2013;2013:16. doi: 10.5402/2013/680536.680536 - DOI - PMC - PubMed
    1. Calle E. E., Rodriguez C., Walker-Thurmond K., Thun M. J. Overweight, obesity, and mortality from cancer in a prospectively studied cohort of U.S. Adults. The New England Journal of Medicine. 2003;348(17):1625–1638. doi: 10.1056/nejmoa021423. - DOI - PubMed
    1. Wolin K. Y., Carson K., Colditz G. A. Obesity and cancer. Oncologist. 2010;15(6):556–565. doi: 10.1634/theoncologist.2009-0285. - DOI - PMC - PubMed
    1. Alemán J. O., Eusebi L. H., Ricciardiello L., Patidar K., Sanyal A. J., Holt P. R. Mechanisms of obesity-induced gastrointestinal neoplasia. Gastroenterology. 2014;146(2):357–373. doi: 10.1053/j.gastro.2013.11.051. - DOI - PMC - PubMed

LinkOut - more resources