. 2014 Sep 1;1(9):279-288.
doi: 10.15698/mic2014.09.166.

Time resolved DNA occupancy dynamics during the respiratory oscillation uncover a global reset point in the yeast growth program

Affiliations

Time resolved DNA occupancy dynamics during the respiratory oscillation uncover a global reset point in the yeast growth program

Cornelia Amariei et al. Microb Cell. .

Abstract

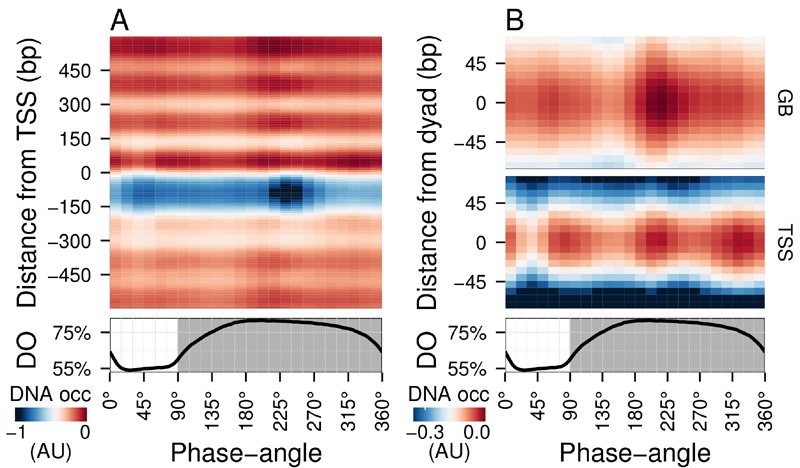
The structural dynamics of chromatin have been implicated in the regulation of fundamental eukaryotic processes, such as DNA transcription, replication and repair. Although previous studies have revealed that the chromatin landscape, nucleosome remodeling and histone modification events are intimately tied into cellular energetics and redox state, few studies undertake defined time-resolved measurements of these state variables. Here, we use metabolically synchronous, continuously-grown yeast cultures to measure DNA occupancy and track global patterns with respect to the metabolic state of the culture. Combined with transcriptome analyses and ChIP-qPCR experiments, these paint an intriguing picture where genome-wide nucleosome focusing occurs during the recovery of energy charge, followed by clearance of the promoter regions and global transcriptional slow-down, thus indicating a nucleosome-mediated "reset point" for the cycle. The reset begins at the end of the catabolic and stress-response transcriptional programs and ends prior to the start of the anabolic and cell-growth transcriptional program, and the histones on genes from both the catabolic and anabolic superclusters are deacetylated.

Keywords: anabolism; catabolism; chromatin dynamics; energetics; histone modification; respiratory oscillation; transcription regulation.


Conflict of interest statement

Conflict of interest: The authors declare no conflict of interest.

Figures

Figure 1
Figure 1. FIGURE 1: Average DNA occupancy dynamics around TSS during one respiratory cycle.
An average cycle was constructed by a cubic spline fitting of the dataset (normalized by the least variant set 49) comprising three respiratory cycles (33 samples; 6 min sampling; oscillation period 67 min), where protein-bound and genomic DNA sample pairs were extracted using our one-pot method. The median DNA occupancy (DNA occ = log2(pDNA) - log2(gDNA) - MNase bias; see Methods; capped at -1 in A for increased resolution) was calculated for 5140 genes aligned to the transcriptional start site ((A); TSS; 0 bp) and aligned to putative nucleosome dyads ((B); 0 bp) defined by . Putative nucleosomes were further classified according to their position with respect to TSS as gene body nucleosomes (GB; except for +1/terminal nucleosomes) and TSS nucleosomes. Time is represented as phase-angles calculated according to the respiratory oscillation (represented as a subscript throughout the text), where the minimum first derivative of the residual dissolved oxygen data (bottom panels) represents 0°/360°. Dark grey marks the reductive phase. Median nucleosome profiles at upstream and terminal nucleosomes are shown in Figure S2.
Figure 2
Figure 2. FIGURE 2: Expression dynamics of major gene clusters and the DNA occupancy dynamics at their average gene promoters during a respiratory cycle.
Messenger RNA abundances from the consensus clusters (Clusters A, AB, B, C and D; 19) from a time-series microarray dataset (48 samples; 4 min sampling, period 50 min) were summed for each cluster (A), ∑[mRNA]. Transcripts that belong to the anabolic supercluster (A, AB and B; produced during the oxidative phase) and those that belong to the catabolic supercluster (C and D; produced during the reductive phase) have a solid red and blue fill, respectively. The median DNA occupancy profiles of the aligned nucleosome dyads for the consensus clusters during a respiratory cycle ((B), DNA occ) were calculated as in Figure 1B. The DNA occupancy dynamics ((C), ΔDNA occ) were normalized by subtracting the log-ratio temporal average (red and blue side bar) from the median DNA occupancy for each expression cluster (see Fig. 1A). Dotted lines represent the residual dissolved oxygen (DO), scaled to the y-axis range of the panel. The transcript and nucleosome datasets were aligned using the minimum and maximum first derivative of the DO (Fig. S4A). The minimum first derivative of the DO data represents 0°/360°. The differential expression clusters B.C and B.D were merged into an expanded cluster B, as these were co-expressed during the short period oscillation. These clusters and lower signal-to-noise ratio clusters are shown in Figure S3.
Figure 3
Figure 3. FIGURE 3: Defining the reset point of the respiratory oscillation.
The temporal profile of the DNA occupancy (DNA occ) at the center of the nucleosome region for the anabolic and catabolic superclusters (A) were calculated as in Figure 1B. Histone H3 (B) and H3K9ac ((C), log-ratio values with respect to H3) ChIP time-series (14 samples; 4 min sampling; period 53 min) were amplified by qPCR at TSS regions of 4 representative anabolic (red hues) and catabolic (blue hues) genes. Total mRNA abundances for each supercluster ((D), ∑[mRNA]) were used to calculate mRNA abundance rate of change ((E); ∑[mRNA]'; change in mRNA abundance every 15°). The same samples for B and C were used for RNA PolII ChIP-qPCR at genome body regions of 4 representative anabolic (red hues) and catabolic (blue hues) genes (F). The PolII signals were normalized with respect to a subtelomeric region on chromosome VI. ATP, ADP and AMP concentration time-series data ((G), 36 samples, 6 min sampling, period 78 min, Fig. S4B) measured by capillary electrophoresis mass spectrometry were used to calculate inferred ISWI remodeling rates (H). An average cycle was constructed by a cubic spline fitting for each time-series spanning several cycles (A, D, E, G, H). Error bars in B, C, F represent standard error of mean of qPCR triplicates. Dotted lines represent the residual dissolved oxygen (DO), scaled to the y-axis range of each panel, and datasets were aligned using the minimum and maximum first derivative of DO concentration (Fig. S4A). The minimum first derivative of the DO data represents 0°/360°. The anabolic supercluster was defined as clusters A, AB, B, B.C, B.D and ab.n and the catabolic supercluster was defined as clusters C, D, cd.n and cd.ab.
None
None
None

References

    1. Holde KE. New York: Springer; 1989. Chromatin. - DOI
    1. Flores O, Orozco M. nucleR: a package for non-parametric nucleosome positioning. Bioinformatics. 2011;27(15):2149–2150. doi: 10.1093/bioinformatics/btr345. - DOI - PubMed
    1. Suter B. Poly(dAmiddle dotdT) sequences exist as rigid DNA structures in nucleosome-free yeast promoters in vivo. Nucleic Acids Res. 2000;28(21):4083–4089. doi: 10.1093/nar/28.21.4083. - DOI - PMC - PubMed
    1. Brogaard K, Xi L, Wang J-P, Widom J. A map of nucleosome positions in yeast at base-pair resolution. Nature. 2012;486(7404):496–501. doi: 10.1038/nature11142. - DOI - PMC - PubMed
    1. Whitehouse I, Rando OJ, Delrow J, Tsukiyama T. Chromatin remodelling at promoters suppresses antisense transcription. Nature. 2007;450(7172):1031–1035. doi: 10.1038/nature06391. - DOI - PubMed

LinkOut - more resources