

Improvement of biochemical methods of polyP quantification
- PMID: 28357384
- PMCID: PMC5354550
- DOI: 10.15698/mic2017.01.551
Improvement of biochemical methods of polyP quantification
Abstract
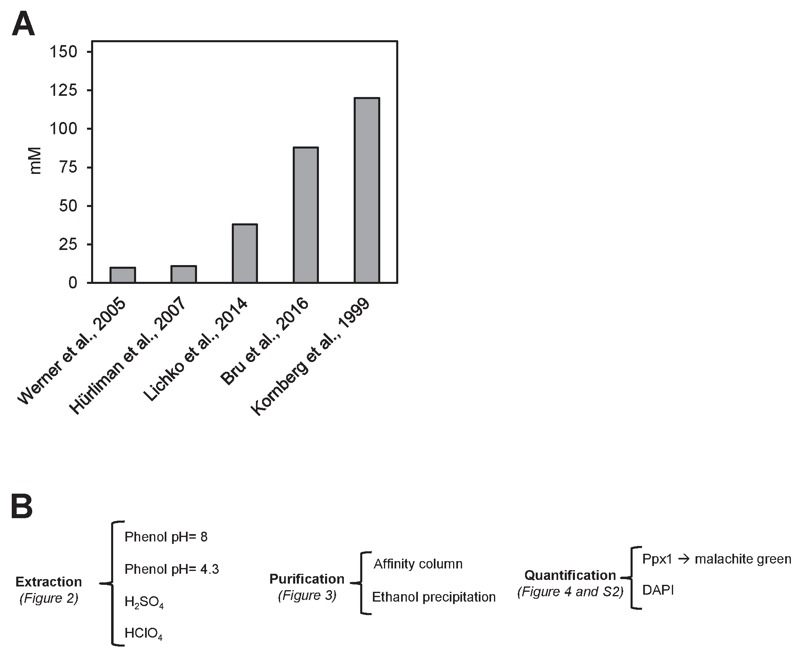
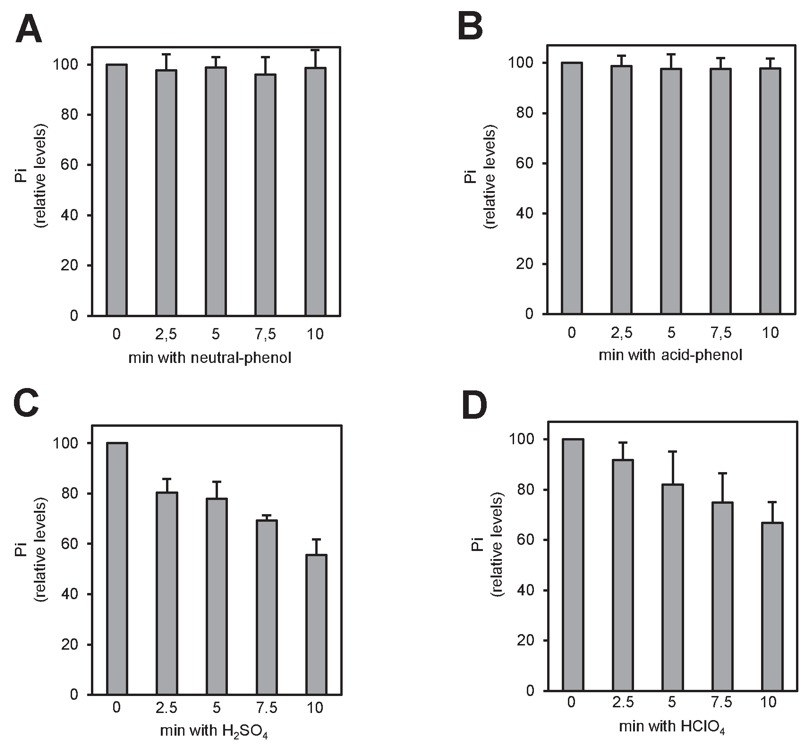
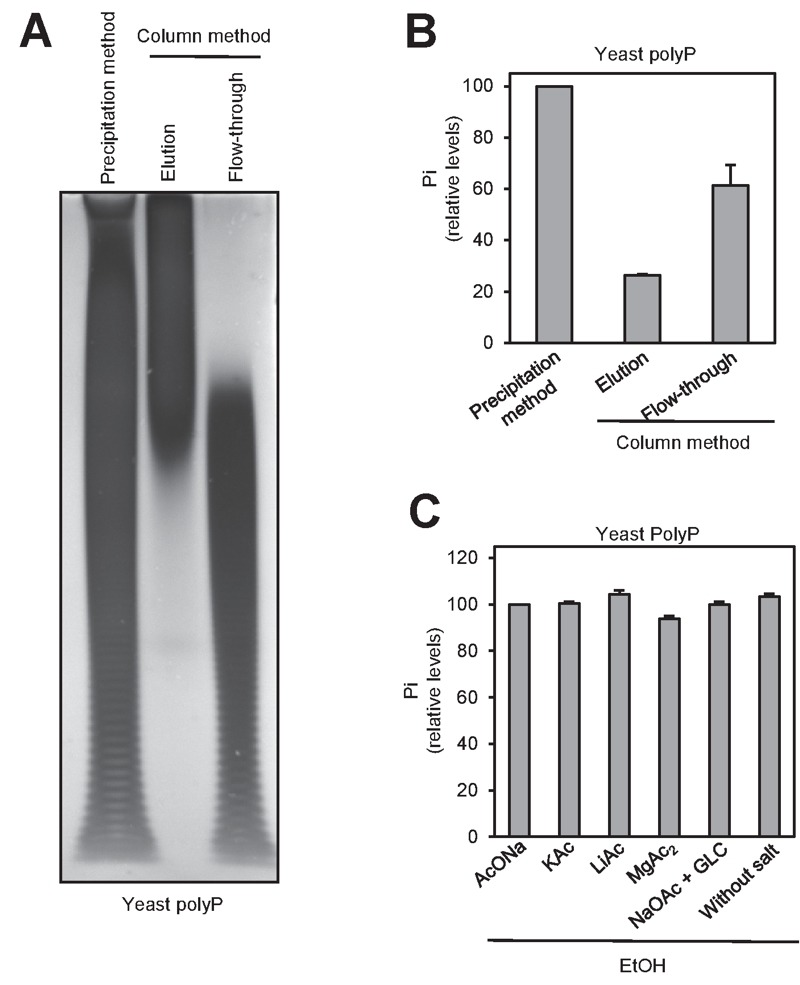
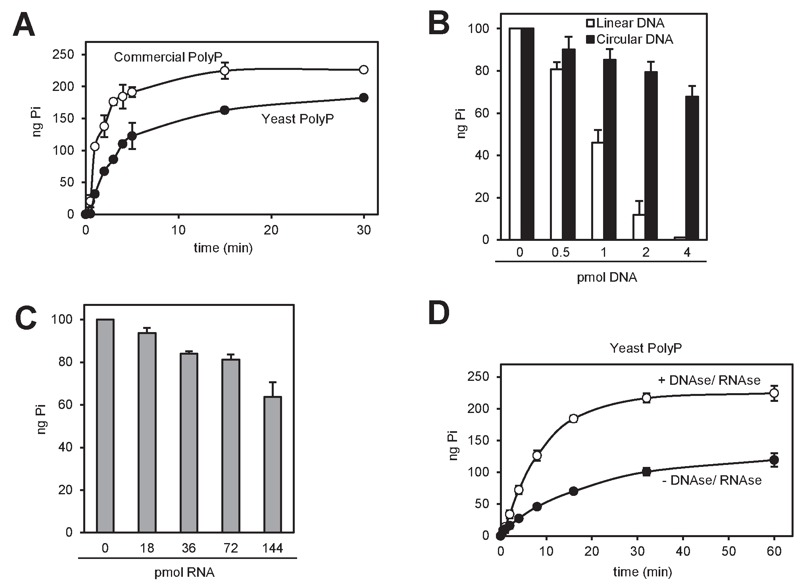
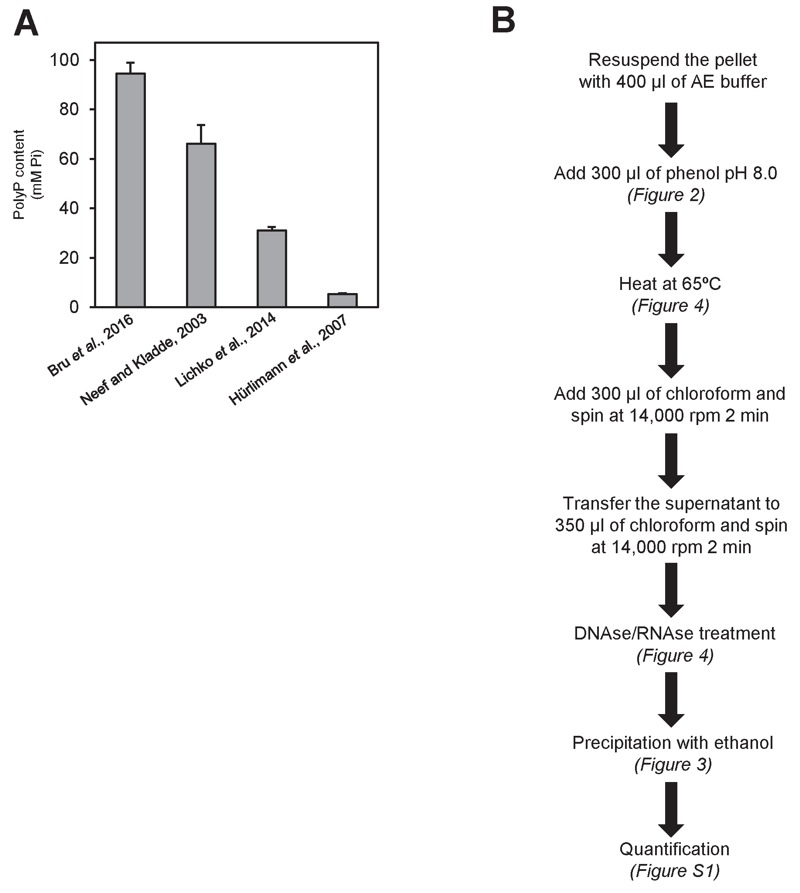
Polyphosphate (polyP) is an abundant and physiologically important biomolecule for virtually any living cell. Therefore, determination of changes in cellular content of polyP is crucial for its functional characterization. Determination of cellular polyP has been performed by many different methods, and the lack of a standardized procedure is possibly responsible for the large dispersion of results found in the relevant literature. For a relatively simple organism, such as the yeast Saccharomyces cerevisiae, this variation can be up to 12-fold. polyP extraction and determination of free phosphate released by enzymatic degradation of the polymer is a method quite common and relatively straightforward for polyP determination. By using the yeast S. cerevisiae as model, we have experimentally evaluated the different steps in this procedure in order to identify critical issues that might explain the disparate reported results. As the main output of this evaluation we propose a straightforward and robust procedure that can be used as gold standard protocol for cellular polyP purification and determination from unicellular organisms, thus providing consistency to measurements and facilitating inter-laboratory comparisons and biological interpretation of the results.
Keywords: Saccharomyces cerevisiae; neutral-phenol; polyphosphate; yeast.
Conflict of interest statement
Conflict of interest: The authors declare no conflict of interest.
Figures
Similar articles
-
Enzymatic quantification and length determination of polyphosphate down to a chain length of two.Anal Biochem. 2018 May 1;548:82-90. doi: 10.1016/j.ab.2018.02.018. Epub 2018 Feb 24. Anal Biochem. 2018. PMID: 29481774
-
Dependence of inorganic polyphosphate chain length on the orthophosphate content in the culture medium of the yeast Saccharomyces cerevisiae.Biochemistry (Mosc). 2000 Mar;65(3):349-54. Biochemistry (Mosc). 2000. PMID: 10739478
-
Rapid Fluorescence Assay for Polyphosphate in Yeast Extracts Using JC-D7.Yeast. 2024 Oct;41(10):593-604. doi: 10.1002/yea.3979. Epub 2024 Sep 11. Yeast. 2024. PMID: 39262085
-
Enzymes of yeast polyphosphate metabolism: structure, enzymology and biological roles.Biochem Soc Trans. 2016 Feb;44(1):234-9. doi: 10.1042/BST20150213. Biochem Soc Trans. 2016. PMID: 26862210 Review.
-
Polyphosphate: popping up from oblivion.Curr Genet. 2017 Feb;63(1):15-18. doi: 10.1007/s00294-016-0611-5. Epub 2016 May 25. Curr Genet. 2017. PMID: 27221322 Review.
Cited by
-
Latitudinal patterns in ocean C:N:P reflect phytoplankton acclimation and macromolecular composition.Proc Natl Acad Sci U S A. 2024 Nov 12;121(46):e2404460121. doi: 10.1073/pnas.2404460121. Epub 2024 Nov 5. Proc Natl Acad Sci U S A. 2024. PMID: 39499637 Free PMC article.
-
Bacterial Phosphate Granules Contain Cyclic Polyphosphates: Evidence from 31P Solid-State NMR.J Am Chem Soc. 2020 Oct 28;142(43):18407-18421. doi: 10.1021/jacs.0c06335. Epub 2020 Oct 19. J Am Chem Soc. 2020. PMID: 33075224 Free PMC article.
-
Human Prune Regulates the Metabolism of Mammalian Inorganic Polyphosphate and Bioenergetics.Int J Mol Sci. 2023 Sep 8;24(18):13859. doi: 10.3390/ijms241813859. Int J Mol Sci. 2023. PMID: 37762163 Free PMC article.
-
Metabolic control of acclimation to nutrient deprivation dependent on polyphosphate synthesis.Sci Adv. 2020 Sep 30;6(40):eabb5351. doi: 10.1126/sciadv.abb5351. Print 2020 Sep. Sci Adv. 2020. PMID: 32998900 Free PMC article.
-
An Update on Polyphosphate In Vivo Activities.Biomolecules. 2024 Aug 2;14(8):937. doi: 10.3390/biom14080937. Biomolecules. 2024. PMID: 39199325 Free PMC article. Review.
References
-
- Kulakovskaya T, Vagabov V, Kulaev I. Inorganic Polyphosphate in Industry, Agriculture and Medicine: Modern State and Outlook. Process Biochemistry. 2012;47(10):471–10. doi: 10.1016/j.procbio.2011.10.028. - DOI
-
- Beauvoit B, Rigoulet M, Guerin P, Canioni P. Polyphosphates as a source of high energy phosphates in yeast mitochondria: a 31P NMR study. FEBS Lett. 1989;252(1(2)):17–21. doi: 10.1016/0014-5793(89)80882-8. - DOI
LinkOut - more resources
Full Text Sources
Other Literature Sources
Research Materials