. 2017 Mar 30:8:14867.
doi: 10.1038/ncomms14867.

The Par3 polarity protein is an exocyst receptor essential for mammary cell survival

Affiliations

The Par3 polarity protein is an exocyst receptor essential for mammary cell survival

Syed Mukhtar Ahmed et al. Nat Commun. .

Abstract

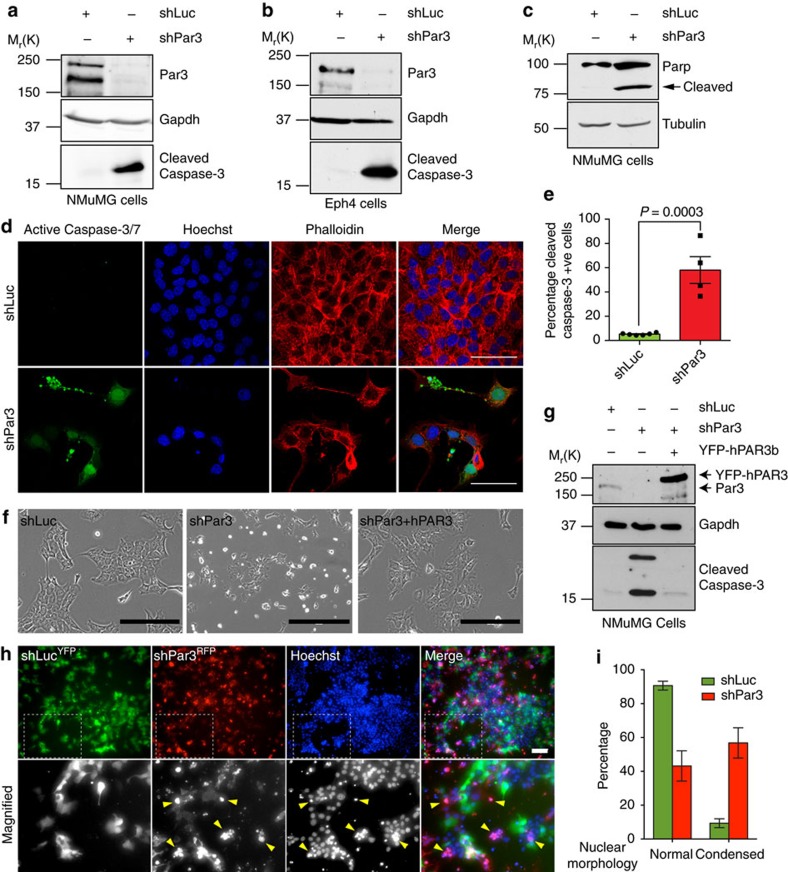
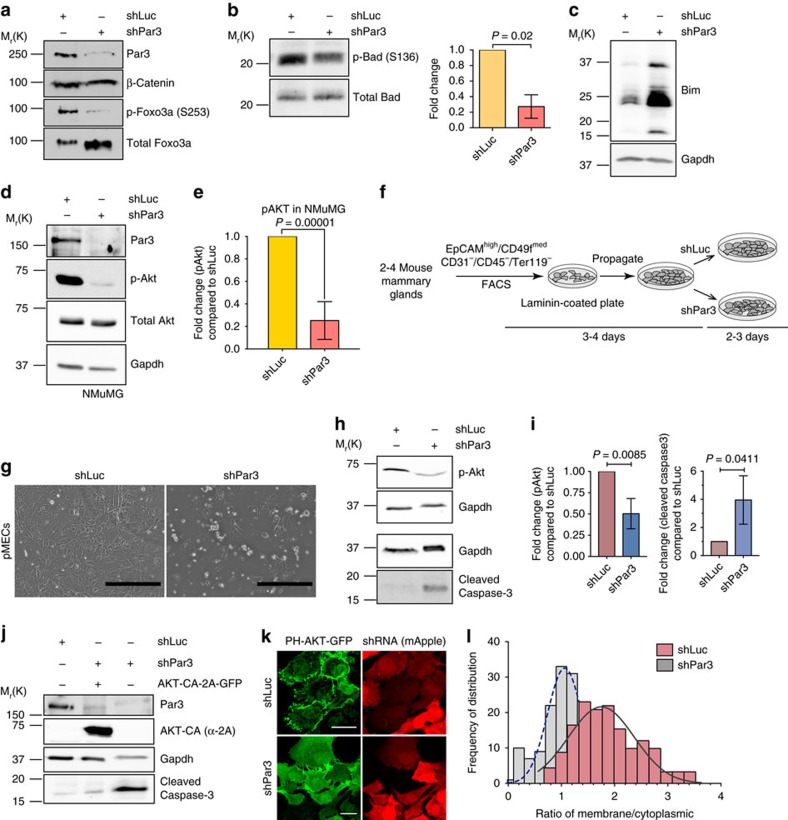
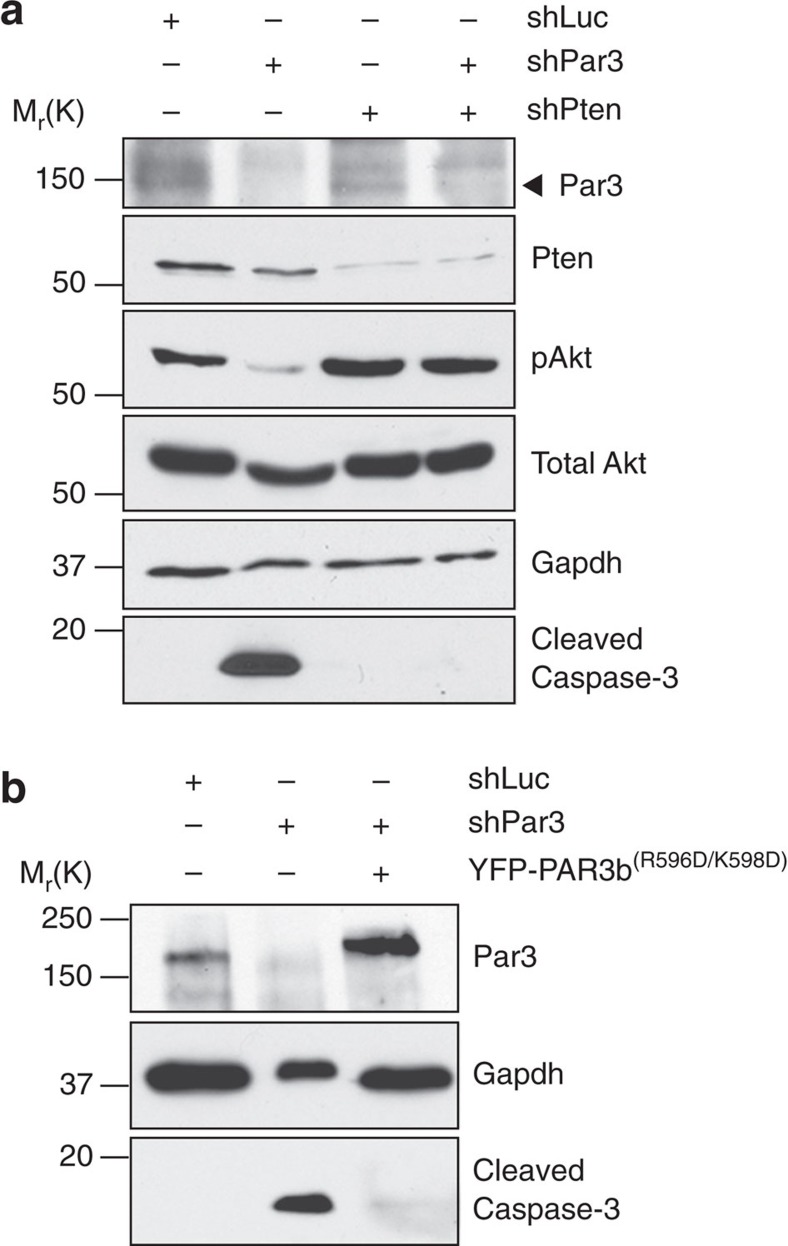
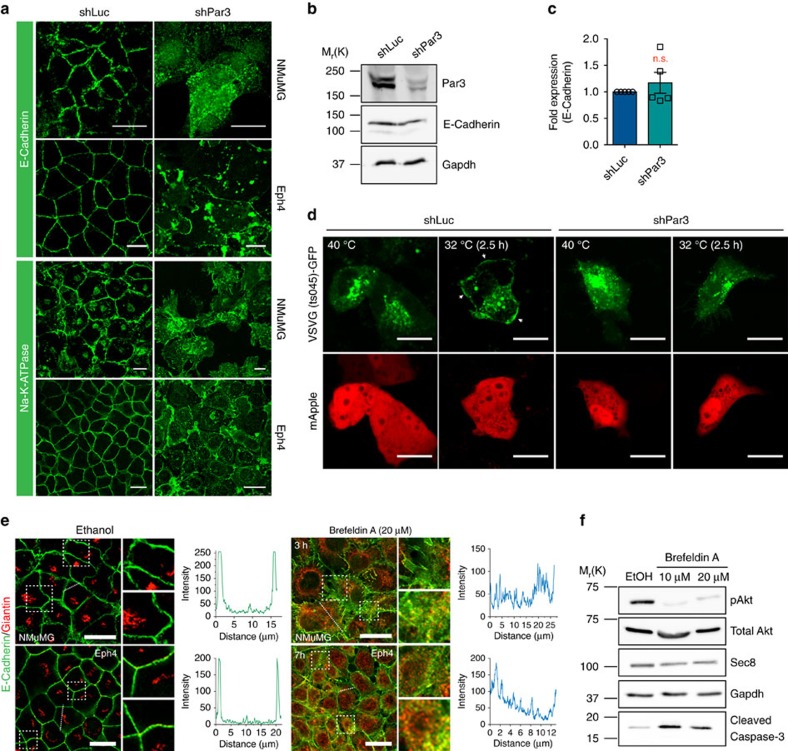
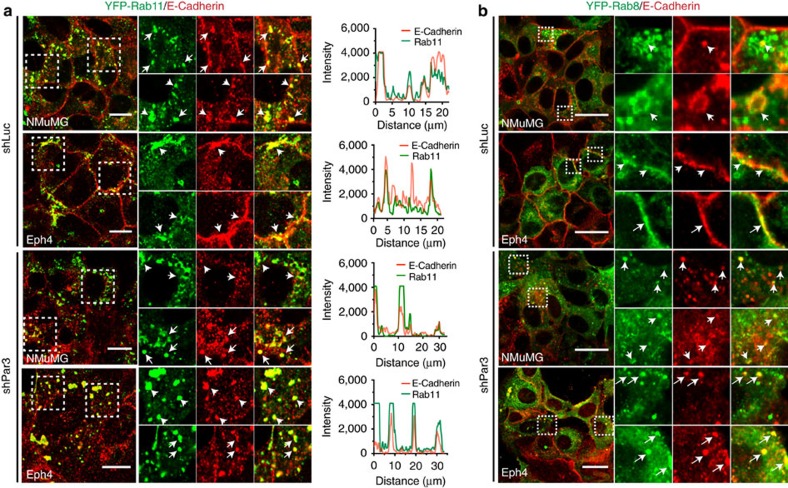
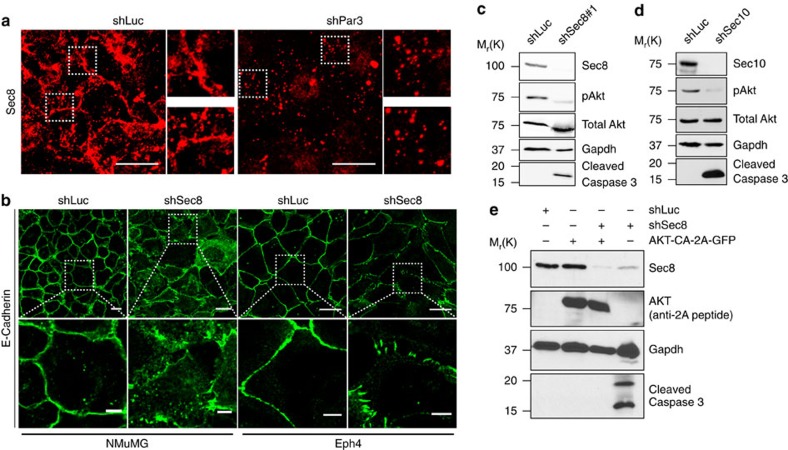
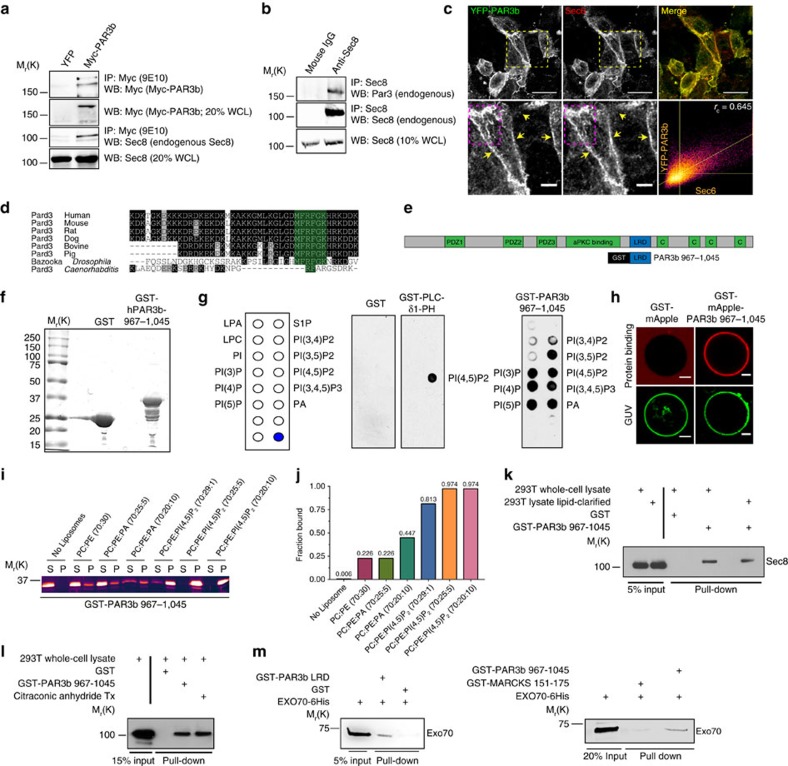
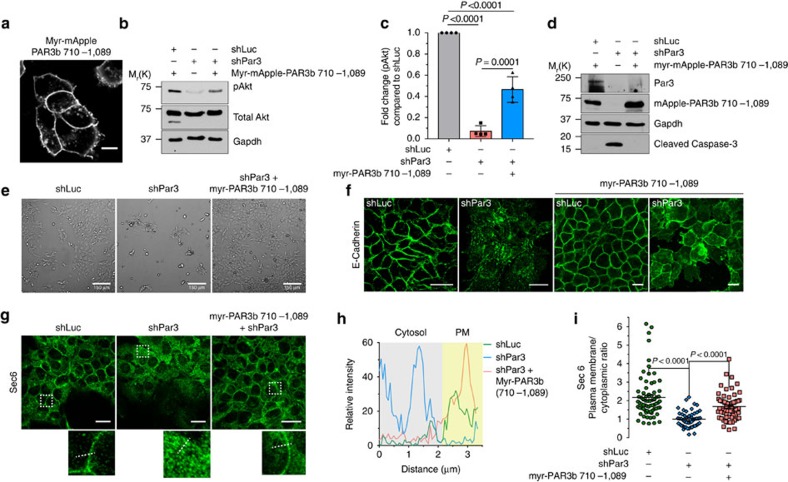
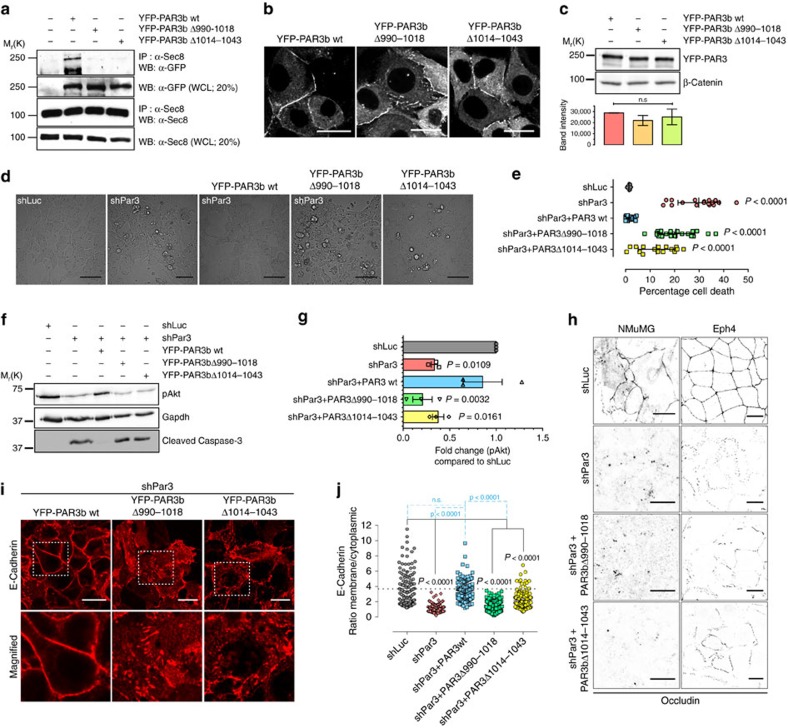
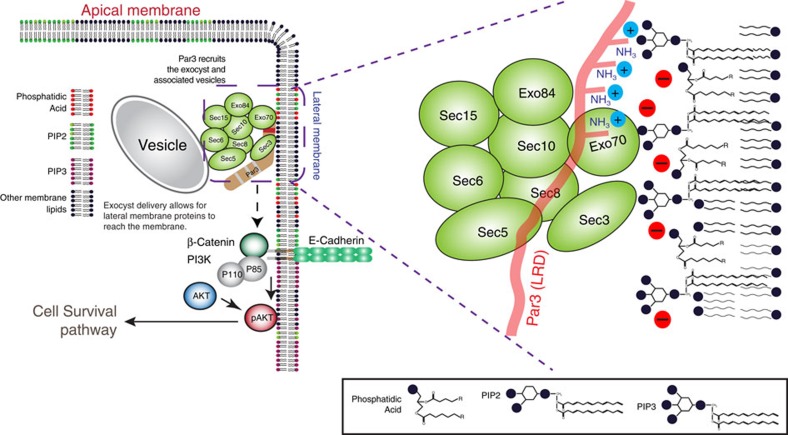
The exocyst is an essential component of the secretory pathway required for delivery of basolateral proteins to the plasma membranes of epithelial cells. Delivery occurs adjacent to tight junctions (TJ), suggesting that it recognizes a receptor at this location. However, no such receptor has been identified. The Par3 polarity protein associates with TJs but has no known function in membrane traffic. We now show that, unexpectedly, Par3 is essential for mammary cell survival. Par3 silencing causes apoptosis, triggered by phosphoinositide trisphosphate depletion and decreased Akt phosphorylation, resulting from failure of the exocyst to deliver basolateral proteins to the cortex. A small region of PAR3 binds directly to Exo70 and is sufficient for exocyst docking, membrane-protein delivery and cell survival. PAR3 lacking this domain can associate with the cortex but cannot support exocyst function. We conclude that Par3 is the long-sought exocyst receptor required for targeted membrane-protein delivery.


Conflict of interest statement

The authors declare no competing financial interests.

Figures

Figure 1
Figure 1. Loss of Par3 induces apoptosis.
(a,b) Knockdown of Par3 in NMuMG or Eph4 cells induces cleaved Caspase-3 activation. The experiments were repeated at least three times and representative blots are shown. (c) Knockdown of Par3 in NMuMG cells induces Parp cleavage. (d) Immunofluorescence staining of NMuMG cells showing the activity of Caspases 3 and 7 in NMuMG cells using CellEvent Caspase-3/7 Green ReadyProbes (green) and phalloidin Alexa594 (red) and Hoechst 33342 (blue). Scale bars, 50 μm. (e) Quantification of cleaved Caspase-3 staining in NMuMG cells. Data represented as the mean percentage of cleaved Caspase-3 compared with control, the graph shows mean±s.e.m. for four experimental replicates and P value was calculated by the Student's t-test. (f) Phase contrast images of NMuMG cells treated with shLuc, shPar3 or shPar3+YFP-hPAR3b. Scale bars, 200 μm. (g) Immunoblot showing cleaved Caspase-3 induction by Par3 depletion can be reversed by expression of YFP-hPAR3b. (h) Co-culture of NMuMG cells expressing shLuc plus GFP (green) or shPar3 plus RFP (red) and stained with Hoechst 33342 (blue). The experiment was repeated three times and a representative image is shown. The boxed region is shown as magnified below. Scale bar, 100 μm. (i) Quantification of cells with normal or condensed nuclear morphology in the experiment shown in h. Error bars represent mean±s.e.m.
Figure 2
Figure 2. Loss of Par3 reduces pAkt and PtdIns-(3,4,5)-P3 levels.
Immunoblots showing changes in (a) phospho-Foxo3a; p-Foxo3a (S253), (b) phospho-Bad(S136); p-Bad, mean±s.d., n=3. (c) Bim, and (d) phospho-Akt (p-Akt) in NMuMG cells. (e) Quantification of p-Akt levels in NMuMG cells, mean±s.d., n=4. (f) Schematic representation of primary murine mammary luminal epithelial cell isolation and culture, also see Supplementary Fig. 3; details described in methods. (g) Phase contrast images of primary MECs (pMECs), 3 days after transduction with shLuc or shPar3. Scale bars, 400 μm. (h) p-Akt and cleaved Caspase-3 levels in pMECs upon treatment of cells with shLuc or shPar3. (i) Quantification of p-Akt and cleaved Caspase-3 in pMECs from three independent experiments. Error bars, mean±s.d. (j) Immunoblot analysis showing cleaved Caspase-3 levels upon shLuc or shPar3 expression in the presence or absence of constitutively active AKT1(T308D, S473D) (AKT-CA). (k) Localization of PH-AKT-GFP in the presence of shLuc or shPar3. mApple was used as an internal marker for hairpin vector transduction. Scale bars, 20 μm. (l) Frequency distribution histogram showing membrane to cytoplasmic ratio of PH-AKT-GFP localization. P values for all statistics calculated using Student's t-test.
Figure 3
Figure 3. Decrease in pAkt upon Par3 knockdown is independent of the interaction between Par3 and Pten.
(a) Immunoblot showing cleaved Caspase-3 and pAkt levels in cells treated with shLuc or shPar3 alone or together with shPten. (b) Cleaved Caspase-3 levels after expression of GFP-hPAR3(R596D/K598D).
Figure 4
Figure 4. Depletion of Par3 in mammary cells affects post-Golgi transport of lateral membrane proteins.
(a) E-cadherin and Na+, K+-ATPase localizations in NMuMG and Eph4 cells. Experiments were successfully replicated 3 × and representative images are shown. (b) Representative immunoblot of E-cadherin expression levels in NMuMG cells treated with shLuc or shPar3 cells. (c) Quantification of E-cadherin expression as fold change over control (shLuc); the graph shows mean±s.e.m.; and statistical significance was assessed from five independent experiments using the Student's t-test. (d) Localization of temperature-sensitive VSVG mutant VSVG(ts045)-GFP at 40 °C or at 32 °C upon temperature shift in NMuMG cells. Representative images are shown from one experiment. (e) Localization of E-cadherin and Giantin upon BFA (20 μM) treatment in NMuMG cells (3 h) or Eph4 cells (7 h). Experiments were replicated three times and representative images are shown. White dashed boxed ROIs shown in enlarged images. White dashed lines shown as fluorescent intensity profiles of E-cadherin staining across a single cell. (f) pAkt and cleaved Caspase-3 levels in NMuMG cells after BFA (10 or 20 μM) treatments for 26 h. All scale bars, 20 μm.
Figure 5
Figure 5. E-cadherin co-localizes with Rab11-positive vesicles.
NMuMG and Eph4 cells expressing (a) YFP-Rab11, or (b) YFP-Rab8 were transduced with shLuc or shPar3, fixed and stained for E-cadherin. Fluorescent intensity profiles taken over a 20–30 μm straight line for both E-cadherin and YFP-Rab11 and overlaid. Confocal images were taken sequentially using 488 and 641 nm excitation lasers. White dashed boxed ROIs are magnified and arrows direct to objects where structures in both channels overlap. Scale bars, 20 μm.
Figure 6
Figure 6. Loss of exocyst proteins in NMuMG and Eph4 phenocopies loss of Par3.
(a) Localization of endogenous Sec8 in NMuMG cells treated with shLuc or shPar3. Scale bars, 20 μm. (b) E-cadherin localization in NMuMG or Eph4 cells treated with shLuc or shSec8. Boxed ROIs are magnified. Scale bars, 20 μm (top), 5 μm (bottom). pAkt and cleaved Caspase-3 levels in NMuMG cells treated with (c) shSec8, or (d) shSec10. (e) pAkt and cleaved Caspase-3 levels in NMuMG cells treated with shSec8 with or without AKT-CA. Experiments were repeated at least three times and representative images are shown.
Figure 7
Figure 7. The exocyst and phosphatidylinositides bind to the lysine-rich region of Par3.
(a) Co-immunoprecipitation of Myc-PAR3 and Sec8. HEK293T cells were transfected with either pKMyc-PAR3b, or PKYFP as a negative control, and immunoprecipitated with anti-Myc (9E10), antibodies. Lysates were immunoblotted with anti-Myc-HRP and anti-Sec8 antibodies. (b) Co-immunoprecipitation of endogenous Par3 and Sec8 from NMuMG cells. Sec8 was immunoprecipitated using anti-Sec8 (14/SEC8) antibody and immunoblotted using anti-Par3 and anti-Sec8 antibodies. Mouse IgG was used as control. (c) Localization of YFP-PAR3 and Sec6. NMuMG cells were transduced with YFP-PAR3 (green), grown in a monolayer, fixed and stained for Sec6 (red). Boxed ROIs (yellow) magnified. Pearson correlation coefficient was measured from the boxed ROI (magenta). rc=Pearson coefficient of co-localization. Scale bars, 20 μm (top), 5 μm bottom. (d) Protein sequence alignment of the LRD of Par3 in different species. The green highlighted amino acids are conserved between all species compared. (e) Schematic representation showing the domain structures spanning Par3. c=coil-coiled domain. (f) Coomassie staining of purified GST and GST-human PAR3(967–1045) from E. coli. (g) Purified GST, GST-PLC1-PH or GST-PAR3(967–1045) incubated with membrane lipid-strips and immunoblotted with anti-GST2 antibody. (h) Confocal images of purified GST-mApple or GST-mApple-PAR3b 967–1045 binding to GUVs. The GUVs consist of DOPC (69 mol%), DOPE (13.5 mol%), PIP2 (1.5 mol%) PA-NBD (0.5 mol%) and cholesterol (15.5 mol%); scale bars, 5 μm. (i) Coomassie stained gel (pseudocolored for enhanced contrast) of purified GST-PAR3(967–1045) binding to liposomes consisting of different lipid mixtures as indicated. S=supernatant, P=pellet. (j) Levels of protein binding as fraction bound, [P/(S+P)], shown in i. (k) GST-PAR3(967–1045) binding to SEC8 in native lipid or lipid-free environment. Lipids were removed from purified GST-PAR3(967–1045) and HEK293T lysates using lipid removal adsorbent before mixing and pull-down assay. (l) GST-PAR3(967–1045) binding to SEC8 with and without citraconic anhydride treatment. Also, see Supplementary Fig. 7h,i. (m) GST capture experiment in vitro. Purified GST-PAR3(967–1045), GST or GST-MARCKS 151-175 were mixed with purified EXO70-6His and the associated complex pulled down using Glutathione-Sepharose resins followed by immunoblotting with an anti-EXO70 antibody. Representative images are shown from at least three successful replicates.
Figure 8
Figure 8. Par3-exocyst binding is sufficient for cell survival and E-cadherin localization.
(a) Confocal image showing localization of myr-mApple-PAR3(710-1089); scale bar, 10 μm. (b) pAkt levels in NMuMG cells expressing shLuc, shPar3 or shPar3+myr-mApple-PAR3(710-1089). Gapdh and Total Akt used as protein-loading controls. (c) Quantification of experiments shown in b from three independent experiments, mean±s.d. P values were calculated using one-way ANOVA followed by Dunnett's multiple comparison tests. (d) Western blot analysis of cleaved caspase-3 in NMuMG cells expressing shLuc, shPar3 or shPar3 with myr-mApple-PAR3(710-1089). (e) DIC images of NMuMG cells expressing shLuc, shPar3 or shPar3 with myr-PAR3b (710-1089); scale bar, 150 μm. (f) Confocal images showing E-cadherin localization in NMuMG cells expressing shLuc, shPar3 alone or with myr-mApple-PAR3(710-1089); scale bars, 20 μm. (g) Confocal images showing Sec6 localization in NMuMG cells expressing shLuc, shPar3 or shPar3 with myr-mApple-PAR3(710-1089). White boxes represent cropped images shown below; scale bars, 20 μm. (h) Intensity plot corresponding to the white lines in the cropped images in g. Cytoplasmic portion shaded in grey and approximate PM portion shaded in yellow. (i) Quantification of the PM to cytoplasmic ratio of Sec6 localization from three independent experiments; Graph shows mean±s.e.m., P values assessed using one-way ANOVA followed by Kruskal–Wallis multiple comparison tests. ANOVA, analysis of variance.
Figure 9
Figure 9. Par3-exocyst interaction is necessary for cell survival.
(a) Interaction of SEC8 with wild-type YFP-PAR3, YFP-PAR3Δ(990-1018) or YFP-PAR3Δ(1014-1043). YFP-PAR3 constructs were transiently expressed in HEK293T cells and immunoprecipitated using an anti-Sec8 antibody, followed by immunoblotting with anti-GFP or anti-Sec8. (b) Confocal images showing localization of wild-type YFP-PAR3, YFP-PAR3Δ990-1018 or YFP-PAR3Δ1014-1043 in NMuMG cells; scale bars, 20 μm. (c) Western blots showing expression levels of YFP-Par3, YFP-PAR3Δ990-1018 or YFP-PAR3Δ1014-1043 expressed stably in NMuMG cells. β-catenin was used as loading control. Quantifications from three independent experiments and shown as average band intensity. Error bars, mean±s.e.m. (d) Representative DIC images of NMuMG cells expressing shLuc, shPar3 or shPar3 with wild-type YFP-PAR3b, YFP-PAR3bΔ(990-1018) or YFP-PAR3Δ(1014-1043) from three independent experiments. Scale bars, 50 μm. (e) Quantification of the percentage of cells dying; the graph shows mean±s.d. n=3. (f) Immunoblot showing pAkt and cleaved caspase-3 levels in NMuMG cells expressing shLuc, shPar3 or shPar3 with wild-type YFP-PAR3b, YFP-PAR3bΔ(990-10180 or YFP-PAR3Δ(1014-1043). (g) Quantification of three experiments shown in f. Error bars, mean±s.e.m. (h) Confocal images showing TJs in NMuMG and Eph4 cells. Wild-type cells or cells expressing YFP-PAR3bΔ(990-1018), or YFP-PAR3Δ(1014-1043) were transduced with shLuc or shPar3 lentivirus followed by paraformaldehyde fixation and staining with an anti-Occludin antibody. Scale bars, 20 μm. Image colours were inverted for a clearer depiction of Occludin structures. (i) E-cadherin localization in NMuMG cells expressing shPar3 with wild-type YFP-PAR3b, YFP-PAR3bΔ(990-1018) or YFP-PAR3Δ(1014-1043). Scale bars, 20 μm. The white dashed box represents the magnified region in the images. (j) Quantification of the PM/cytoplasmic ratio of E-cadherin; graph shows mean±s.d. Dotted line represents the average for shLuc expressing NMuMG cells. All experiments successfully repeated three times. P values were computed using one-way ANOVA followed by Dunnett's multiple comparison tests.
Figure 10
Figure 10. Model for the role of Par3 as an exocyst receptor.
Schematic showing the role of Par3 as an exocyst receptor and how it is the required for mammary cell survival. The magnified schematic representation shows that the positively charged lysine residues of Par3 interacts with the negatively charged phospholipids, and possibly recruits Exo70 at the site to dock exocyst onto the PM.

References

    1. Rodriguez-Boulan E. & Macara I. G. Organization and execution of the epithelial polarity programme. Nat. Rev. Mol. Cell Biol. 15, 225–242 (2014). - PMC - PubMed
    1. Shin K., Fogg V. C. & Margolis B. Tight junctions and cell polarity. Annu. Rev. Cell Dev. Biol. 22, 207–235 (2006). - PubMed
    1. Izumi Y. et al.. An atypical PKC directly associates and colocalizes at the epithelial tight junction with ASIP, a mammalian homologue of Caenorhabditis elegans polarity protein PAR-3. J. Cell Biol. 143, 95–106 (1998). - PMC - PubMed
    1. Joberty G., Petersen C., Gao L. & Macara I. G. The cell-polarity protein Par6 links Par3 and atypical protein kinase C to Cdc42. Nat. Cell Biol. 2, 531–539 (2000). - PubMed
    1. Tabuse Y. et al.. Atypical protein kinase C cooperates with PAR-3 to establish embryonic polarity in Caenorhabditis elegans. Development 125, 3607–3614 (1998). - PubMed

Publication types

MeSH terms

LinkOut - more resources