. 2017 Mar 30:8:14860.
doi: 10.1038/ncomms14860.

Allosteric cross-talk in chromatin can mediate drug-drug synergy

Affiliations

Allosteric cross-talk in chromatin can mediate drug-drug synergy

Zenita Adhireksan et al. Nat Commun. .

Abstract

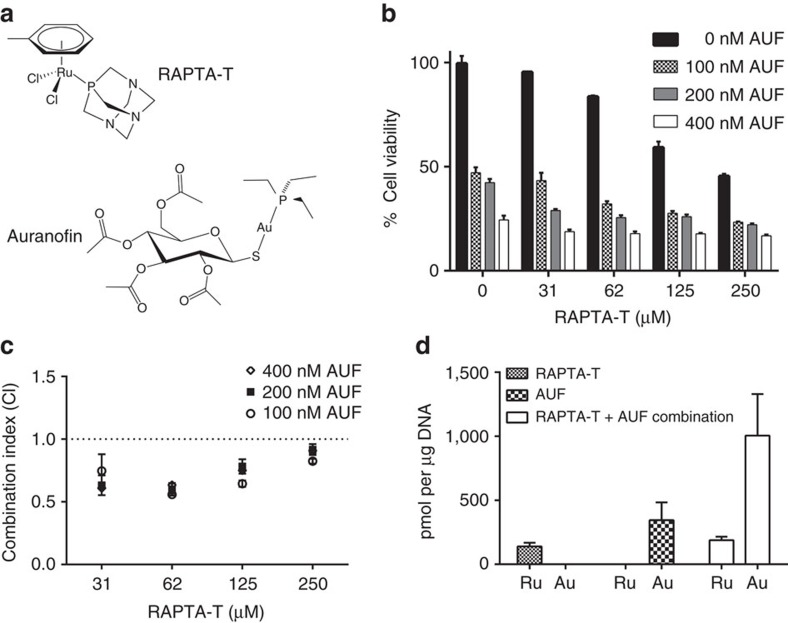
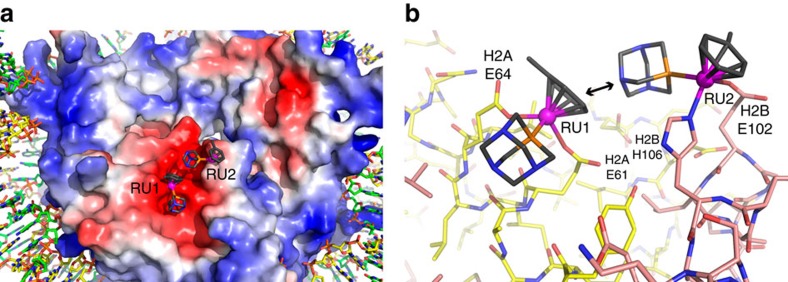
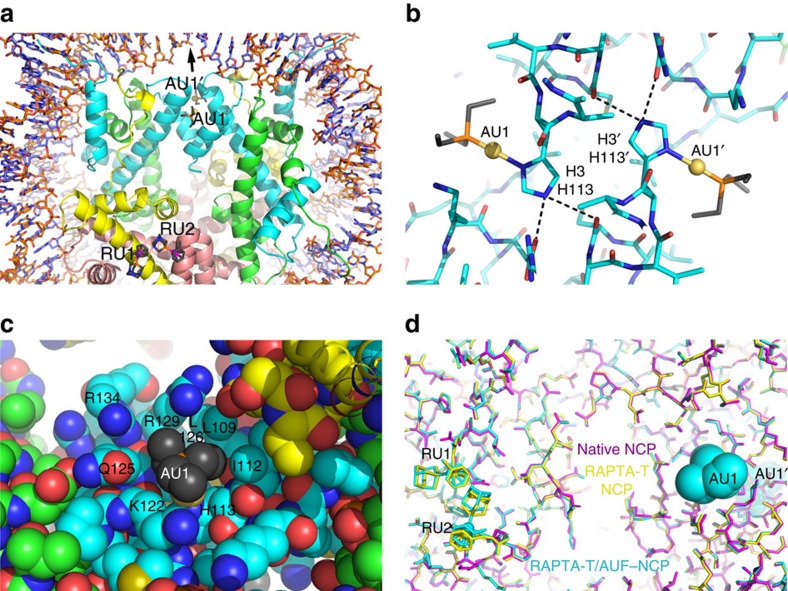
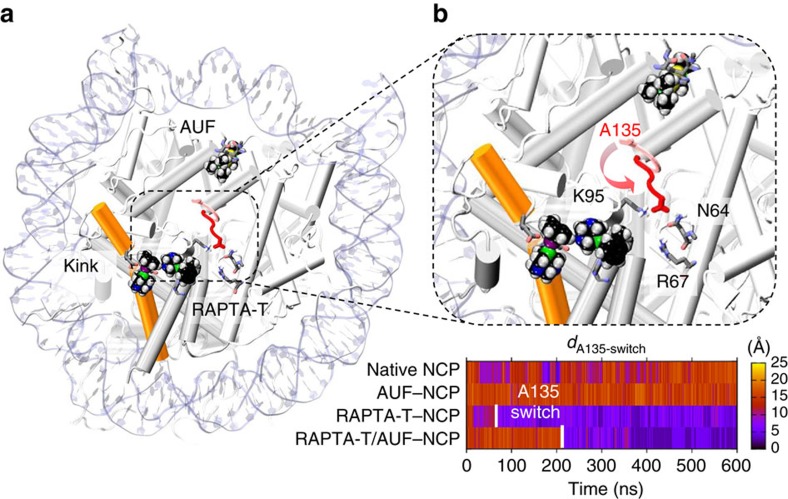
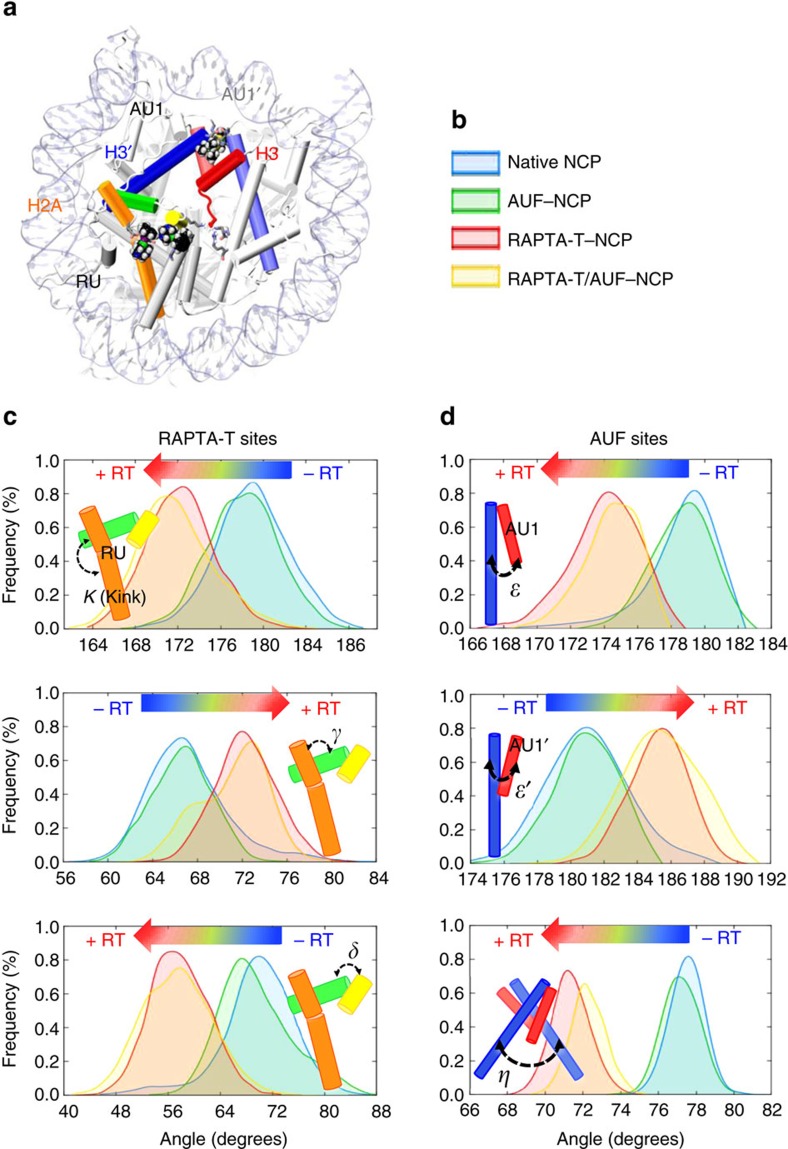
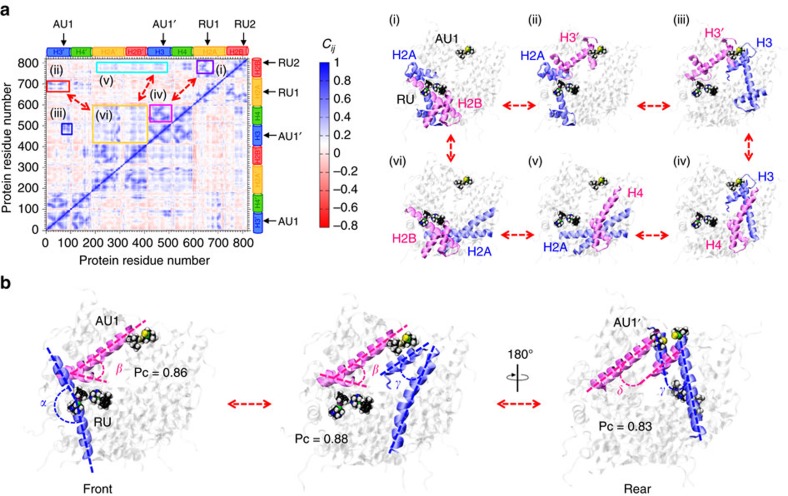
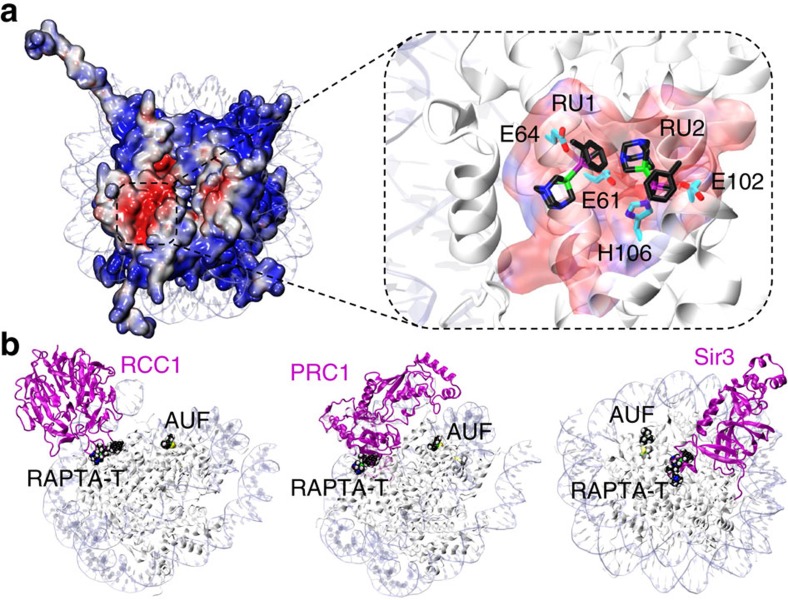
Exploitation of drug-drug synergism and allostery could yield superior therapies by capitalizing on the immensely diverse, but highly specific, potential associated with the biological macromolecular landscape. Here we describe a drug-drug synergy mediated by allosteric cross-talk in chromatin, whereby the binding of one drug alters the activity of the second. We found two unrelated drugs, RAPTA-T and auranofin, that yield a synergistic activity in killing cancer cells, which coincides with a substantially greater number of chromatin adducts formed by one of the compounds when adducts from the other agent are also present. We show that this occurs through an allosteric mechanism within the nucleosome, whereby defined histone adducts of one drug promote reaction of the other drug at a distant, specific histone site. This opens up possibilities for epigenetic targeting and suggests that allosteric modulation in nucleosomes may have biological relevance and potential for therapeutic interventions.


Conflict of interest statement

The authors declare no competing financial interests.

Figures

Figure 1
Figure 1. Synergistic activity of RAPTA-T and AUF in cancer cells.
(a) Structures of RAPTA-T and AUF. (b) Effect of combinations of RAPTA-T with AUF on cytotoxicity towards A2780 tumour cells (mean±s.d., n=3). (c) CI as a function of drug concentration (additive effect, CI=0.9–1.1; slight synergism, CI=0.7–0.9; synergism, CI=0.3–0.7; strong synergism, CI=0.1–0.3; mean±s.d., n=3). (d) Drug uptake into nucleosomes measured by ICP-MS after treatment with either RAPTA-T or AUF alone or the combination of the two (mean±s.d., n=3).
Figure 2
Figure 2. X-ray crystal structure of RAPTA-T–NCP.
(a) View of one face of the nucleosome core, with the histone octamer rendered with an electrostatic potential surface (red, negative; blue, positive). RAPTA-T binds within the extensive electronegative region on the H2A–H2B dimer, known as the acidic patch. (b) Structure of RAPTA-T-histone adducts. Ruthenium ion-coordinating side chains are labelled. H2A and H2B histone proteins are shown, respectively, with yellow and salmon coloured carbon backbones. An arrow indicates the van der Waals contact between the carrier ligands of the RU1 and RU2 adducts.
Figure 3
Figure 3. X-ray crystal structure of RAPTA-T/AUF–NCP.
(ac) Structures of AUF and RAPTA-T adduct sites. H2A, H2B, H3 and H4 histone proteins are shown respectively with yellow, salmon, cyan and green backbone colouring. (a) Overview of AUF and RAPTA-T binding, illustrating the ≥27 Å separation of the two types of adducts. The arrow indicates the pseudo-twofold symmetry axis of the nucleosome. (b) Structure of the AUF-histone adducts. Dashed lines indicate hydrogen bonding with the H3 H113 imidazole epsilon nitrogen groups. (c) The van der Waals environment of an AUF adduct, shown in space-filling representation. (d) Superposition of the native NCP (magenta), RAPTA-T–NCP (yellow) and RAPTA-T/AUF–NCP (cyan) models, illustrating that the structures of the RAPTA-T-containing models are nearly identical, whereas that of the native NCP differs subtly in the vicinity of where the adducts form.
Figure 4
Figure 4. Conformational changes induced by RAPTA-T adducts.
(a) Snapshot from MD simulations of the RAPTA-T/AUF–NCP system, showing a kink within the long α-helix of H2A induced by the presence of RAPTA-T adducts. The histone proteins (grey) are shown as cartoon, highlighting the kinked H2A α-helix in orange. The DNA is represented as pale blue ribbons. RAPTA-T and AUF (black) are shown in space-filling representation. (b) Close view of the nucleosome core, showing the conformational change involving the H3 C-terminus (A135), which occurs in the presence of RAPTA-T adducts and culminates in the H-bonding of A135 with H2A K95 and H4 N64. An arrow indicates the conformational change of H3 A135, which is shown as sticks in its initial (pink) and final (red) configurations. The bottom graph reports the time evolution along MD of the simulated systems for the distance (dA135-switch) between the Cα atom of H3 A135 and the centre of mass (COM) of the H4 N64 and H4 R67 residues, colour-coded according to the scale on the right. The A135 switch occurs after ∼80 ns (RAPTA-T/–NCP) and ∼220 ns (RAPTA-T/AUF–NCP) and is indicated with a white bar.
Figure 5
Figure 5. Histone α-helical rearrangements between the RAPTA-T and AUF adduct sites.
(a) Highlighting of dynamically coupled α-helices. (b) Colouring scheme for the different NCP systems shown in the probability distributions of panels c and d. (c,d) Probability distribution functions of the angles between the H2A (orange, green and yellow) and H3/H3′ (red, blue) α-helices that mediate an interface linking the RAPTA-T sites (c) and the AUF sites (d), calculated over the equilibrium trajectories of the native NCP (blue), AUF–NCP (green), RAPTA-T–NCP (red) and RAPTA-T/AUF–NCP (yellow) systems. A shift in the probability distributions is observed when RAPTA-T adducts are present (+RT) and is indicated with a blue-to-red arrow (−RT, adducts absent). A cartoon representation of the calculated inter-helix angles is shown within each graph, color-coded as given in the structure of the NCP in a.
Figure 6
Figure 6. Allosteric mechanism mediating cross-talk between RAPTA-T and AUF sites.
(a) Cross-correlation matrix of the fluctuations of the Cα atoms (Cij) around their mean positions, calculated over the equilibrium MD trajectory of the RAPTA-T/AUF–NCP system. The extent of correlated (0>Cij<1) and anticorrelated (−1>Cij<0) motions is color-coded according to the scale on the right. RAPTA-T (RU1/RU2) and AUF (AU1/AU1′) sites are indicated, as well as the H2A, H2B, H3 and H4 histones. Highly correlated regions are highlighted within the panels (i–vi). Histone protein components involved in the (i–vi) correlations are shown on the right. Histones are shown in cartoon representation, with correlated residues highlighted in blue and magenta. RAPTA-T and AUF are in space-filling representation. (b) Graphical representation of Pearson correlation coefficient (Pc) analysis used to compute the strength of coupling between the dynamics of the α-helices of the histones for the RAPTA-T/AUF–NCP system. The highest Pc calculated between pairs of angles formed by the adjacent histone α-helices are reported, revealing a correlation path that connects the H2A α-helix kink, occurring at the RU sites, with the AUF sites at both the front (AU1) and rear (AU1′) of the nucleosome. Blue and magenta dashed lines are used to indicate the correlated angles. The structure is rotated along the pseudo-twofold axis, showing the front face (left and middle) and rear face (right) of the NCP.
Figure 7
Figure 7. Potential for RAPTA-T and AUF adducts to interfere with nucleosome-nuclear factor interactions.
(a) Electrostatic potential (red, negative (–5 kTe–1); blue, positive (+5 kTe–1)) of the histone protein octamer in the native NCP, highlighting the H2A–H2B acidic patch (boxed region). A close-up view of the acidic patch is shown in the inset, emphasizing the central location of the RAPTA-T adducts at sites RU1 and RU2 in the RAPTA-T/AUF–NCP crystal structure. RAPTA-T (black C backbone) and coordinating protein residues (cyan C backbone) are shown as sticks. (b) NCP-on-NCP superpositions of the RAPTA-T/AUF–NCP crystal structure with those of either the regulator of chromatin condensation 1 (RCC1), polycomb repressive complex 1 (PRC1) or silent information regulator 3 (Sir3) chromatin proteins bound to the NCP (the NCP and the second chromatin factor molecule associated with the other nucleosome face in the assembly are omitted for clarity). Chromatin factors (magenta) are shown as ribbons and RAPTA-T and AUF in space-filling representation.

References

    1. Jia J. et al.. Mechanisms of drug combinations: interaction and network perspectives. Nat. Rev. Drug Discov. 8, 111–128 (2009). - PubMed
    1. Lehar J. et al.. Synergistic drug combinations tend to improve therapeutically relevant selectivity. Nat. Biotechnol. 27, 659–666 (2009). - PMC - PubMed
    1. Motlagh H. N., Wrabl J. O., Li J. & Hilser V. J. The ensemble nature of allostery. Nature 508, 331–339 (2014). - PMC - PubMed
    1. Nussinov R. & Tsai C. J. Allostery in disease and in drug discovery. Cell 153, 293–305 (2013). - PubMed
    1. Wagner J. R. et al.. Emerging computational methods for the rational discovery of allosteric drugs. Chem. Rev. 116, 6370–6390 (2016). - PMC - PubMed

Publication types