. 2017 Mar 29;543(7647):719-722.
doi: 10.1038/nature21692.

Mapping of a non-spatial dimension by the hippocampal-entorhinal circuit

Affiliations

Mapping of a non-spatial dimension by the hippocampal-entorhinal circuit

Dmitriy Aronov et al. Nature. .

Abstract

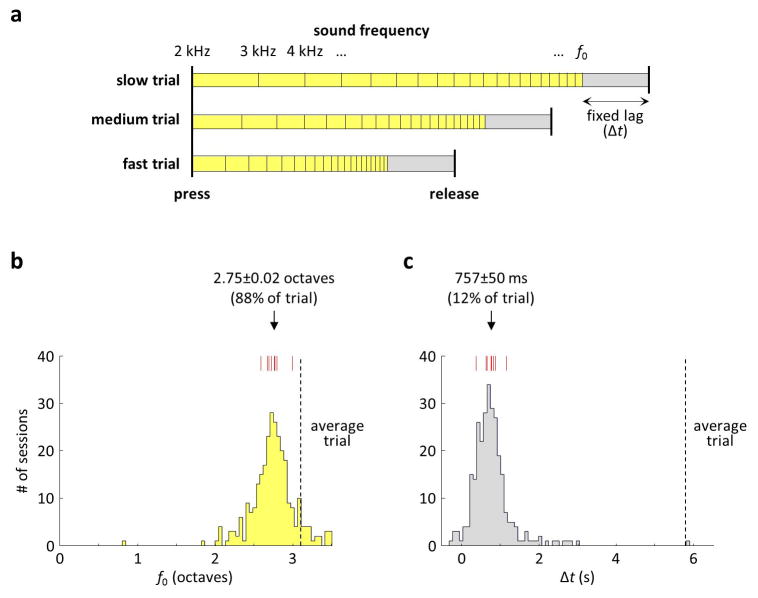
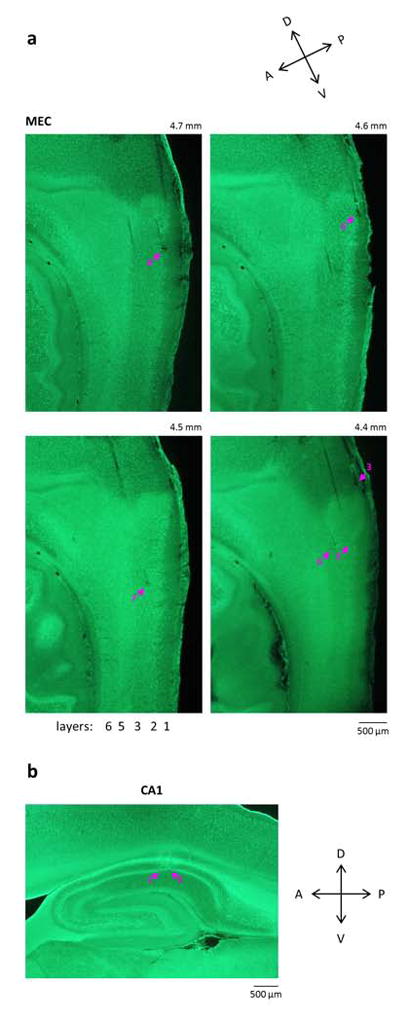
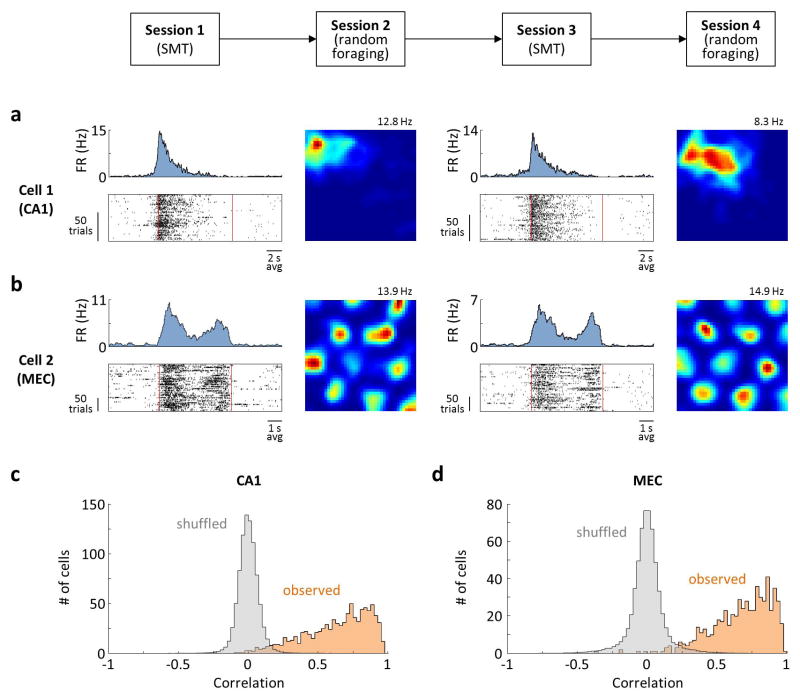
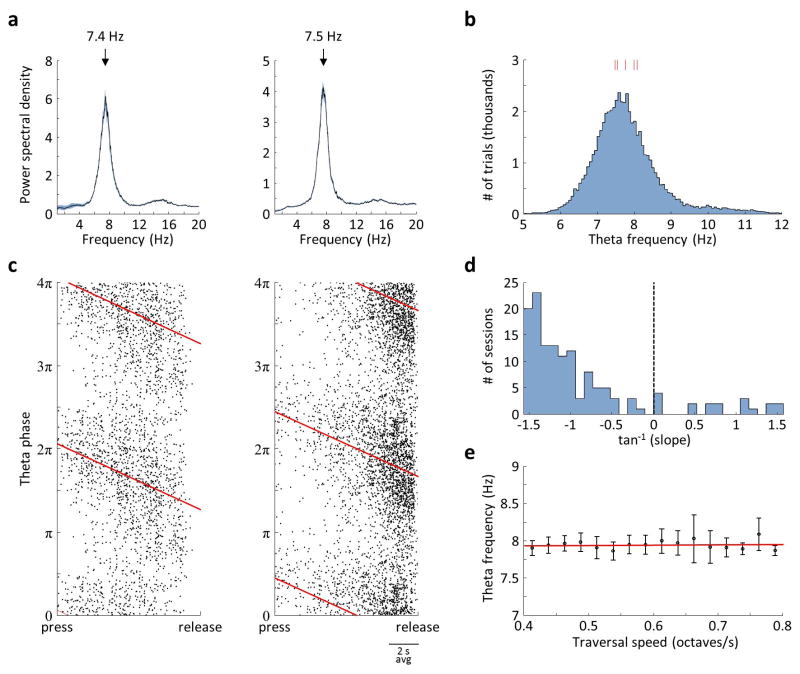
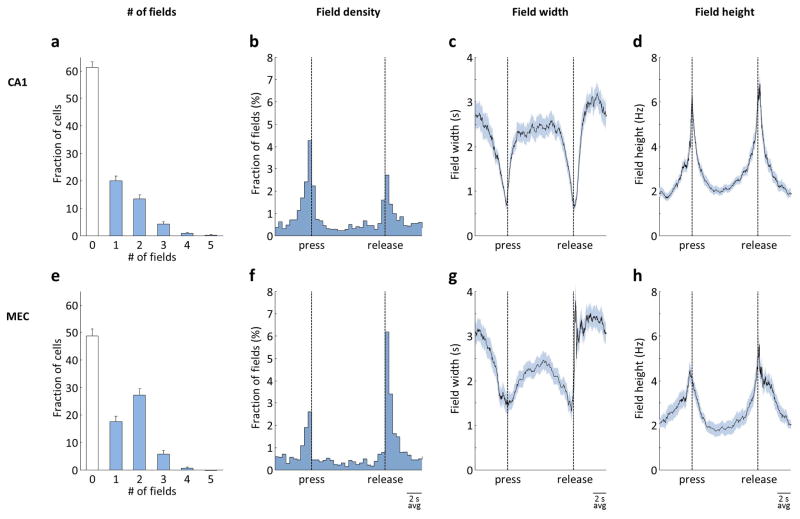
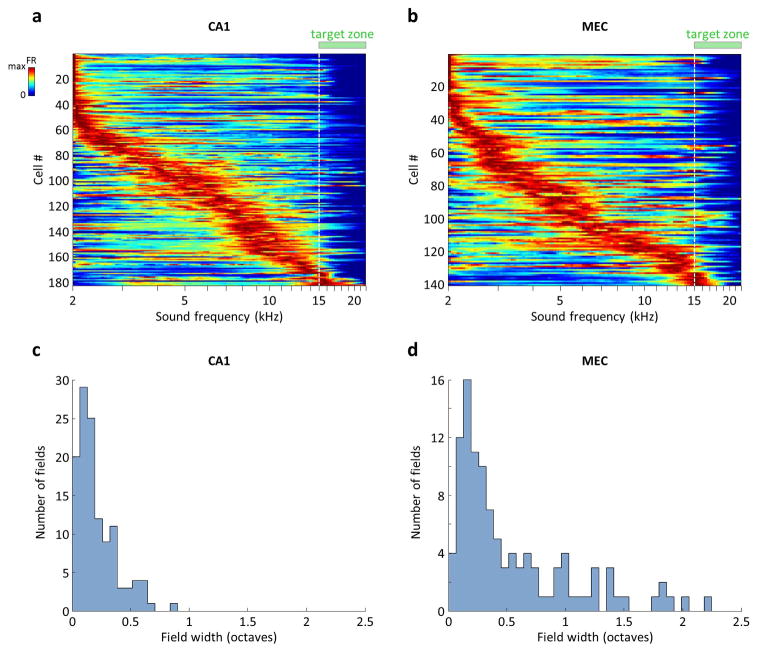
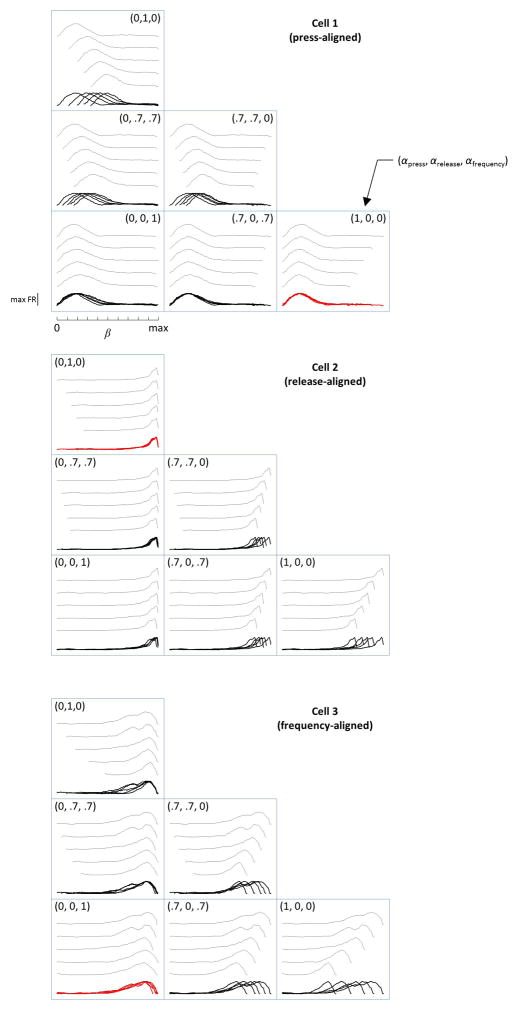
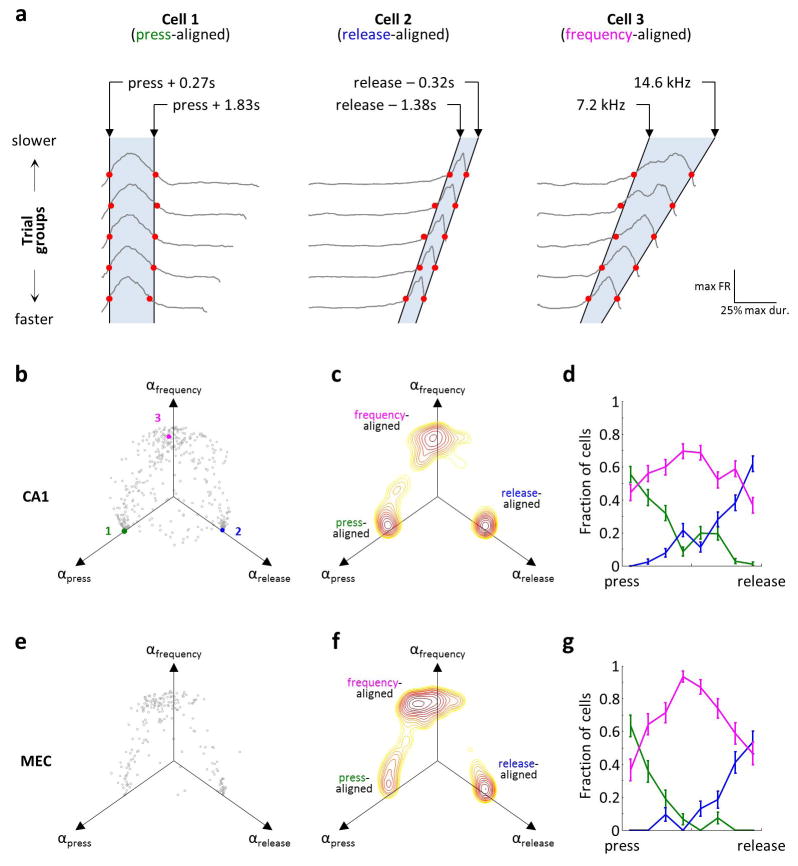
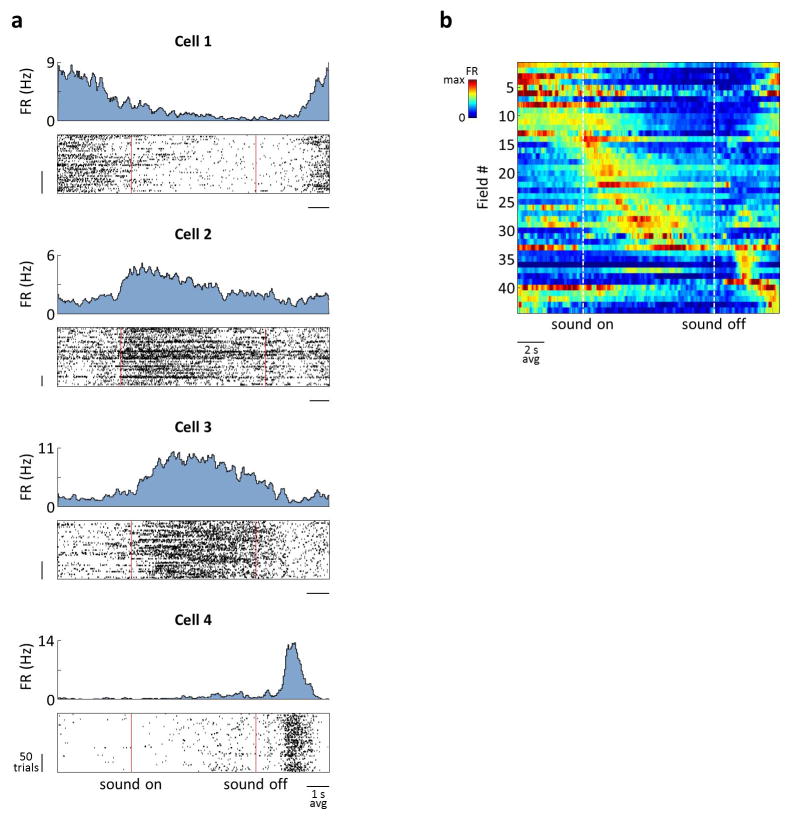
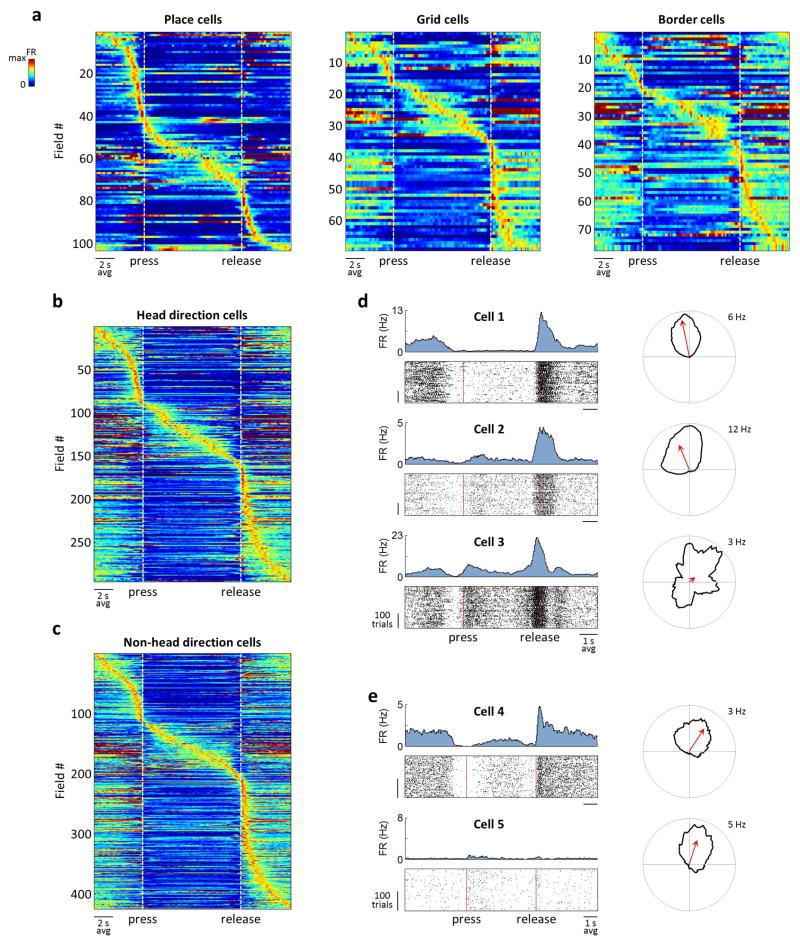
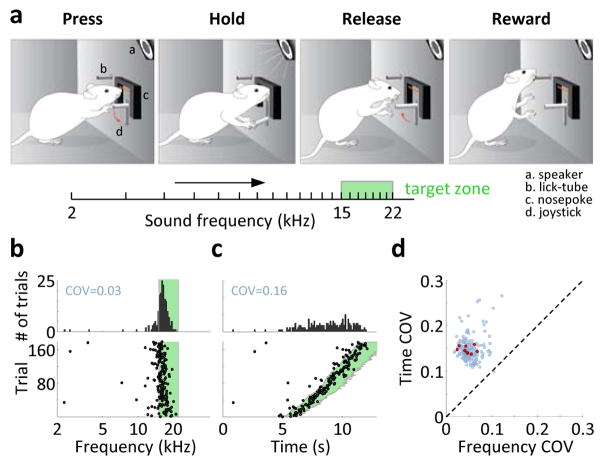
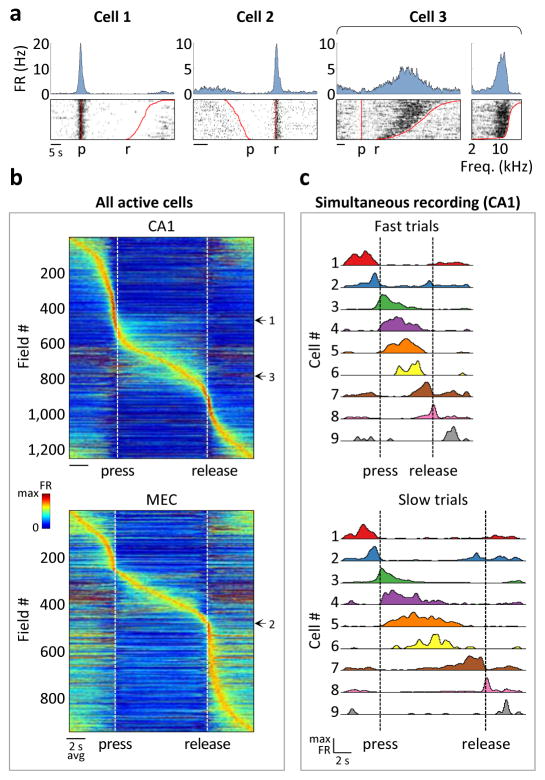
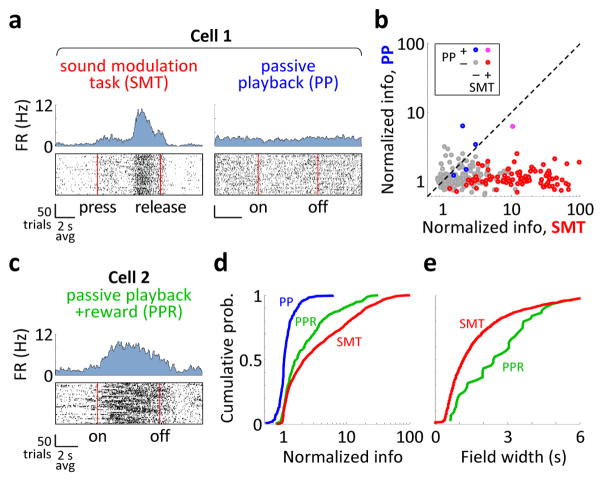
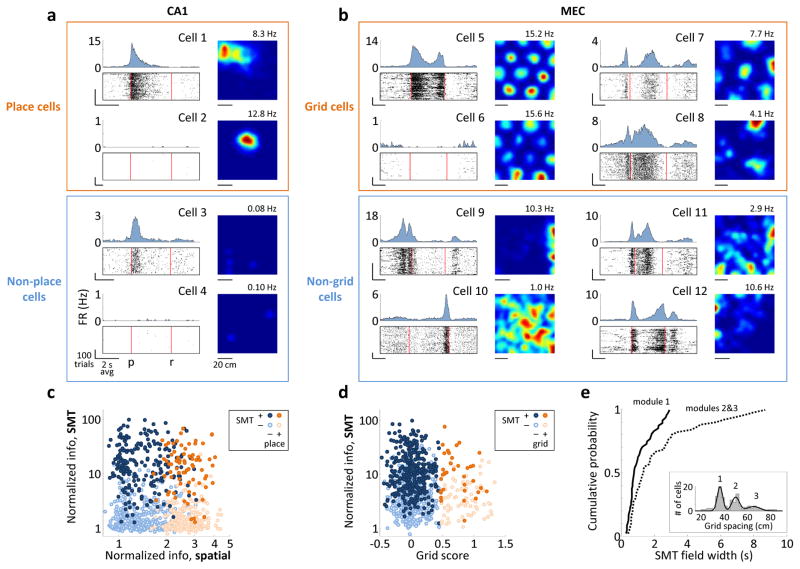
During spatial navigation, neural activity in the hippocampus and the medial entorhinal cortex (MEC) is correlated to navigational variables such as location, head direction, speed, and proximity to boundaries. These activity patterns are thought to provide a map-like representation of physical space. However, the hippocampal-entorhinal circuit is involved not only in spatial navigation, but also in a variety of memory-guided behaviours. The relationship between this general function and the specialized spatial activity patterns is unclear. A conceptual framework reconciling these views is that spatial representation is just one example of a more general mechanism for encoding continuous, task-relevant variables. Here we tested this idea by recording from hippocampal and entorhinal neurons during a task that required rats to use a joystick to manipulate sound along a continuous frequency axis. We found neural representation of the entire behavioural task, including activity that formed discrete firing fields at particular sound frequencies. Neurons involved in this representation overlapped with the known spatial cell types in the circuit, such as place cells and grid cells. These results suggest that common circuit mechanisms in the hippocampal-entorhinal system are used to represent diverse behavioural tasks, possibly supporting cognitive processes beyond spatial navigation.


Conflict of interest statement

The authors declare no competing financial interests.

Figures

Extended Data Figure 1
Extended Data Figure 1. Behavioral model
a) Model that tests whether joystick releases depended on sound frequency, the amount of elapsed time, or a combination of the two. Joystick release times are predicted at a fixed time lag (Δt) relative to the occurrence of a fixed sound frequency (f0). Schematic shows three trials that have different speeds of frequency traversal. Frequency f0 occurs at different times relative to the press of the joystick across these trials. However, the time lag is constant. b) Model fits of the frequency component f0 across all 189 behavioral sessions in 9 rats. Red marks: median values for each of the rats. This frequency component accounted for most of the trial; indicated number is the median ± s.e.m. across rats. c) Model fits of the time lag component Δt across all behavioral sessions. This time lag component accounted for a small fraction of the trial; the lag might be largely explained by the expected reaction time (e.g., 100–200 ms in pure-tone auditory discrimination tasks Jaramillo and Zador 2011, Nature Neuroscience) and the mechanics of the joystick (300–400 ms). In other words, the behavior was consistent with the rats responding to a frequency of ~13.5 kHz (just prior to start of the target zone at 15 kHz), resulting in a detectable release of the joystick ~750 ms later.
Extended Data Figure 2
Extended Data Figure 2. Histological verification of tetrode positions
a) Representative fluorescent Nissl-stained parasagittal sections of MEC from one animal, ordered from the lateral-most to the medial-most section; the approximate mediolateral position of each section is indicated. Arrows indicate tetrode tip locations. Five of the shown tetrodes (with the exception of 3) had parts of their tracks in layers 2 and/or 3. Task-modulated cells in the SMT and grid cells during random foraging were found on all of these tetrodes. b) Representative parasagittal section of the hippocampus, showing two tetrodes in the CA1 pyramidal cell layer. Task-modulated cells during the passive playback + reward task were found on both of these tetrodes.
Extended Data Figure 3
Extended Data Figure 3. Stability of firing
a) Activity of a CA1 place cell on interleaved SMT and random foraging sessions. Data are plotted as in Fig. 4. Sessions immediately followed one another. Sessions 1 and 3 were 30 min long each, while sessions 2 and 4 were 15 min long each. b) Activity on an MEC grid cell, plotted as in (a). Sessions 1 and 3 were 1 h long each, while sessions 2 and 4 were 20 min long each. Session 2 and 4 immediately followed sessions 1 and 3, respectively. The starts of sessions 1 and 3 were separated by 24 h. c) Summary of the stability across all 882 SMT-modulated CA1 cells. For each cell, the Pearson correlation is measured between the PSTHs from the first halves of the SMT sessions and the second halves of the sessions. Orange: distribution of correlation values across cells. Gray: distribution of correlation values computed after shuffling spike times, averaged across 100 shuffles. d) Summary of the data from 597 MEC cells, plotted as in (c). In CA1 and MEC, 95.7% and 97.2% of the cells has higher correlation values than in the shuffled data (p<0.01), respectively.
Extended Data Figure 4
Extended Data Figure 4. Analysis of theta modulation
a) Examples of power spectral density (PSD) plots from two CA1 cells, showing a prominent theta oscillation. Black trace: median across trials. Shaded area: ± estimated s.e.m. across trials. Position of the peak in the median PSD is indicated. b) Distribution of theta frequencies across all 56496 trials in 5 rats with CA1 recordings. Red marks: median values for each of the rats. c) Phases of theta at which spikes were fired by the same neurons as in (a), showing theta phase precession. Black dots: individual spikes plotted in time (linearly warped between the press and the release of the joystick) and theta phase. Each spike is plotted twice with a 2π phase offset. Red line: linear regression fit to the data. d) Slopes of the regression fits, quantified in (c), for all 138 CA1 cells that had a significant correlation (p<0.01) between theta phase and warped time. Negative slope indicates forward phase precession, as is typically observed during spatial navigation. e) Frequency of theta oscillations quantified across trials that had different average “speeds” of sound frequency traversal in the SMT. Symbols: mean ± s.e.m. across rats. Red line: linear regression fit; the slope of the fit was not significantly different from 0 (p = 0.70). Unlike in spatial navigation, theta frequency did not correlate to speed; this may imply that the relationship between theta and speed during navigation is dependent on locomotion-related signals.
Extended Data Figure 5
Extended Data Figure 5. Statistics of firing fields in the SMT
a) Number of firing fields per cell for all 2208 CA1 cells. Error bars: 95% multinomial confidence intervals. The count includes fields before joystick press and after joystick release. However, MEC cells did occasionally have more than one field even during sound presentation (e.g. cell 5 in Fig. 4b). b) Distribution of all 1252 CA1 firing fields throughout the SMT. Each field is assigned a time according to the time of occurrence of it maximum firing rate. Time is linearly warped between the press and the release of the joystick. c) Field width as a function of field time within the task. Fields were sorted by their time in the task, and a rolling window of 100 fields was applied. The average field time within the task and the average field width were measured in this window (black trace). Blue band: s.e.m. of field width within the rolling window. d) Field height (peak firing rate) as a function of field time within the task. Data are plotted as in (c). Fields were concentrated near the press and the release of the joystick and were narrower during these time. (e–h) Statistics in MEC for 943 fields in 1164 cells, plotted as in (a–d). MEC tended to have more fields/cell than CA1, but otherwise had similar statistics. A tightening of firing fields in the vicinity of joystick presses and releases may be due to a higher density of available sensory cues during these events. Alternatively, field tightening may result from the stronger salience of these events compared to the rest of the task.
Extended Data Figure 6
Extended Data Figure 6. CA1 and MEC cells form sequences of activity along the sound frequency axis
a) Firing rates of all 183 CA1 cells with at least one firing field in the SMT that was confined to the sound presentation period (between the press and the release of the joystick). Each row corresponds to one cell and is normalized by the maximum firing rate during the sound presentation period. Rows are sorted according to the frequency at which the maximum firing rate occurred. Each trial was binned into 150 frequency bins, which could vary in duration both within a trial and across trials. The firing rate was calculated separately in each bin using that bin’s duration, the firing rates were averaged across trials and smoothed with a 3-point square window. Note that fields in the SMT did not progressively broaden during the delay period, as they typically do in time cells; this may be due to the fact that an informative sensory variable (sound frequency) was always available to the animal, preventing a drift in the neural code. b) Firing rates of 141 MEC cells, calculated and plotted as in (a). c) Distribution of CA1 firing field widths, only for those 122 cells that were identified as “frequency-aligned” by the electrophysiology model (Extended Data Fig. 8). Note that the entire trial was on average 3.1 octaves. d) Distribution of 109 MEC firing field widths, plotted as in (c). Note that the longer tail compared to the CA1 data is partially due to grid cells from modules with wide spacing (Fig. 4e).
Extended Data Figure 7
Extended Data Figure 7. Model for characterizing the alignment of neural activity to different task events in the SMT
Gray traces: PSTHs across trials, sorted by duration into 5 groups. The same traces are overlaid below (black or red). For each cell, the six subplots are for different values of the three parameters (αpress, αrelease, αfrequency), indicated in the corner of each subplot). For each subplot, PSTHs are plotted as a function of β, defined as β=αpresst^press+αreleaset^release+αfrequencyf^where press is the normalized time relative to the press of the joystick, release is the normalized time relative to the release of the joystick, and is the normalized sound frequency. For each cell, the subplot with the strongest alignment of PSTHs across trials is emphasized by red traces.
Extended Data Figure 8
Extended Data Figure 8. Activity aligns to different task features in the SMT
a) Traces: PSTHs across trials, sorted by duration into 5 groups. Each PSTH is normalized to its maximum. Red dots: 30% of maximum. Black lines: values of joystick press-aligned time tpress (cell 1), joystick release-aligned time trelease (cell 2) or sound frequency f (cell 3) that best fit the red symbols. These fits are for illustration purposes; the actual model maximized the cross-correlation of PSTHs by aligning them to a linear combination of tpress, trelease, and f. Cells shown are the same as in Extended Data Fig. 7. b) Fits of the model to all firing fields produced CA1 neurons. Axes are coefficients indicating the relative contribution of tpress, trelease, and f to the optimal alignment of PSTHs. c) Contour plot of the density of points in (b), illustrating 3 clusters. d) Distribution of fields belonging to each of the 3 clusters in (c) throughout the task. Time is linearly warped between the press and the release of the joystick. Error bars: 95% multinomial confidence intervals. Across all 411 fields from 341 recorded CA1 neurons with a peak of a firing field occurring during the sound presentation period, press-aligned, release-aligned, and frequency-aligned fields accounted for 26%, 23% and 51% of the population, respectively. (e–f) Same plots as in (b–d), but for 213 firing fields produced by 186 MEC neurons. In MEC, there was a larger fraction of frequency-aligned fields (17%, 20% and 63% for the three types; p<0.01 χ2 test for comparison to CA1). The three clusters in were not perfectly separated; in fact, some firing fields had significantly non-zero regression coefficients for more than one task parameter: 14% in CA1 and 21% in MEC (p<0.01, bootstrap analysis).
Extended Data Figure 9
Extended Data Figure 9. Activity of CA1 neurons in the passive playback experiments in which rats received a reward at the end of the sound sweep (PPR task)
a) Four examples of neurons in the PPR task, plotted as in Fig. 3. Firing fields spanned the entire behavioral task, but were wider than in the SMT, except possibly near the reward (e.g. cell 4). b) Activity of all 44 cells whose firing rates were significantly modulated in the PPR task, plotted as in Fig. 2. Of the 21 cells that had firing fields during sound presentation, the fields of 14 were better aligned to sound frequency than to other task parameters.
Extended Data Figure 10
Extended Data Figure 10. Overlap between spatial cell types and the SMT-modulated population
a) Activity of spatial cell types that were also SMT-modulated. All plots are as in Fig. 2. (b–e) Head direction (HD) cells overlap with SMT-modulated neurons, but do not fully account for firing rate modulations in the SMT. This analysis was performed to account for the possibility that some SMT firing was due to subtle changes in HD in the nosepoke or between the nosepoke and the lick-tube. a) Activity of all HD cells that were also modulated in the SMT. b) Activity of all non-HD cells that were also modulated in the SMT. c) Activity of three MEC cells in one rat. Cells 1 and 2 were simultaneously recorded. Left: Activity in the SMT, plotted as in Fig. 3. Right: Firing rate as a function of HD during random foraging, plotted in polar coordinates. Each firing rate is scaled to its maximum, which is indicated. Arrow: vector average of the HD tuning curve. All three cells have a firing field at the release of the joystick. However, although cells 1 and 2 have similar HD selectivity, cell 3 is not a HD cell, suggesting that the firing field cannot be explained by HD selectivity. d) Activity of two simultaneously recorded MEC cells, plotted as in (c). Although the cells have similar HD selectivity, they have highly dissimilar firing in the SMT. Total number of cells recorded in both tasks was 918 in CA1 and 881 in MEC, including 290 and 379 SMT-modulated cells, respectively. In CA1, there were 295 place cells, and in MEC there were 105 grid cells, 68 border cells, and 321 HD cells. Overlaps of these cell types with SMT-modulated cells contained 74, 36, 42, and 163 cells, producing 104, 69, 78, and 295 firing fields, respectively.
Figure 1
Figure 1. Sound modulation task
a) Schematic of the SMT. Rat deflects a joystick to increase sound frequency and must release it in a target zone. b) Frequencies at which the joystick was released on individual trials (bottom), and the distribution of these frequencies across trials (top). Most releases occurred early in the target zone (green). COV: coefficient of variation of the distribution. c) Same data, but plotted as a function of time. The COV indicates a bigger spread of the distribution. d) COV values of frequencies and times at the joystick release across all 189 sessions from 9 rats (blue). Red: median values across sessions for each of the rats.
Figure 2
Figure 2. CA1 and MEC activity in the SMT
a) Cells that were active during the joystick press (cell 1) and release (cell 2) and during sound presentation (cell 3). Top: PSTHs. Bottom: Spike raster plots, aligned to the press and sorted by trial duration. For cell 3, the same spiking data is also plotted as a function of frequency, with trials sorted by the frequency at the joystick release. FR: firing rate; p: press; r: release. b) Firing rates of all SMT-modulated cells across rats – 882 cells of 2208 total for CA1 and 596 cells of 1164 total for MEC. Each row corresponds to a field; cells with multiple fields are included more than once. Time is linearly warped in order to average trials of different durations. Each row is normalized to the maximum firing rate of the field to which it is aligned, and rows are sorted by field time. Color scale is from 0 to 1.5, accommodating fields other than the one used for alignment. Individual examples from (a) are marked. c) PSTHs of simultaneously-recorded neurons, averaged separately across trials of different durations. The sequence of activity expands and contracts with trial duration.
Figure 3
Figure 3. Activity depends on the behavioral context
a) Activity of the same CA1 neuron in the SMT and during passive playback (PP) of acoustic stimuli that matched those in the SMT. Top: PSTHs. Bottom: Raster plots, with time linearly warped between the press and the release of the joystick. FR: firing rate; on: sound onset; off: sound offset. b) Firing rate modulations of all 295 CA1 neurons recorded in the SMT and PP. ‘Normalized information’ is the mutual information between spikes and the phase of the task, divided by the average value from samples with shuffled spike timing. Points are colored according to whether the cell’ was SMT-modulated and whether it was modulated by PP. c) Activity of a neuron during passive playback of acoustic stimuli that were followed by rewards (PPR). d) Cumulative histograms of the normalized information in the three tasks (295 cells for SMT and PP and 248 cells for PPR). e) Cumulative histograms of the field durations in the SMT and the PPR. Activity shows progressively stronger and temporally precise task modulation in the PP, PPR, and SMT tasks.
Figure 4
Figure 4. SMT-modulated and spatially-modulated cells overlap
a) Activity of CA1 cells in the SMT (left), plotted as in Fig. 3. Right: spatial firing rate maps for random foraging; the maximum firing rate is indicated. Cells 2 and 4 were silent in the SMT; cells 3 and 4 were silent during foraging. All firing rate scales are from 0 Hz to the nearest integer number of Hz above the maximum firing rate. FR: firing rate; p: press; r: release. b) Activity of MEC grid cells in the two tasks. Cells 5 and 6 are from module 1 in the same rat and are plotted on the same firing rate scale. Only cell 5 was active in the SMT. Cells 7 and 8 are from modules 2 and 3, respectively. Cell 9 is a border cell. c) Normalized information of all 918 CA1 cells during the SMT, as in Fig. 3, plotted against normalized spatial information – the mutual information between spikes and the location, divided by the average value from samples with shuffled spike timing. Points are colored and shaded according to whether the cell was a place cell and whether it was SMT-modulated. Information values in the two tasks are not expected to be similar due to different task structures. d) Normalized information of all 881 MEC cells during the SMT task plotted against the cells’ grid scores. Points are colored and shaded according to whether the cell was a grid cell and whether it was SMT-modulated. e) Cumulative histograms of the average field width for all 48 grid cells in module 1 and all 51 grid cells in modules 2/3. Groups were separated at 42 cm. Inset: Distribution of grid spacings across cells and a mixture of 3 Gaussians fit to the distribution. Peaks corresponding to modules 1–3 are numbered.

Comment in

Similar articles

Cited by

References

    1. O’Keefe J, Dostrovsky J. The hippocampus as a spatial map. Preliminary evidence from unit activity in the freely-moving rat. Brain research. 1971;34:171–175. - PubMed
    1. Hafting T, Fyhn M, Molden S, Moser MB, Moser EI. Microstructure of a spatial map in the entorhinal cortex. Nature. 2005;436:801–806. doi: 10.1038/nature03721. - DOI - PubMed
    1. Sargolini F, et al. Conjunctive representation of position, direction, and velocity in entorhinal cortex. Science. 2006;312:758–762. doi: 10.1126/science.1125572. - DOI - PubMed
    1. Kropff E, Carmichael JE, Moser MB, Moser EI. Speed cells in the medial entorhinal cortex. Nature. 2015;523:419–424. doi: 10.1038/nature14622. - DOI - PubMed
    1. Solstad T, Boccara CN, Kropff E, Moser MB, Moser EI. Representation of geometric borders in the entorhinal cortex. Science. 2008;322:1865–1868. doi: 10.1126/science.1166466. - DOI - PubMed

Publication types