Oxidative Stress-Induced Afterdepolarizations and Protein Kinase C Signaling
- PMID: 28358314
- PMCID: PMC5412274
- DOI: 10.3390/ijms18040688
Oxidative Stress-Induced Afterdepolarizations and Protein Kinase C Signaling
Abstract
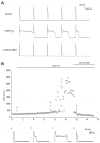
Background: Hydrogen peroxide (H₂O₂)-induced oxidative stress has been demonstrated to induce afterdepolarizations and triggered activities in isolated myocytes, but the underlying mechanisms remain not fully understood. We aimed to explore whether protein kinase C (PKC) activation plays an important role in oxidative stress-induced afterdepolarizations.
Methods: Action potentials and ion currents of isolated rabbit cardiomyocytes were recorded using the patch clamp technique. H₂O₂ (1 mM) was perfused to induce oxidative stress and the specific classical PKC inhibitor, Gö 6983 (1 μM), was applied to test the involvement of PKC.
Results: H₂O₂ perfusion prolonged the action potential duration and induced afterdepolarizations. Pretreatment with Gö 6983 prevented the emergence of H₂O₂-induced afterdepolarizations. Additional application of Gö 6983 with H₂O₂ effectively suppressed H₂O₂-induced afterdepolarizations. H₂O₂ increased the late sodium current (INa,L) (n = 7, p < 0.01) and the L-type calcium current (ICa,L) (n = 5, p < 0.01), which were significantly reversed by Gö 6983 (p < 0.01). H₂O₂ also increased the transient outward potassium current (Ito) (n = 6, p < 0.05). However, Gö 6983 showed little effect on H₂O₂-induced enhancement of Ito.
Conclusions: H₂O₂ induced afterdepolarizations via the activation of PKC and the enhancement of ICa,L and INa,L. These results provide evidence of a link between oxidative stress, PKC activation and afterdepolarizations.
Keywords: afterdepolarization; arrhythmia; oxidative stress; protein kinase C; triggered activity.
Conflict of interest statement
The authors declare no conflict of interest.
Figures


Similar articles
-
Inhibition of cardiac potassium currents by oxidation-activated protein kinase A contributes to early afterdepolarizations in the heart.Am J Physiol Heart Circ Physiol. 2020 Dec 1;319(6):H1347-H1357. doi: 10.1152/ajpheart.00182.2020. Epub 2020 Oct 9. Am J Physiol Heart Circ Physiol. 2020. PMID: 33035439 Free PMC article.
-
Repolarization reserve evolves dynamically during the cardiac action potential: effects of transient outward currents on early afterdepolarizations.Circ Arrhythm Electrophysiol. 2015 Jun;8(3):694-702. doi: 10.1161/CIRCEP.114.002451. Epub 2015 Mar 14. Circ Arrhythm Electrophysiol. 2015. PMID: 25772542 Free PMC article.
-
Sevoflurane protects ventricular myocytes against oxidative stress-induced cellular Ca2+ overload and hypercontracture.Anesthesiology. 2013 Sep;119(3):606-20. doi: 10.1097/ALN.0b013e318292ee52. Anesthesiology. 2013. PMID: 23571639
-
Protective effect of piperine on electrophysiology abnormalities of left atrial myocytes induced by hydrogen peroxide in rabbits.Life Sci. 2014 Jan 17;94(2):99-105. doi: 10.1016/j.lfs.2013.10.024. Epub 2013 Nov 1. Life Sci. 2014. PMID: 24184297
-
Role of oxidants on calcium and sodium movement in healthy and diseased cardiac myocytes.Free Radic Biol Med. 2013 Oct;63:338-49. doi: 10.1016/j.freeradbiomed.2013.05.035. Epub 2013 Jun 1. Free Radic Biol Med. 2013. PMID: 23732518 Review.
Cited by
-
Macrophages facilitate post myocardial infarction arrhythmias: roles of gap junction and KCa3.1.Theranostics. 2019 Aug 14;9(22):6396-6411. doi: 10.7150/thno.34801. eCollection 2019. Theranostics. 2019. PMID: 31588225 Free PMC article.
-
The Nrf2 Pathway in Liver Diseases.Front Cell Dev Biol. 2022 Feb 10;10:826204. doi: 10.3389/fcell.2022.826204. eCollection 2022. Front Cell Dev Biol. 2022. PMID: 35223849 Free PMC article. Review.
-
The transient receptor potential melastatin 4 channel inhibitor 9-phenanthrol modulates cardiac sodium channel.Br J Pharmacol. 2018 Dec;175(23):4325-4337. doi: 10.1111/bph.14490. Epub 2018 Oct 14. Br J Pharmacol. 2018. PMID: 30153324 Free PMC article.
-
Aged gut microbiota promotes arrhythmia susceptibility via oxidative stress.iScience. 2024 Sep 4;27(10):110888. doi: 10.1016/j.isci.2024.110888. eCollection 2024 Oct 18. iScience. 2024. PMID: 39381749 Free PMC article.
-
X-rays Stimulate Granular Secretions and Activate Protein Kinase C Signaling in Human Platelets.Curr Issues Mol Biol. 2023 Jul 19;45(7):6024-6039. doi: 10.3390/cimb45070380. Curr Issues Mol Biol. 2023. PMID: 37504296 Free PMC article.
References
MeSH terms
Substances
LinkOut - more resources
Full Text Sources
Other Literature Sources
Miscellaneous

