. 2017 Mar 30;8(3):e2709.
doi: 10.1038/cddis.2017.130.

Functional inhibition of acid sphingomyelinase by Fluphenazine triggers hypoxia-specific tumor cell death

Affiliations

Functional inhibition of acid sphingomyelinase by Fluphenazine triggers hypoxia-specific tumor cell death

Saskia Klutzny et al. Cell Death Dis. .

Abstract

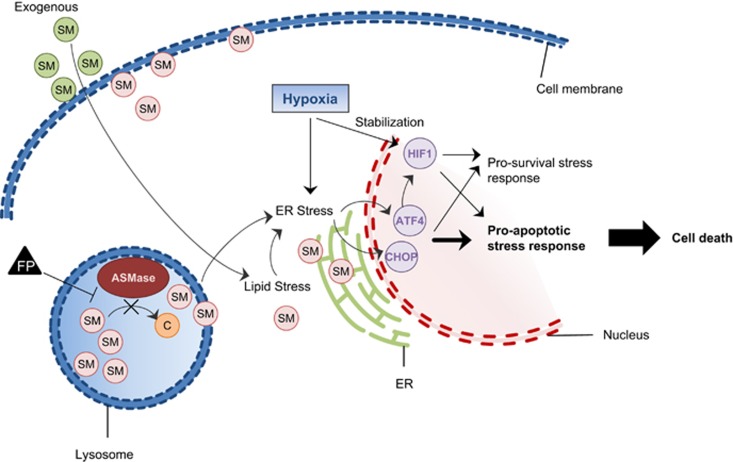
Owing to lagging or insufficient neo-angiogenesis, hypoxia is a feature of most solid tumors. Hypoxic tumor regions contribute to resistance against antiproliferative chemotherapeutics, radiotherapy and immunotherapy. Targeting cells in hypoxic tumor areas is therefore an important strategy for cancer treatment. Most approaches for targeting hypoxic cells focus on the inhibition of hypoxia adaption pathways but only a limited number of compounds with the potential to specifically target hypoxic tumor regions have been identified. By using tumor spheroids in hypoxic conditions as screening system, we identified a set of compounds, including the phenothiazine antipsychotic Fluphenazine, as hits with novel mode of action. Fluphenazine functionally inhibits acid sphingomyelinase and causes cellular sphingomyelin accumulation, which induces cancer cell death specifically in hypoxic tumor spheroids. Moreover, we found that functional inhibition of acid sphingomyelinase leads to overactivation of hypoxia stress-response pathways and that hypoxia-specific cell death is mediated by the stress-responsive transcription factor ATF4. Taken together, the here presented data suggest a novel, yet unexplored mechanism in which induction of sphingolipid stress leads to the overactivation of hypoxia stress-response pathways and thereby promotes their pro-apoptotic tumor-suppressor functions to specifically kill cells in hypoxic tumor areas.


Conflict of interest statement

All authors are employees of Bayer AG.

Figures

Figure 1
Figure 1
HCT116 tumor spheroids incubated in hypoxia mimic hypoxic tumor regions distal from blood vessels in HCT116 xenografts. (a) IHC staining of HCT116 colon cancer xenograft tumor sections. HCT116 tumor cryosections were stained for the exogenous hypoxia marker pimonidazole (Hypoxyprobe, green), CD31 as marker for blood vessel (red) and the nuclear marker Hoechst (blue). Arrows indicate blood vessels. N=necrotic region. Dashed line showing region for measuring intensity profile in panel (b). Scale bar 100 μm. (b) Line scan (dashed line in panel (a)) through HCT116 tumor section showing intensity profile of pimonidazole and CD31 staining. (c) Cryosections of HCT116 spheroids. Spheroids were treated for 3 days in normoxia or hypoxia with or without the complex III inhibitor Antimycin (200 nM). Nuclei were stained by Hoechst (blue) and hypoxic areas with anti-pimonidazole (green). Scale bar 100 μm. (d) Intensity profile pimonidazole staining (average of multiple spheroids, n=5–10) from spheroid border to spheroid core region of HCT116 spheroids. (e) Western blotting analysis of HCT116 spheroids incubated for 24 h in normoxia or hypoxia. Beta-actin was used as an internal control. Representative data of multiple experiments shown (n=3). (f) Real-time quantitative PCR gene expression analysis of HIF target genes in HCT116 spheroids incubated for 24 h in normoxia or hypoxia. Ct values of each sample were normalized with the internal control RPL32 and normalized to the normoxia sample. Bars show mean with S.D. (n=3). **** = P-value smaller 0.0001
Figure 2
Figure 2
High-content screen on HCT116 spheroids identifies hypoxia-sensitizing compounds. HCT116 spheroids were grown for 4 days in normoxic conditions, followed by 3 days of compound treatment (DMSO control, Staurosporine 10 μM or Trifluoperazine 5 μM) in normoxia, hypoxia or hypoxia+Antimycin 200 nM. Spheroid nuclei were stained with Hoechst (red) and dead cells were stained with SytoxGreen (green). Hypoxia-sensitizing compound Trifluoperazine specifically induces cell death in spheroids cultured under hypoxia. Representative images of multiple experiments shown (n≥3). Scale bar 100 μm
Figure 3
Figure 3
Fluphenazine induces lysosomal stress and inhibits ASMase. (ac) HCT116 cells were treated for 24 h with either DMSO control or 5 μM Fluphenazine. Cells were either stained for (a) lysosome marker Lamp2 (b) for acidic vesicles using Lysotracker or (c) for the accumulation of undigested phospholipids using the LipidTOX phospholipidosis staining. Nuclei were stained with Hoechst. Quantification of stainings shown on right hand side. Bars show mean with S.D. (n=3). **** = P-value smaller 0.0001. Scale bar 10 μm. (d) Metabolomics analysis of 188 endogenous metabolites identifies the accumulation of SMs in Fluphenazine-treated cells. For full profile, please see Supplementary Figure S4. HCT116 cells treated for 24 h with 5 μM Fluphenazine (compared with DMSO control). Bars show mean with S.D. (n=2, 4 replicates per experiment). **** = P-value smaller 0.0001. lysoPC: lysophosphatidylcholine. (e) ASMase activity in HCT116 cells treated for 24 h with either DMSO control or 5 μM Fluphenazine shows strong reduction after Fluphenazine treatment. Bars show mean with S.D. (n=3). **** = P-value smaller 0.0001. (f) HCT116 cells were co-incubated overnight with either DMSO control+1 μM BODIPY FL C12-Sphingomyelin or 5 μM Fluphenazine+1 μM BODIPY FL C12-Sphingomyelin. Nuclei were stained with Hoechst and Lysosomes with Lysotracker. Scale bar 20 μm. (g) HCT116 spheroids were grown for 4 days under normoxic conditions, followed by 3 days of compound treatment (DMSO control, 5 μM Fluphenazine, 100 μM N-Palmitoyl-D-Sphingomyelin (18:1/16)) and incubation either in normoxia, hypoxia or hypoxia and 200 nM Antimycin. Spheroid nuclei were stained with Hoechst (red) and dead cells were stained with SytoxGreen (green). Representative images of multiple experiments are shown (n≥3). Scale bar 100 μm
Figure 4
Figure 4
Fluphenazine induces lysosomal stress distinct from known lysosomotropic substances. (a) HCT116 spheroids were grown for 4 days in normoxic conditions, followed by 3 days of compound treatment (DMSO control, Fluphenazine 5 μM, Siramesine 5 μM or Bafilomycin 200 nM) and incubation either in normoxia or hypoxia. Spheroid nuclei were stained with Hoechst (red) and dead cells were stained with SytoxGreen (green). Only Fluphenazine induces hypoxia-specific cell death. Representative images of multiple experiments shown (n≥3). Scale bar 100 μm. (b) HCT116 cells were treated for 24 h with DMSO control, 5 μM Fluphenazine, 5 μM Siramesine or 200 nM Bafilomycin. Cells were stained for Galectin (n=4). Scale bar 10 μM. (c) Quantification of galectin puncta formation from panel (b). Bars show mean with S.D. ** = P-value between 0.001 and 0.01, **** = P-value smaller 0.0001
Figure 5
Figure 5
Fluphenazine induces HIF overactivation in conditions of high HIF background levels. (a) HIF activity reporter cells HCT116-HRE-Luc were treated either with DMSO control or 10 μM Fluphenazine and incubated for 16 h in normoxia, hypoxia or in normoxia with the HIF-PH inhibitor DFO. After incubation, cells were lysed and luciferase activity was measured. Bars show mean with S.D. (n=3). (b) HCT116 cells were treated for 24 h with or without DFO (1 mM) and additionally with either DMSO control or Fluphenazine (5 μM). Gene expression analysis was performed for three HIF1 target genes (SLC2A3, VEGFA and BNIP3) by real-time quantitative PCR (RT-qPCR). hRP-L32 was used as reference gene and relative expression level were normalized to the untreated control (no DFO, DMSO). Bars show mean with S.D. (n=3). (c) HCT116-HRE-Luc cells were treated with either Ethanol control or 100 μM SM (18:1/16) and incubated for 24 h either in normoxia or hypoxia. After incubation, cells were lysed and luciferase activity was measured (n=3). (d) RT-qPCR analysis of HIF-1-a mRNA level of HCT116 Spheroids treated for 24 h in normoxia or hypoxia with either DMSO control or 5 μM Fluphenazine. hRP-L32 was used as reference gene and the relative expression level were normalized with the untreated control (normoxia DMSO control). Bars show mean with S.D. (n=3). (e) Western blotting analysis of HIF-1-a protein expression in HCT116 spheroids or HCT116 cells grown in 2D that were treated for 24 h with either DMSO control or 5 μM Fluphenazine under normoxia, hypoxia or normoxia+1 mM DFO. Representative data of multiple experiments are shown (n=3). Intensity values were normalized to loading control and DMSO-treated controls under hypoxia (upper row) or DMSO controls co-incubated with DFO (lower row). Beta-actin was used as an internal control (not shown). * = P-value between 0.01 and 0.05, ** = P-value between 0.001 and 0.01, *** = P-value between 0.0001 and 0.001, **** = P-value smaller 0.0001
Figure 6
Figure 6
Fluphenazine induces ATF4 overactivation in hypoxic spheroids. (a) Analysis of all protein-encoding genes by deep sequencing of HCT116 cells treated for 24 h with either 1 mM DFO or 1 mM DFO+5 μM Fluphenazine (see also Supplementary Figure S6) showed upregulation of ATF4/CHOP-dependent stress-response pathway upon Fluphenazine and DFO co-treatment. Bars show mean with S.D. (n=1, median of 4 replicates). (b) Gene expression analysis (RT-qPCR) of ATF4 pro-apoptotic target genes in HCT116 spheroids treated for 24 h in normoxia or hypoxia with DMSO control or 5 μM Fluphenazine. Ct values of each sample were normalized with the internal control RPL32 and normalized to the normoxia DMSO control. Bars show mean with S.D. (n=3). (c) HCT116 cells were incubated with ATF4 siRNA or lipid only control and grown as spheroids for 3 days under normoxic conditions. Later, spheroids were incubated for 24 h under hypoxia with DMSO control or 5 μM Fluphenazine. Gene expression level for ATF4 target genes PPP1R15A and DDIT3 were determined using RT-qPCR. Ct values of each sample were normalized with the internal control RPL32 and normalized to the hypoxia lipid only control sample. Bars show mean with S.D. (n=3). (d) siRNA-treated cells grown as spheroids (for ATF4) or spheroids from HCT116 cells stably transfected with HIF shRNA (see Materials and Methods) were treated with either DMSO control or Fluphenazine (3 μM) (or 100 μM N-Palmitoyl-D-Sphingomyelin (SM d18:1/16)) for 3 days under hypoxia. Spheroid nuclei were stained with Hoechst (red) and dead cells were stained with SytoxGreen (green). ATF4 ameliorates Fluphenazine- or SM-induced cell death under hypoxia. n=3. Scale bar 100 μm. ** = P-value between 0.001 and 0.01, *** = P-value between 0.0001 and 0.001
Figure 7
Figure 7
Model for Fluphenazine-induced hypoxia-specific cell death by potentiating the pro-apoptotic path of cellular stress-response pathways. Fluphenazine impairs lysosomal functions by interfering with ASMase activity. Sphingolipid accumulation induces ATF4 and CHOP. Incubation under hypoxia induces additional stress response and additionally activates HIF1 transcriptional activity. Both transcription factors, ATF4 and HIF1, express pro-survival as well as pro-apoptotic genes that must be balanced to determine cellular fate depending on the amount of stress received. Together, Fluphenazine and hypoxia treatment shift the cells' stress response toward apoptosis and cell death. However, either of these treatments alone is not sufficient to induce cell death and favors the pro-survival stress-response pathway. FP, Fluphenazine; C, ceramide; ASMase, acid sphingomyelinase; ER, endoplasmic reticulum, SM, sphingomyelin

References

    1. Kyle AH, Baker JH, Minchinton AI. Targeting quiescent tumor cells via oxygen and IGF-I supplementation. Cancer Res 2012; 72: 801–809. - PubMed
    1. Semenza GL. Oxygen sensing, hypoxia-inducible factors, and disease pathophysiology. Annu Rev Pathol 2014; 9: 47–71. - PubMed
    1. Nagy JA, Chang SH, Dvorak AM, Dvorak HF. Why are tumour blood vessels abnormal and why is it important to know? Br J Cancer 2009; 100: 865–869. - PMC - PubMed
    1. Koumenis C, Wouters BG. "Translating" tumor hypoxia: unfolded protein response (UPR)-dependent and UPR-independent pathways. Mol Cancer Res 2006; 4: 423–436. - PubMed
    1. Vaupel P, Mayer A. Hypoxia in cancer: significance and impact on clinical outcome. Cancer Metastasis Rev 2007; 26: 225–239. - PubMed

Publication types

MeSH terms

LinkOut - more resources