. 2017 Mar 30;8(3):e2716.
doi: 10.1038/cddis.2017.133.

Mitochondrial complex I inhibition triggers a mitophagy-dependent ROS increase leading to necroptosis and ferroptosis in melanoma cells

Affiliations

Mitochondrial complex I inhibition triggers a mitophagy-dependent ROS increase leading to necroptosis and ferroptosis in melanoma cells

Farhan Basit et al. Cell Death Dis. .

Abstract

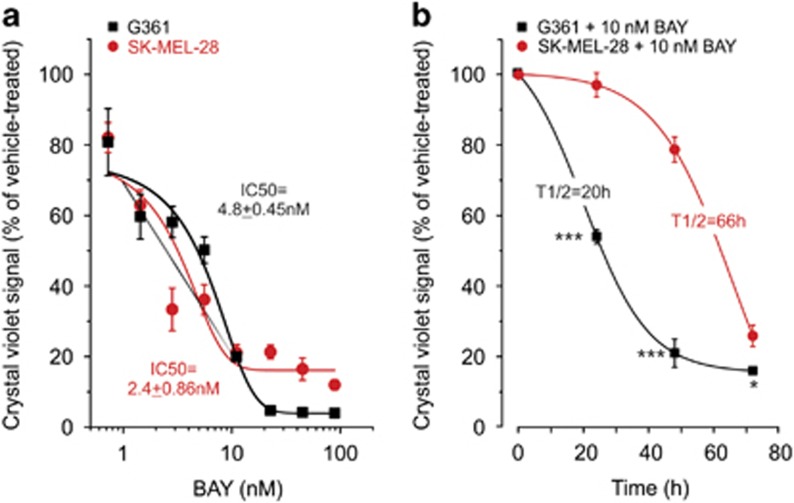
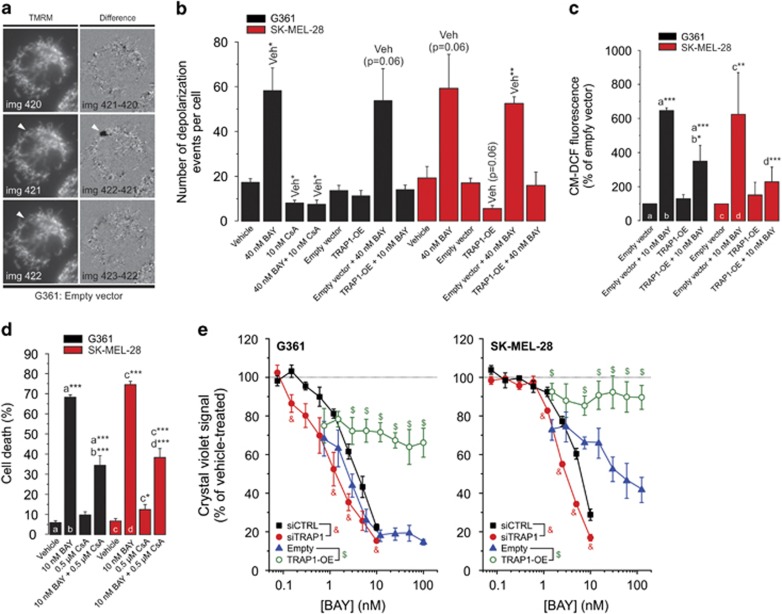
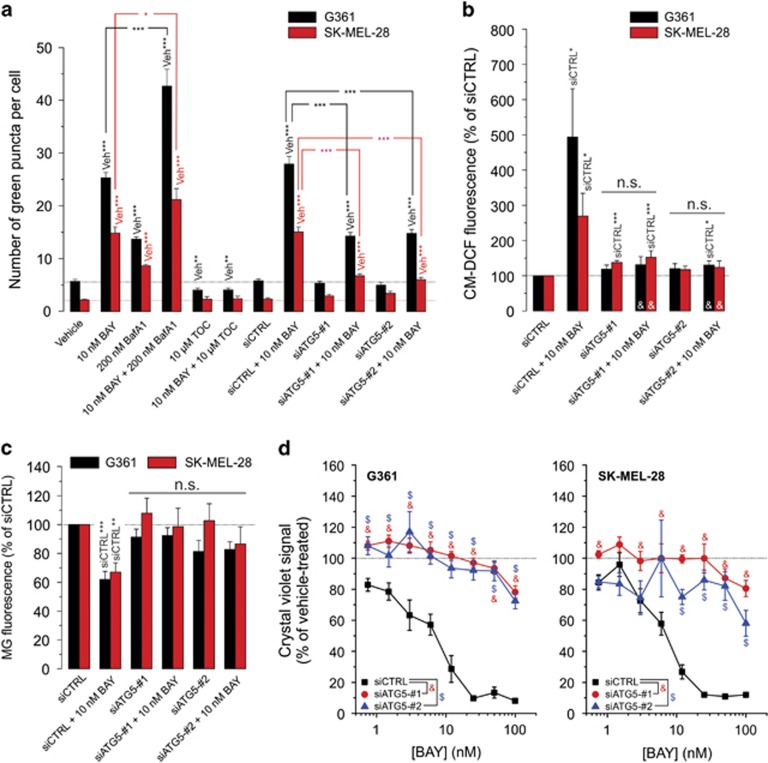
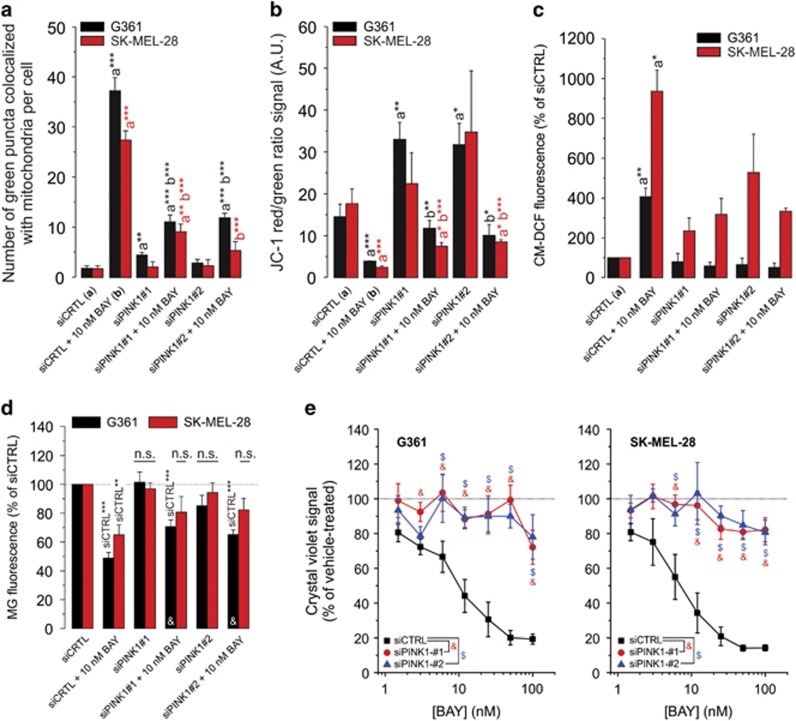
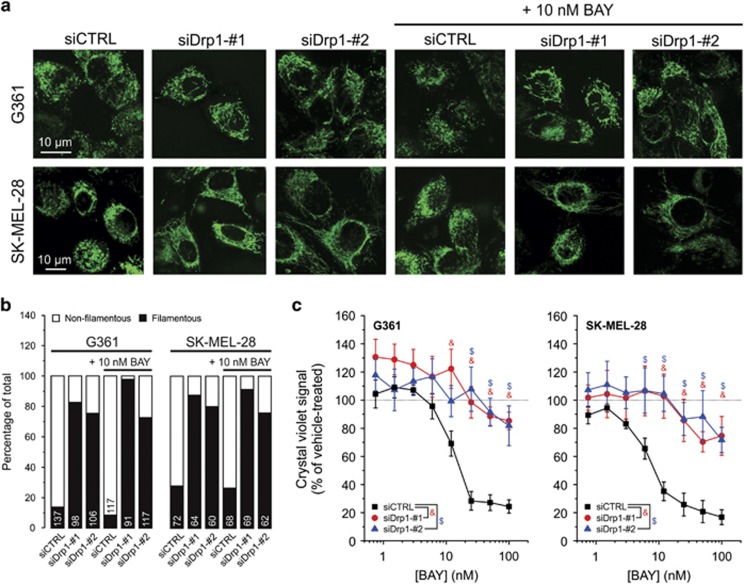
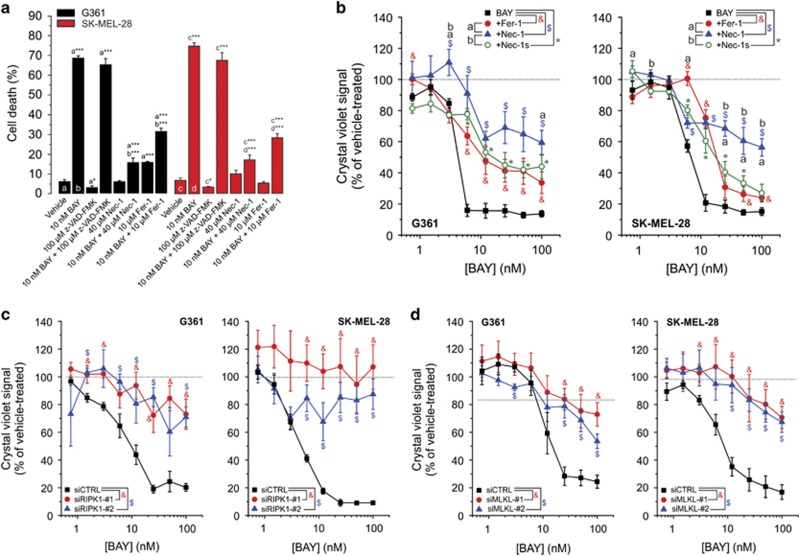
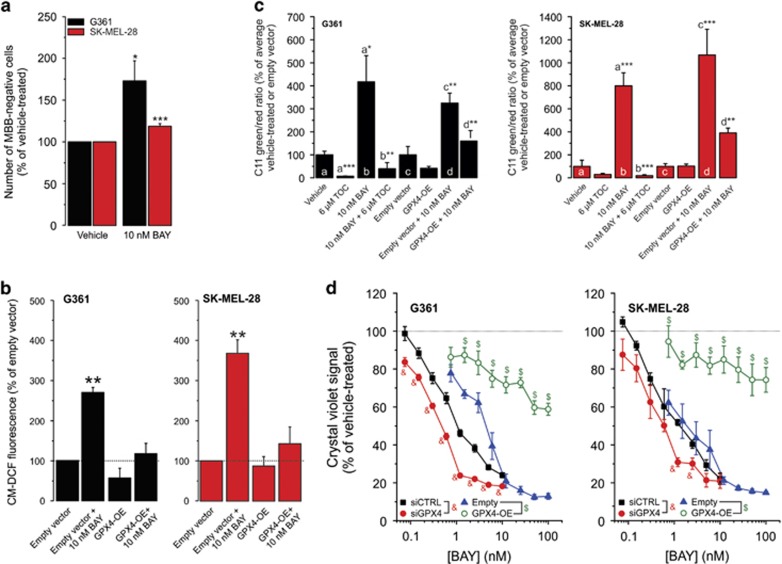
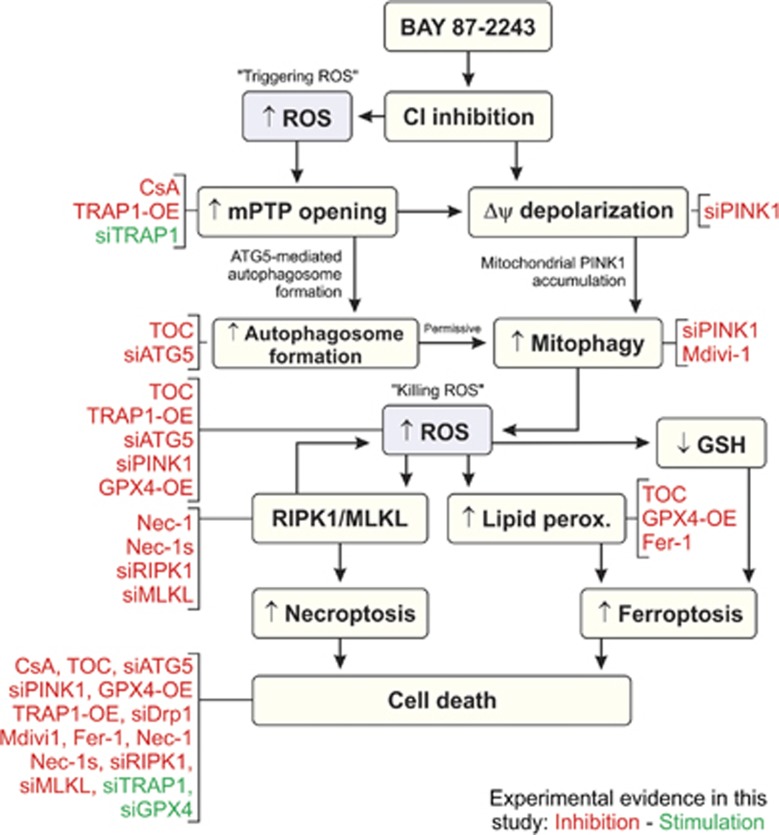
Inhibition of complex I (CI) of the mitochondrial respiratory chain by BAY 87-2243 ('BAY') triggers death of BRAFV600E melanoma cell lines and inhibits in vivo tumor growth. Here we studied the mechanism by which this inhibition induces melanoma cell death. BAY treatment depolarized the mitochondrial membrane potential (Δψ), increased cellular ROS levels, stimulated lipid peroxidation and reduced glutathione levels. These effects were paralleled by increased opening of the mitochondrial permeability transition pore (mPTP) and stimulation of autophagosome formation and mitophagy. BAY-induced cell death was not due to glucose shortage and inhibited by the antioxidant α-tocopherol and the mPTP inhibitor cyclosporin A. Tumor necrosis factor receptor-associated protein 1 (TRAP1) overexpression in BAY-treated cells lowered ROS levels and inhibited mPTP opening and cell death, whereas the latter was potentiated by TRAP1 knockdown. Knockdown of autophagy-related 5 (ATG5) inhibited the BAY-stimulated autophagosome formation, cellular ROS increase and cell death. Knockdown of phosphatase and tensin homolog-induced putative kinase 1 (PINK1) inhibited the BAY-induced Δψ depolarization, mitophagy stimulation, ROS increase and cell death. Dynamin-related protein 1 (Drp1) knockdown induced mitochondrial filamentation and inhibited BAY-induced cell death. The latter was insensitive to the pancaspase inhibitor z-VAD-FMK, but reduced by necroptosis inhibitors (necrostatin-1, necrostatin-1s)) and knockdown of key necroptosis proteins (receptor-interacting serine/threonine-protein kinase 1 (RIPK1) and mixed lineage kinase domain-like (MLKL)). BAY-induced cell death was also reduced by the ferroptosis inhibitor ferrostatin-1 and overexpression of the ferroptosis-inhibiting protein glutathione peroxidase 4 (GPX4). This overexpression also inhibited the BAY-induced ROS increase and lipid peroxidation. Conversely, GPX4 knockdown potentiated BAY-induced cell death. We propose a chain of events in which: (i) CI inhibition induces mPTP opening and Δψ depolarization, that (ii) stimulate autophagosome formation, mitophagy and an associated ROS increase, leading to (iii) activation of combined necroptotic/ferroptotic cell death.


Conflict of interest statement

FB, LMPEvO, HMB, SEvEdV, JCWH, SG, PHGMW and WJHK declare no competing interests. LS, CK and MH are full-time employees of Bayer Pharma AG, which developed BAY 87-2243.

Figures

Figure 1
Figure 1
Dose- and time-dependent effect of BAY and medium refreshment on cell viability. (a) Dose-dependent effect of BAY (N=2, n=4) on the viability of G361 and SK-MEL-28 cells (at 72 h). A Boltzmann equation was used to determine the IC50 (x0) value: y=(A2+(A1A2)/(1+exp((xx0)/dx))). (b) G361 and SK-MEL-28 melanoma cells were treated with 10 nM BAY (N=3, n=6) and their viability was measured at different time points. A sigmoidal (logistic) equation was used to determine the T1/2 (x0) value: y=([(A1A2)/(1+(x/x0)]+A2). Statistics: In panel b, significant differences with the SK-MEL-28 cell line are indicated by *P<0.05 and ***P<0.001
Figure 2
Figure 2
Effect of TRAP1 knockdown/overexpression on the BAY-induced reduction in cell viability. (a) Detection of photoinduced mitochondrial membrane potential (Δψ) depolarizations (‘Δψ-flickering') in a typical TMRM-stained G361 cells (see Results for details). (b) Effect of BAY (2 min), CsA (2 h), empty vector and TRAP1-OE on Δψ-flickering (N=3, n≥20). (c) Effect of BAY on reactive oxygen species (ROS) levels (at 24 h; N=3, n=3) in cells transfected with the empty or TRAP1-OE vector. (d) Effect of vehicle (N=5, n=15), BAY (N=5, n=15) and CsA (N=3, n=6) on cell death (G361: at 48 h; SK-MEL-28: at 72 h). (e) Effect of BAY on the viability of cells (G361: at 48 h; SK-MEL-28: at 72 h; N=3, n=6) transfected with siCTRL, siTRAP1, empty vector and TRAP1-OE. Statistics: Significant differences relative to the vehicle condition (‘Veh' in panel b) and between treatments (a, b, c, d in panels c and d) are indicated by *P<0.05, **P<0.01 and ***P<0.001. In panel (e), significant differences (P<0.05) between conditions are marked by symbols (&, $)
Figure 3
Figure 3
Effect of ATG5 knockdown on the BAY-induced stimulation of autophagy, reactive oxygen species (ROS) increase and reduction in cell viability. (a) Effect of BAY in the absence and presence of BafA1, TOC and ATG5 knockdown on the number of green puncta in G361 and SK-MEL-28 cells (at 24 h; N=3, n=30). (b) Effect of BAY on ROS levels (at 24 h; N=3, n=9) in cells transfected with an empty or GPX4 overexpression vector (GPX-OE). (c) Effect of BAY on cellular MG fluorescence (G361: at 24 h; SK-MEL-28: at 24 h; N=3, n=9) in cells transfected with siCTRL, siATG5-no. 1 and siATG5-no. 2. (d) Effect of BAY on the viability of cells (G361: at 48 h; SK-MEL-28: at 72 h; N=3, n=6) transfected with siCTRL, siATG5-no. 1 and siATG5-no. 2. Statistics: Significant differences relative to the marked conditions are indicated by *P<0.05, **P<0.01 and ***P<0.001. NS indicates nonsignificant. In panel (d), significant differences with the (siCTRL+10 nM BAY condition) are marked by ‘&'. In panel (b) significant differences (P<0.05) between conditions are marked by symbols (&, $)
Figure 4
Figure 4
Effect of PINK1 knockdown on the BAY-induced stimulation of mitophagy, Δψ depolarization, reactive oxygen species (ROS) levels and reduction in cell viability. (a) Effect of BAY treatment, siPINK1-no. 1 and siPINK1-no. 2 on the number of green puncta colocalizing with mitochondria in G361 and SK-MEL-28 cells (at 24 h; N=3, n≥14). (b) Similar to panel a, but now for the effect on mitochondrial membrane potential (i.e. the JC-1 red/green ratio signal; N=3, n=6). (c) Similar to panel a, but now for the effect on cellular ROS levels (N=3, n=6). (d) Similar to panel a, but now for the effect on cellular MG fluorescence intensity (G361: at 24 h; SK-MEL-28: at 24 h; N=3, n=9). (e) Effect of BAY on the viability of cells (G361: at 48 h; SK-MEL-28: at 72 h; N=3, n=6) transfected with siCTRL, siPINK1-no. 1 and siPINK1-no. 2. Statistics: Significant differences relative to the indicated conditions are marked by *P<0.05, **P<0.01 and ***P<0.001. In panel c statistical analysis was performed using a one-sample t-test against a value of 100. In panel d, NS indicates nonsignificant and significant differences with the (siCTRL+10 nM BAY condition) are marked by ‘&'. In panel (e) significant differences (P<0.05) between conditions are marked by symbols (&, $)
Figure 5
Figure 5
Effect of Drp1 knockdown on mitochondrial morphology and the BAY-induced reduction in cell viability. (a) Typical examples visualizing mitochondria morphology in MG-stained cells treated with siCTRL, siDrp1-no. 1 and siDrp1-no. 2 in the absence and presence of 10 nM BAY (G361: at 16 h; SK-MEL-28: at 24 h). (b) Quantification of mitochondrial morphology in multiple cells (N=2; numerals indicate the number of cells analyzed) for the conditions in panel (a). (c) Effect of BAY on the viability of cells (G361: at 48 h; SK-MEL-28: at 72 h; N=3, n=6) transfected with siCTRL, siDrp1-no. 1 and siDrp1-no. 2. Statistics: In panel (c), statistically significant differences (P<0.05) between conditions are marked by symbols (&, $)
Figure 6
Figure 6
Effect of z-VAD-FMK, Nec-1, Nec-1s, Fer-1 and knockdown of RIPK1 and MLKL on the BAY-induced reduction in cell viability. (a) Effect of vehicle (N=5, n=15), BAY (N=5, n=15), the pancaspase inhibitor z-VAD-FMK (N=3, n=9), Nec-1 (N=3, n=9) and Fer-1 (N=3, n=9) on cell death (G361: at 48 h; SK-MEL-28: at 72 h). (b) Effect of BAY on viability (G361: at 48 h; SK-MEL-28: at 72 h; N=3, n=6) in the absence and presence of the ferroptosis inhibitor Fer-1 and the RIPK1 inhibitors Nec-1 and Nec-1s. (c) Effect of BAY on cell viability (G361: at 48 h; SK-MEL-28: at 72 h; N=3, n=6) in cells transfected with siCTRL, siRIPK1-no. 1 and siRIPK1-no. 2. (d) Effect of BAY on the viability of cells (G361: at 48 h; SK-MEL-28: at 72 h; N=3, n=6) transfected with siCTRL, siMLKl-no. 1 and siMLKL-no. 2. Statistics: Significant differences relative to the marked conditions are indicated by *P<0.05 and ***P<0.001. In panels b–d, significant differences (P<0.05) between conditions are marked by symbols (a, b, &, $)
Figure 7
Figure 7
Effect of GPX4 knockdown/overexpression on the BAY-induced reduction in cell viability. (a) Effect of BAY on the number of MBB-negative (GSH-depleted) cells in the vehicle- and BAY-treated condition (G361: at 12 h; SK-MEL-28: at 24 h; N=3, n=9). Higher bars reflect a reduction in the number of MBB-positive cells. (b) Effect of BAY on reactive oxygen species (ROS) levels (at 24 h; N=3, n=3) in cells transfected with the empty or GPX4-OE vector. (c) Cellular lipid peroxidation (at 24 h) in vehicle-treated cells (G361: N=3, n=7; SK-MEL-28: N=3, n=6), TOC-treated cells (G361: N=3, n=7; SK-MEL-28: N=3, n=6), BAY-treated cells (G361: N=3, n=7; SK-MEL-28: N=3, n=6), BAY+TOC-treated cells (G361: N=3, n=7; SK-MEL-28: N=3, n=6), empty vector-transfected cells (G361: N=3, n=9; SK-MEL-28: N=3, n=8), GPX4-OE-transfected cells (G361: N=3, n=9; SK-MEL-28: N=3, n=8), empty vector-transfected-+BAY-treated cells (G361: N=3, n=9; SK-MEL-28: N=3, n=8) and GPX-OE transfected-+BAY-treated cells (G361: N=3, n=8; SK-MEL-28: N=3, n=8). (d) Effect of BAY on the viability of cells (G361: at 48 h; SK-MEL-28: at 72 h; N=3, n=6) transfected with siCTRL, siGPX4, empty vector and GPX4-OE. Statistics: Significant differences relative to vehicle (panel a), empty vector (panel b) and the marked conditions (panel c) are indicated by *P<0.05, **P<0.01, *P<0.01 and ***P<0.001. In panel d, significant differences (P<0.05) between conditions are marked by symbols (&, $)
Figure 8
Figure 8
Proposed mechanistic model and experimental evidence. Treatment with BAY inhibits mitochondrial CI. This induces a (local) increase in reactive oxygen species (ROS) levels (‘triggering ROS'), which stimulates mPTP opening and autophagosome formation. Simultaneously, CI inhibition induces depolarization of the mitochondrial membrane potential (Δψ) leading to mitophagy induction. The latter increases ROS levels (‘killing ROS') leading to parallel stimulation of necrosome formation (RIPK1/MLKL), lipid peroxidation and GSH depletion. Increased necrosome formation further stimulates ROS levels and leads to induction of necroptosis, whereas lipid peroxidation and GSH depletion stimulate ferroptosis. Experimental evidence presented in this study are marked in red (inhibitory effect) and green (stimulatory effect)

References

    1. Abildgaard C, Guldberg P. Molecular drivers of cellular metabolic reprogramming in melanoma. TR Mol Med 2015; 21: 164–171. - PubMed
    1. Yuneva MO, Fan TW, Allen TD, Higashi RM, Ferraris DV, Tsukamoto T et al. The metabolic profile of tumors depends on both the responsible genetic lesion and tissue type. Cell Metab 2012; 15: 157–170. - PMC - PubMed
    1. Shakya A, Cooksey R, Cox JE, Wang V, McClain DA, Tantin D. Oct1 loss of function induces a coordinate metabolic shift that opposes tumorigenicity. Nat Cell Biol 2009; 11: 320–327. - PubMed
    1. Gough DJ, Corlett A, Schlessinger K, Wegrzyn J, Larner AC, Levy DE. Mitochondrial STAT3 supports Ras-dependent oncogenic transformation. Science 2009; 324: 1713–1716. - PMC - PubMed
    1. Rossignol R, Gilkerson R, Aggeler R, Yamagata K, Remington SJ, Capaldi RA. Energy substrate modulates mitochondrial structure and oxidative capacity in cancer cells. Cancer Res 2004; 64: 985–993. - PubMed

MeSH terms

Substances