. 2017 Jun 19;31(10):1405-1414.
doi: 10.1097/QAD.0000000000001480.

Intracellular HIV-1 RNA and CD4+ T-cell activation in patients starting antiretrovirals

Affiliations

Intracellular HIV-1 RNA and CD4+ T-cell activation in patients starting antiretrovirals

Ramy El-Diwany et al. AIDS. .

Abstract

Objective: To assess if the reduction in HIV-1 RNA in CD4 T cells is correlated with the persistence of immune activation following early antiretroviral therapy (ART).

Design: Clinical trial (NCT01285050).

Methods: Next-generation sequencing was used to study total RNA from activated CD4 T cells (CD38 and human leukocyte antigen - antigen D related (HLA-DR) expressing) collected from 19 treatment-naïve HIV-1/hepatitis C virus-infected patients before and early after ART initiation (≥12 weeks after plasma HIV-1 RNA <50 copies/ml). To validate comparisons, pre and post-ART measures were adjusted for input RNA and overall read number.

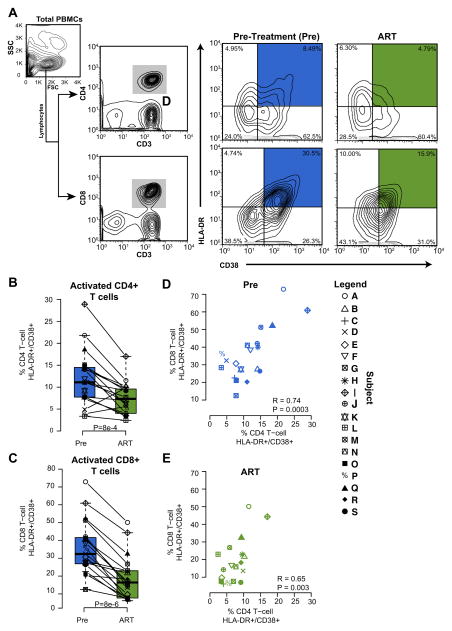
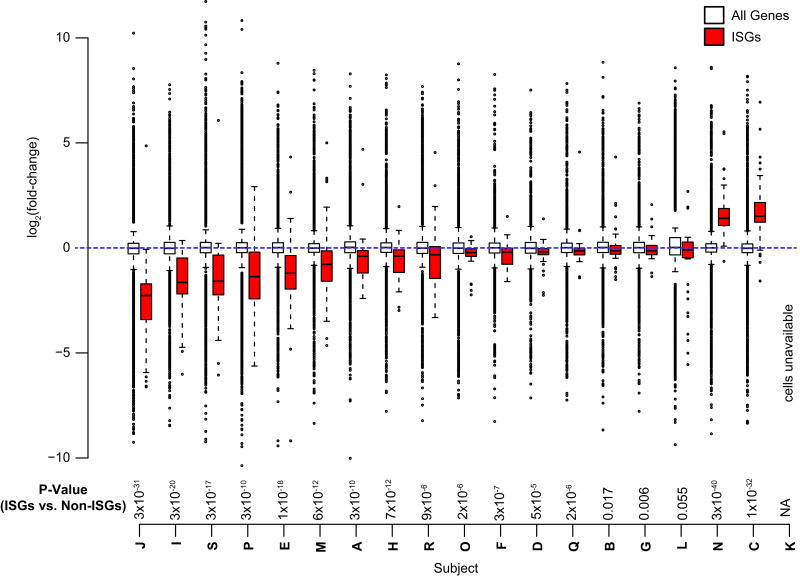
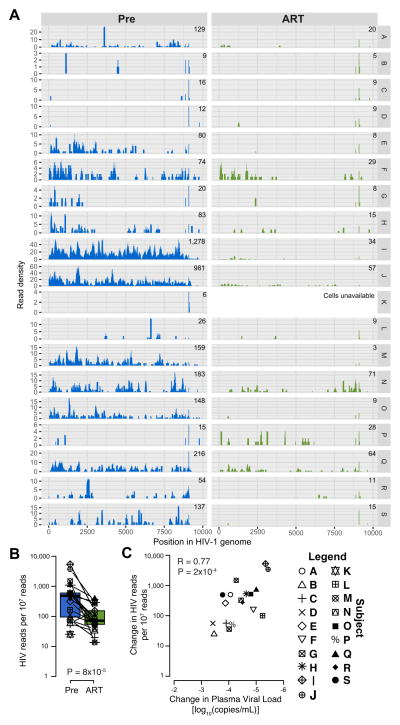
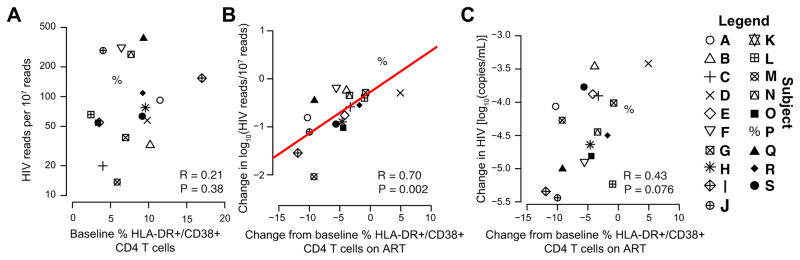
Results: As expected, ART use was associated with a median [interquartile range (IQR)] 4.3% (2.2-8.3) reduction in the proportion of activated CD4 T cells (P = 0.0008). Whereas in those activated CD4 T cells no consistent differences in overall gene expression were detected, interferon-stimulated gene expression declined (P < 2 × 10). Pre-ART, sorted activated CD4 T cells contained a median (IQR) of 959 (252-1614) HIV-1 reads/10 reads compared with 72 (55-152) HIV-1 reads/10 reads after at least 12 weeks of suppressive ART (P = 8 × 10). The decrease in HIV-1 reads in activated CD4 T cells was associated with the change in plasma HIV-1 RNA levels (r = 0.77, P = 2 × 10) and the change in the proportion of activated CD4 T cells (r = 0.70, P = 0.0016).

Conclusion: Months of ART led to a marked decrease in cell-associated HIV-1 RNA and interferon-stimulated genes expression in activated CD4 T cells that were strongly associated with the reduction in the proportion of activated CD4 T cells.


Conflict of interest statement

CONFLICT OF INTEREST: The authors indicate no conflict of interest

Figures

FIGURE 1
FIGURE 1. The proportion of activated T cells declines following ART
(A) Flow cytometry data and sorting algorithm for isolation of activated CD4+ and CD8+ T cells from total PBMCs at baseline (Pre-ART, blue) and after ≥12 weeks of undetectable plasma HIV-1 RNA during ART (green). Boxplots showing the proportion of (B) CD4+ and (C) CD8+ T cells expressing both CD38 and HLA-DR. (D) Scatterplot comparing the degree of CD4+ and CD8+ activation by participant before and (E) after ART.
FIGURE 2
FIGURE 2. Activated CD4+ T cells of patients following ART initiation have decreased expression of interferon stimulated genes (ISGs) compared to pre-ART
Boxplots comparing the log2 fold-changes (y-axis) of all genes (unfilled) with ISGs (red) for each of the 19 subjects in the study. P-value shown is a Wilcoxon rank-sum test of the fold-changes of ISGs compared to the fold-changes of all other genes per individual.
FIGURE 3
FIGURE 3. Intracellular HIV-1 reads in activated CD4+ T cells pre- and following ART initiation
(A) Histograms displaying the HIV-1 read density (y axis) of each participant (designated at the far right, Y2, labels as A to S) for each position on the HIV-1 reference genome (x axis). (B) Boxplot with overlaid values comparing HIV-1 read quantitation pre- and following ART initiation. Lines connect values from the same individual. (C) Scatterplot comparing the change in the normalized number of reads mapping to HIV-1 from activated CD4+ T cells with ART and the change in plasma HIV RNA (with undetectable values while on ART set to zero).
FIGURE 4
FIGURE 4. The change in intracellular HIV-1 RNA is associated with the change in proportion of activated CD4+ T cells
(A) pre-ART HIV-1 RNA is not associated with the proportion of DR+/CD38+/CD4+ T cells as shown by scatter plot comparing the two values. (B) Scatterplot comparing the change in intracellular HIV-1 RNA and the change in the proportion of HLA-DR+/CD38+/CD4+ T cells. (C) Scatterplot comparing the change in plasma HIV-1 RNA (with undetectable values on ART set to zero) and the change in the proportion of HLA-DR+/CD38+/CD4+ T cells.

Similar articles

Cited by

References

    1. Warriner AH, Burkholder GA, Overton ET. HIV-related metabolic comorbidities in the current ART era. Infect Dis Clin North Am. 2014;28:457–476. - PubMed
    1. Lederman MM, Funderburg NT, Sekaly RP, Klatt NR, Hunt PW. Residual immune dysregulation syndrome in treated HIV infection. Adv Immunol. 2013;119:51–83. - PMC - PubMed
    1. Aounallah M, Dagenais-Lussier X, El-Far M, Mehraj V, Jenabian MA, Routy JP, et al. Current topics in HIV pathogenesis, part 2: Inflammation drives a Warburg-like effect on the metabolism of HIV-infected subjects. Cytokine Growth Factor Rev. 2016;28:1–10. - PubMed
    1. Nou E, Lo J, Grinspoon SK. Inflammation, immune activation, and cardiovascular disease in HIV. AIDS. 2016;30:1495–1509. - PMC - PubMed
    1. Klatt NR, Chomont N, Douek DC, Deeks SG. Immune activation and HIV persistence: implications for curative approaches to HIV infection. Immunol Rev. 2013;254:326–342. - PMC - PubMed

Publication types

Associated data