

Comprehensive framework for visualizing and analyzing spatio-temporal dynamics of racial diversity in the entire United States
- PMID: 28358862
- PMCID: PMC5373636
- DOI: 10.1371/journal.pone.0174993
Comprehensive framework for visualizing and analyzing spatio-temporal dynamics of racial diversity in the entire United States
Abstract
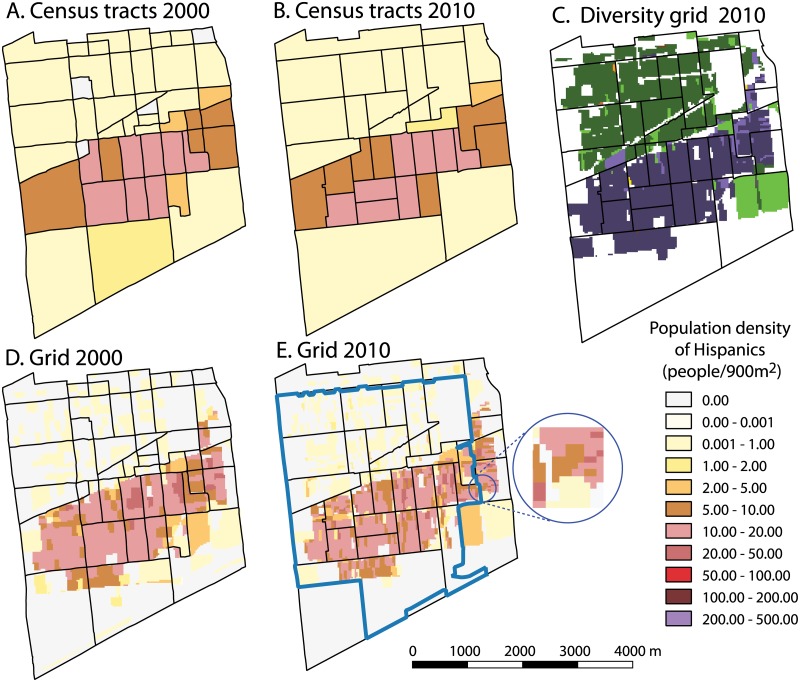
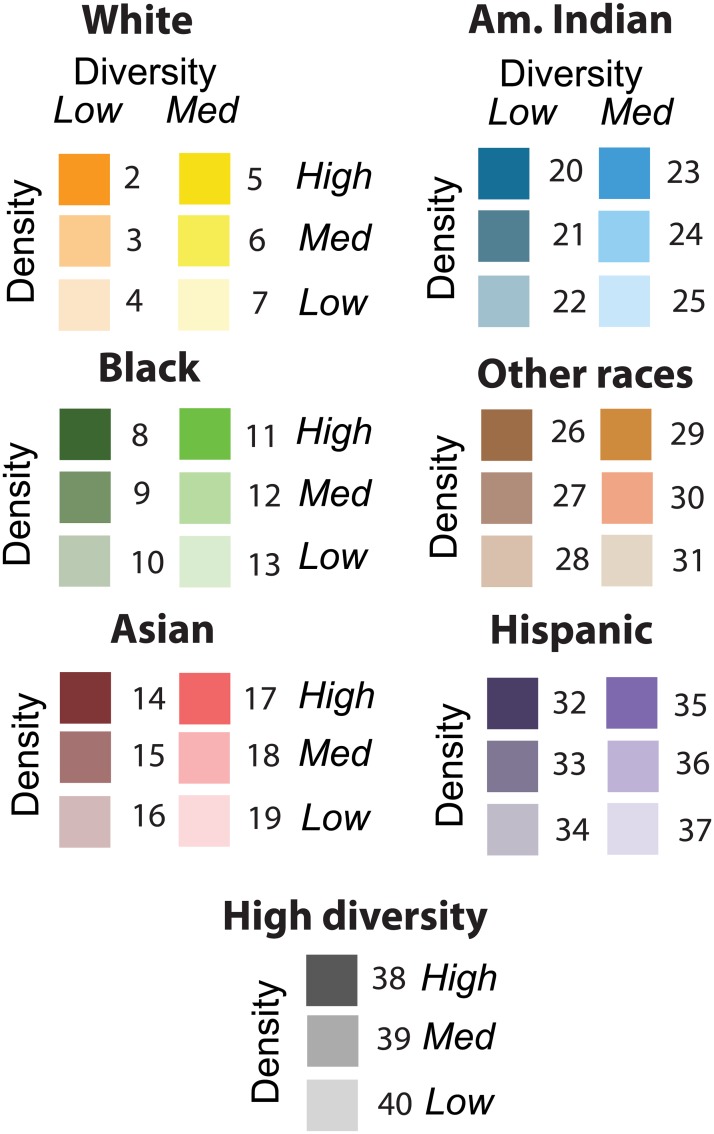
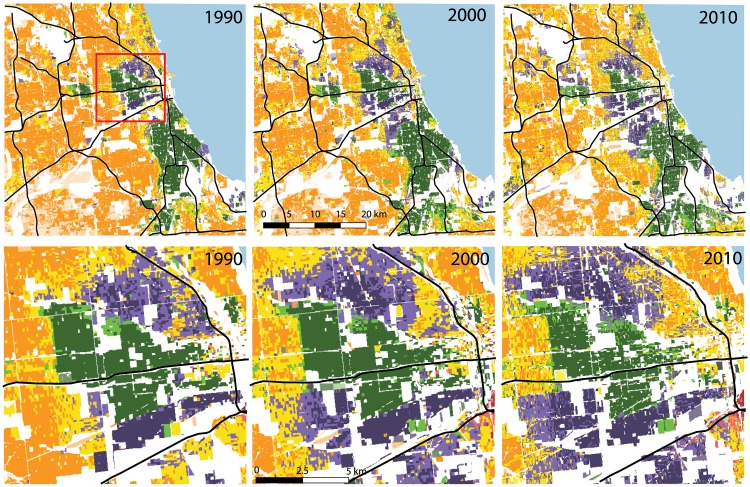
The United States is increasingly becoming a multi-racial society. To understand multiple consequences of this overall trend to our neighborhoods we need a methodology capable of spatio-temporal analysis of racial diversity at the local level but also across the entire U.S. Furthermore, such methodology should be accessible to stakeholders ranging from analysts to decision makers. In this paper we present a comprehensive framework for visualizing and analyzing diversity data that fulfills such requirements. The first component of our framework is a U.S.-wide, multi-year database of race sub-population grids which is freely available for download. These 30 m resolution grids have being developed using dasymetric modeling and are available for 1990-2000-2010. We summarize numerous advantages of gridded population data over commonly used Census tract-aggregated data. Using these grids frees analysts from constructing their own and allows them to focus on diversity analysis. The second component of our framework is a set of U.S.-wide, multi-year diversity maps at 30 m resolution. A diversity map is our product that classifies the gridded population into 39 communities based on their degrees of diversity, dominant race, and population density. It provides spatial information on diversity in a single, easy-to-understand map that can be utilized by analysts and end users alike. Maps based on subsequent Censuses provide information about spatio-temporal dynamics of diversity. Diversity maps are accessible through the GeoWeb application SocScape (http://sil.uc.edu/webapps/socscape_usa/) for an immediate online exploration. The third component of our framework is a proposal to quantitatively analyze diversity maps using a set of landscape metrics. Because of its form, a grid-based diversity map could be thought of as a diversity "landscape" and analyzed quantitatively using landscape metrics. We give a brief summary of most pertinent metrics and demonstrate how they can be applied to diversity maps.
Conflict of interest statement
Figures
References
-
- Colby SL, Ortman JM. Projections of the Size and Composition of the U.S. Population: 2014 to 2060. Current Population Reports, P25-1143, U.S. Census Bureau, Washington, DC; 2014.
-
- Massey DS, Denton NA. The dimensions of residential segregation. Social Forces. 1988;67(2):281–315. 10.1093/sf/67.2.281 - DOI
-
- Lieberson S. Measuring Population Diversity. American Sociological Review. 1969;64:850–862. 10.2307/2095977 - DOI
-
- Charles CZ. The Dynamics of Racial Segregation. Annual Review of Sociology. 2003;29:167–207. 10.1146/annurev.soc.29.010202.100002 - DOI
-
- Iceland J, Weinberg D, Steinmetz E. Racial and Ethnic Residential Segregation in the United States: 1980-2000; 2002.
MeSH terms
LinkOut - more resources
Full Text Sources
Other Literature Sources
