. 2017 May:106:1-13.
doi: 10.1016/j.yjmcc.2017.03.006. Epub 2017 Mar 27.

Tropomyosin 1: Multiple roles in the developing heart and in the formation of congenital heart defects

Affiliations

Tropomyosin 1: Multiple roles in the developing heart and in the formation of congenital heart defects

Jennifer England et al. J Mol Cell Cardiol. 2017 May.

Abstract

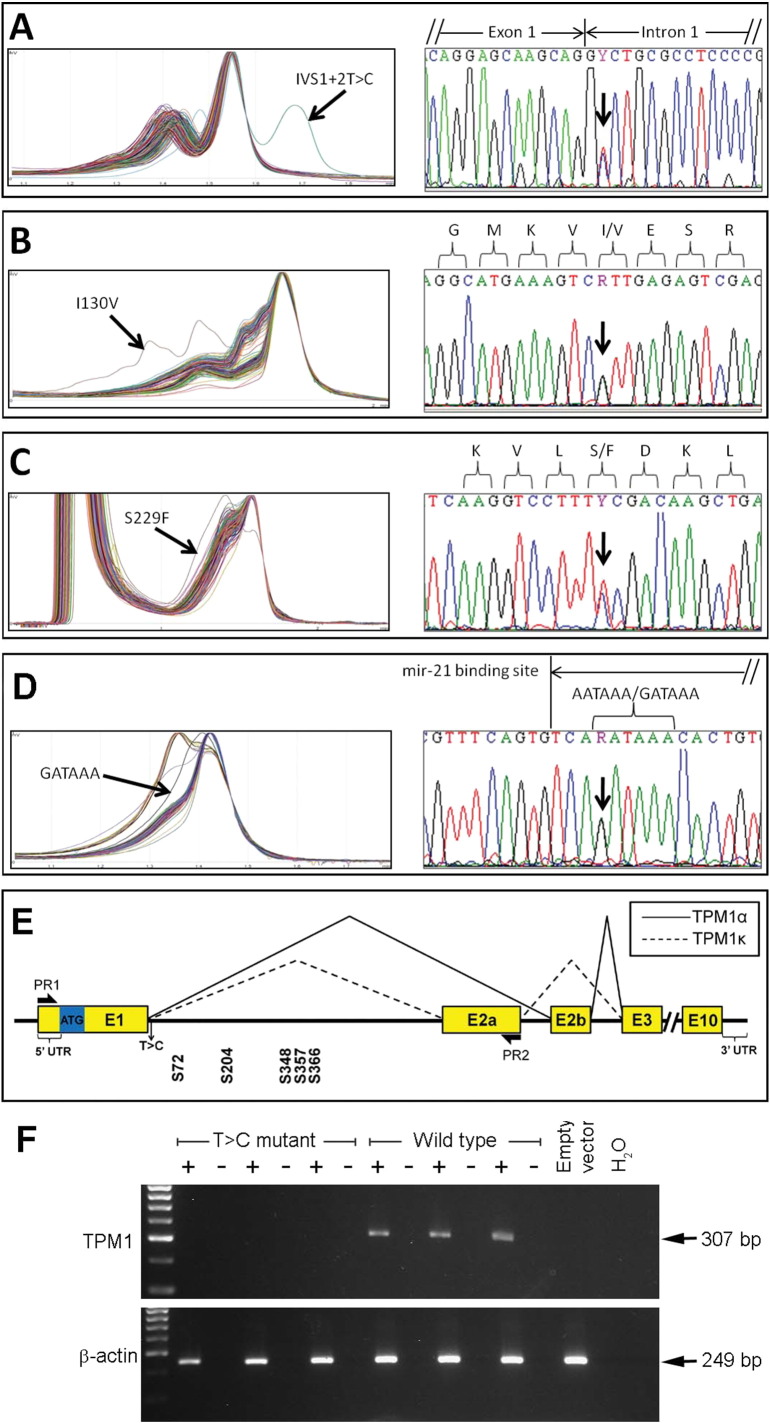
Tropomyosin 1 (TPM1) is an essential sarcomeric component, stabilising the thin filament and facilitating actin's interaction with myosin. A number of sarcomeric proteins, such as alpha myosin heavy chain, play crucial roles in cardiac development. Mutations in these genes have been linked to congenital heart defects (CHDs), occurring in approximately 1 in 145 live births. To date, TPM1 has not been associated with isolated CHDs. Analysis of 380 CHD cases revealed three novel mutations in the TPM1 gene; IVS1+2T>C, I130V, S229F and a polyadenylation signal site variant GATAAA/AATAAA. Analysis of IVS1+2T>C revealed aberrant pre-mRNA splicing. In addition, abnormal structural properties were found in hearts transfected with TPM1 carrying I130V and S229F mutations. Phenotypic analysis of TPM1 morpholino-treated embryos revealed roles for TPM1 in cardiac looping, atrial septation and ventricular trabeculae formation and increased apoptosis was seen within the heart. In addition, sarcomere assembly was affected and altered action potentials were exhibited. This study demonstrated that sarcomeric TPM1 plays vital roles in cardiogenesis and is a suitable candidate gene for screening individuals with isolated CHDs.

Keywords: Cardiac development; Congenital heart defects; Structural protein; Tropomyosin 1.


Figures

Fig. 1
Fig. 1
Sequence traces demonstrating TPM1 mutations in patients with CHDs and the effect of a splice-donor site mutation on splicing. A, B, C, D. dHPLC traces and electropherograms corresponding to the CHD samples with a TPM1 gene mutation. The right panel shows the nucleotide substitution for each variant. Arrows demarcate variation in the DNA sequence observed. E. Schematic illustration of TPM1. Two variants were found in intron1-2a: IVS1 + 2T > C (indicated as T > C). Primers were designed to obtain amplicons containing these variants from the genomic DNA of patient A (PR1 in the 5′ upstream region and PR2 in exon 2a). Five stop codons are present within intron 1-2a (S72, S204, S348, S357 and S366) in the 1st open reading frame. ATG, ATG start-site; E, exon; UTR, untranslated region. F. PCR showing the splicing of TPM1 containing IVS1 + 2T > C mutation versus the wild-type. The wild-type mRNA splices normally, giving an expected band size of 307 bp (+ lane), the IVS1 + 2T > C mutant produce no splice product. β-actin acted as a loading control (249 bp). The –ve RT (− lane) and PCR controls (H20) showed no signal.
Fig. 2
Fig. 2
Multi-species amino acid alignment of a TPM1 segment and molecular modelling of TPM1 demonstrating alterations at residue 229. A. Multi-species alignment of orthologues of TPM1 showing the conservation of residue 229 (red rectangle). In this position, serine or threonine are present in mammals, fish, amphibians, insects and ascidians. B–D. Homology molecular models showing the structure of the residues serine (B), threonine (C) and phenylalanine (D) in position 229 of TPM1. Serine or threonine, which are conserved, allow proper interaction between two TPM1 molecules forming coiled-coil dimers whereas, phenylalanine with its bulkier side chain, encoded by the S229F allele, prevents that interaction, by steric clash between the two molecules.
Fig. 3
Fig. 3
Whole embryonic hearts transfected with GFP-tagged constructs and visualized on a DeltaVision microscope. A. Embryo microinjected with GFP-tagged constructs and harvested 48 h post-injection (n = 4 per group). GFP fluorescence was restricted to the heart. B. Photomicrographs of sarcomeres transfected with control (a–c), GFP/TPM1-I130V (e–g) and GFP/TPM1-S229F (i–k) constructs. The sarcomeres showing GFP expression (green; panels b, f, j) can be compared to the same region (arrows landmark the same positions) counter stained with the TRITC labelled troponin sarcomeric marker (magenta; panels a, e, i); merged images presented in c, g and k (magenta and green merge shows white). Boxed areas denote higher magnifications (a′–k′). Wild-type show coincidence of the GFP and the troponin marker (arrows in a′, b′ and c′; white shows overlap of similar green and magenta signals). This is supported by the fluorescence intensity plot (d) (obtained from region denoted with a line in c), with peaks for GFP and TRITC correlating. In contrast, with the I130V mutant, coincidence of the GFP construct was not observed with the troponin sarcomeric marker (e′, f′ and g′; i.e. the sarcomere is not evident at the arrows in e′ but is at the same location (arrows) in f′); in the intensity plot (h) correlation of TRITC did not occur with GFP (region denoted with dotted line in g). This was also true for the S229F mutant, where coincidence of GFP was not seen with troponin (i′, j′ and k′; supported by the intensity plot in l with region denoted with dotted line in k). Note that the low intensity peaks (see the scale for TRITC fluorescence in h with that in d) observed in the troponin channel in h come from fluorescence from adjacent z-planes, i.e. out-of-focus objects not apparent in the image. Similarly, the TRITC peak in l comes from a ‘crossing’ sarcomere. Images shown are representative of sarcomeric phenotypes for each experimental group. Scale bar in c, g and k is 10 μm, and in c′, g′ and k′ is 2 μm.
Fig. 4
Fig. 4
TPM1-morpholino treatment leads to abnormal looping. Embryos were treated at HH11 and harvested at HH19 (HH11/19) for both the control (A, B) and TPM1-MO (C–E) groups. External phenotypic analysis shows a subset of TPM1-MO embryos displayed looping defects (n = 4; D, E) in comparison to control and normally looped TPM1-MO embryo hearts (n = 137 and 96, respectively; A–C). Stereological analysis revealed normal cardiac tissue proportions (atrium, ventricle and outflow tract) between control and TPM1-MO embryos (n = 11 and 13, respectively; F). Scale bars: 500 μm. h, head; asterisk, outflow tract; OFT, outflow tract; v, ventricle.
Fig. 5
Fig. 5
TPM1 morpholino treatment results in abnormal atrial septa and trabeculae formation. A. Untreated (UT), standard control (SC) (a, b, d, e), and TPM1-MO (c, f) hearts were imaged at low (top panel) and high (lower panel) magnifications. The septum in the TPM1-MO heart (c; n = 27/69) was smaller compared to control hearts (a, b; n = 60). Scale bars a–c: 100 μm; d–f: 200 μm. B. Serial sections through one TPM1-MO embryo revealed a double septum. One septum originated from the atrial wall (a), followed by a second, smaller septum (b, c, d). Deeper sections showed the fusion of these two septa (e, f). Scale bar: 200 μm. Arrows denote septa. C. UT and SC embryos contained normal trabeculae projecting into the ventricular chamber (a, b; n = 60). In contrast, TPM1-MO hearts showed reduced trabecular size and number (c; n = 25/69) or complete absence of trabeculae (d; n = 1/69). Asterisks denote trabeculae. Scale bar: 100 μm. D. Stereological analysis of heart regions revealed that TPM1-MO hearts had decreased ventricular wall and trabeculae proportions (denoted as Vent wall) and an increased ventricular lumen size compared with controls. Mean ± SEM; *P < 0.05. Asterisk, trabeculae; At, atrium; ECM, extracellular matrix, OFT, outflow tract; V, ventricle.
Fig. 6
Fig. 6
Apoptosis increased in the atrial septum and ventricular wall of TPM1-MO hearts. Apoptosis was measured in UT, SC (pooled as controls; n = 6) and TPM1-MO hearts (n = 7). Apoptosis was significantly increased in the atrial septum and ventricles of TPM1-MO hearts, *P < 0.05 ***P < 0.001.
Fig. 7
Fig. 7
TPM1-MO treatment leads to immature sarcomere assembly. A. Sarcomere assembly was categorized into 4 stages: stage 1 immature myofibril assembling at the periphery of the cell with no fibril structures present (Aa and b); stage 2 fibres present in a disorganised fashion (Ac and d); stage 3 thin but organised fibrils (Ae and f); stage 4 fully developed thick fibrils running across the cell (Ag and h). Control indicates cells that were not treated with TPM1 morpholino, while TPM1-MO indicates cells treated with morpholino for 48 h. Scale bar: 16 μm. B. TPM1-MO treatment resulted in significant increases in stage 1 and stage 2 immature cells, significant decreases in the number of stage 4 cells and reduced (but not significantly) number of stage 3 cells. *P < 0.05 ***P < 0.001.
Fig. 8
Fig. 8
TPM1-MO treatment alters action potentials in cardiomyocytes. A–D. Graphs showing changes in AP amplitude (A) and duration (B) between atrial and ventricular cardiomyocytes in control and TPM1-MO hearts. Representative AP traces from atrial (C) and ventricular cardiomyocytes (D) for control (black traces) and TMP1-treated (dotted traces) hearts were superimposed to show amplitude and duration changes. E–G. Graphs showing changes in the rate of depolarisation (δv/δt) of the atrial and ventricular cardiomyocytes from control and TPM1-MO hearts (E). Representative AP traces of the maximal δv/δt from both atrial (F) and ventricular (G) cardiomyocytes for control (black traces) and TPM1-MO hearts (dotted traces) are shown.

Similar articles

Cited by

References

    1. Hamburger V., Hamilton H.L. A series of normal stages in the development of the chick embryo. J. Morphol. 1951;88:49–92. - PubMed
    1. Sissman N.J. Developmental landmarks in cardiac morphogenesis: comparative chronology. Am. J. Cardiol. 1970;25:141–148. - PubMed
    1. Morse D.E. Scanning electron microscopy of the developing septa in the chick heart. Birth Defects Orig. Artic. Ser. 1978;14:91–107. - PubMed
    1. Bentham J., Bhattacharya S. Genetic mechanisms controlling cardiovascular development. Ann. N. Y. Acad. Sci. 2008;1123:10–19. - PubMed
    1. Ching Y.H., Ghosh T.K., Cross S.J., Packham E.A., Honeyman L., Loughna S. Mutation in myosin heavy chain 6 causes atrial septal defect. Nat. Genet. 2005;37:423–428. - PubMed

Publication types