

Transcriptional response to hepatitis C virus infection and interferon-alpha treatment in the human liver
- PMID: 28360091
- PMCID: PMC5452008
- DOI: 10.15252/emmm.201607006
Transcriptional response to hepatitis C virus infection and interferon-alpha treatment in the human liver
Abstract
Hepatitis C virus (HCV) is widely used to investigate host-virus interactions. Cellular responses to HCV infection have been extensively studied in vitro However, in human liver, interferon (IFN)-stimulated gene expression can mask direct transcriptional responses to infection. To better characterize the direct effects of HCV infection in vivo, we analyze the transcriptomes of HCV-infected patients lacking an activated endogenous IFN system. We show that expression changes observed in these patients predominantly reflect immune cell infiltrates rather than cell-intrinsic pathways. We also investigate the transcriptomes of patients with endogenous IFN activation, which paradoxically cannot eradicate viral infection. We find that most IFN-stimulated genes are induced by both recombinant IFN therapy and the endogenous IFN system, but with lower induction levels in the latter, indicating that the innate immune response in chronic hepatitis C is too weak to clear the virus. We show that coding and non-coding transcripts have different expression dynamics following IFN treatment. Several microRNA primary transcripts, including that of miR-122, are significantly down-regulated in response to IFN treatment, suggesting a new mechanism for IFN-induced expression fine-tuning.
Keywords: HCV; hepatitis C; interferon; miRNAs; transcriptome.
© 2017 The Authors. Published under the terms of the CC BY 4.0 license.
Figures

Expression levels of 20 interferon‐stimulated genes (ISGs) in 28 liver biopsies from HCV‐infected and non‐HCV‐infected patients, in the absence of treatment. These ISGs were previously detected as consistently stimulated by pegIFN‐α across five time points between 4 and 144 h, in chronic hepatitis C (CHC) patients (Dill et al, 2014). The heatmap represents the Z‐score (centered and scaled values) of log2‐transformed RPKM (reads per kilobase of exon per million mapped reads) expression levels, normalized based on housekeeping genes (Materials and Methods). The samples (columns) and genes (rows) were hierarchically clustered based on pairwise Euclidean distances. The HCV genotype and the METAVIR scores for inflammation (A0 to A3) and fibrosis (F0 to F4) are displayed for each patient. Blank rectangles correspond to non‐infected samples.
Barplot of the HCV viral load for each patient, ordered as in (A). Blank spaces correspond to non‐infected samples.

Volcano plot for the differential expression analysis between non‐CHC patients and CHC patients with low levels of endogenous ISG activation (CHC low ISG). The x‐axis represents the log2‐fold expression change in CHC low‐ISG patients compared to non‐CHC patients. The y‐axis represents the false discovery rate (with a −log10 transformation) of the differential expression test. Protein‐coding genes, candidate long non‐coding RNAs (lncRNAs), and other gene categories (including pseudogenes and transcripts with unclear coding potential; Materials and Methods) are represented separately. Genes with false discovery rate (FDR) < 10% and with fold expression change ≥ 1.5 are shown.
Heatmap of the expression patterns of the top differentially expressed protein‐coding genes. We set a fold change threshold of 3 for up‐regulated genes and of 0.5 for down‐regulated genes. The heatmap represents the Z‐score of the log2‐transformed RPKM (reads per kilobase of exon per million mapped reads) gene expression levels, normalized based on housekeeping genes (Materials and Methods).
Barplots representing the expression patterns of three categories of genes (all expressed genes, genes up‐regulated in CHC low‐ISG samples, and genes down‐regulated in CHC low‐ISG samples compared to control non‐CHC samples), in the GTEx tissue transcriptome collection. For each expressed gene, we scored the tissue or cell type in which its maximum expression level was reached (Materials and Methods). The height of the rectangles represents the percentage of genes that reaches maximum expression in each of the tissues.
Boxplots of the intensity of the expression change (log2‐fold) between non‐CHC patients and CHC low‐ISG patients, for different categories of protein‐coding genes defined based on the miRNAs that are predicted to target them. Only miRNAs with high expression in normal or HCV‐infected liver were analyzed (Hou et al, 2011). Evolutionarily conserved miRNA target predictions were extracted from TargetScan v7.1 (Agarwal et al, 2015; Materials and Methods). From left to right: genes that are not conserved targets of any expressed miRNA; genes that are targeted by at least one expressed miRNA; genes that are targeted by miR‐122‐5p, miR‐192/215, let7a‐i/miR‐98, and miR‐199a/199b, respectively. Horizontal bars represent median values. Boxes represent the inter‐quartile (25–75%) ranges of the distribution. Boxplot whiskers extend to the most extreme data point found within 1.5 times the inter‐quartile distance from the box. Outlier points are not shown.

Volcano plot for the differential expression analysis between non‐CHC patients and CHC patients with high levels of endogenous ISG activation (CHC high ISG). The x‐axis represents the log2‐fold expression change in CHC high‐ISG compared to non‐CHC patients. The y‐axis represents the false discovery rate (with a −log10 transformation) of the differential expression test. Protein‐coding genes, candidate long non‐coding RNAs (lncRNAs), and other gene categories (including pseudogenes and transcripts with unclear coding potential; Materials and Methods) are represented separately. Only genes with false discovery rate (FDR) < 10% and with fold expression change > 1.5 are shown.
Heatmap of the expression patterns of the top differentially expressed genes between non‐CHC and CHC high‐ISG patients. To select the top differentially expressed genes, we set a fold change threshold of 5 for up‐regulated genes and of 1/3 for down‐regulated genes. The heatmap represents the Z‐score of the log2‐transformed RPKM (reads per kilobase of exon per million mapped reads) gene expression levels, normalized based on housekeeping genes (Materials and Methods).
Example of a lncRNA (NRIR; Kambara et al, 2014) significantly up‐regulated in high‐ISG patients. The boxplots represent the distribution of expression levels (log2‐transformed RPKM) for the three categories of samples. Each point represents an individual sample. Horizontal bars represent median values. Boxes represent the inter‐quartile (25–75%) ranges of the distribution. Boxplot whiskers extend to the most extreme data point found within 1.5 times the inter‐quartile distance from the box.
Boxplots of the intensity of the expression change (log2‐fold) between non‐CHC patients and CHC high‐ISG patients, for different categories of protein‐coding genes defined based on the miRNAs that are predicted to target them. Only miRNAs with high expression in normal or HCV‐infected liver were analyzed (Hou et al, 2011). Evolutionarily conserved miRNA target predictions were extracted from TargetScan v7.1 (Agarwal et al, 2015; Materials and Methods). From left to right: genes that are not conserved targets of any expressed miRNA; genes that are targeted by at least one expressed miRNA; genes that are targeted by miR‐122‐5p, miR‐192/215, let7a‐i/miR‐98, and miR‐199a/199b, respectively. Horizontal bars represent median values. Boxes represent the inter‐quartile (25–75%) ranges of the distribution. Boxplot whiskers extend to the most extreme data point found within 1.5 times the inter‐quartile distance from the box. Outlier points are not shown.

- A
Venn diagram depicting the intersection between protein‐coding genes that are differentially expressed (FDR < 10%, minimum absolute fold change 1.5) between non‐CHC patients, CHC patients with low endogenous ISG levels (CHC low ISG) and CHC patients with high endogenous ISG levels (CHC high ISG). Up‐regulated and down‐regulated genes are analyzed separately.
- B
Comparison of the log2‐fold expression change for the two differential expression analyses: x‐axis, CHC low‐ISG compared with non‐CHC patients; y‐axis, CHC high‐ISG compared with non‐CHC patients. Blue: genes significant in both comparisons; red: genes significant only for high‐ISG patients; orange: genes significant only for low‐ISG patients. Only protein‐coding genes are displayed.
- C, D
Similar to (B) for genes that are down‐regulated (C) or up‐regulated (D) only in the comparison between non‐CHC and CHC low‐ISG patients. The vertical dotted lines represent the absolute fold change threshold of 1.5 (0.58 in log2 scale). The numbers depicted at the top of the plot represent the number of genes in each expression fold change interval (below 1/1.5, between 1/1.5 and 1, between 1 and 1.5, and above 1.5). x‐Axis: log2‐fold expression change in high‐ISG patients compared to controls. y‐Axis: log2‐fold expression change in low‐ISG patients compared to controls.
- E, F
Similar to (B) for genes that are down‐regulated (E) or up‐regulated (F) only in the comparison between non‐CHC and CHC high‐ISG patients. The vertical dotted lines represent the absolute fold change threshold of 1.5 (0.58 in log2 scale). The numbers depicted at the top of the plot represent the number of genes in each expression fold change interval (below 1/1.5, between 1/1.5 and 1, between 1 and 1.5, and above 1.5). x‐Axis: log2‐fold expression change in low‐ISG patients compared to controls. y‐Axis: log2‐fold expression change in high‐ISG patients compared to controls.

Numbers of differentially expressed genes following pegIFN‐α/ribavirin treatment in liver biopsies of CHC patients. Gene expression changes were tested between paired biopsies from the same patients, before and after treatment. Protein‐coding genes, lncRNAs, and other gene categories (including pseudogenes, and transcripts with unclear coding potential) are displayed separately. We retained genes with a false discovery rate (FDR) < 0.05, a minimum absolute fold change of 2 and expression level (RPKM) > 1 in at least one sample.
Barplot representing the proportion of genes that are up‐regulated (left) or down‐regulated (right) upon pegIFN‐α treatment at 1, 2, 3, 4, or 5 time points. Different categories of genes are color‐coded.

- A, B
Differential expression patterns of the genes that are significantly up‐regulated (A) or down‐regulated (B) (FDR < 0.05 and minimum absolute fold change 2) following pegIFN‐α/ribavirin treatment at different time points, in the comparison between CHC low‐ISG and CHC high‐ISG patients. x‐Axis: log2‐fold expression change in pegIFN‐α‐treated compared to control biopsies. y‐Axis: log2‐fold expression change in high‐ISG patients compared to low‐ISG patients. Blue dots: genes also significantly differentially expressed in the low ISG versus high‐ISG comparison (FDR < 0.1); red dots: genes significant only in the pegIFN‐α analysis; black dots: genes not tested in low ISG versus high‐ISG comparison due to low or highly variable expression levels (Materials and Methods). The numbers of the genes in each category are depicted on the plot area, with the same color code.
- C, D
Histogram of the difference in expression levels (log2‐transformed RPKM) between samples treated with pegIFN‐α/ribavirin and CHC high‐ISG samples, for the genes that are significantly up‐regulated (C) or down‐regulated (D) (FDR < 0.05 and minimum absolute fold change 2) following pegIFN‐α/ribavirin treatment at different time points. The differences were computed between expression levels averaged across all relevant samples.

Comparison between expression levels (log2‐transformed RPKM values) in samples obtained after pegIFN‐α/ribavirin treatment and in high‐ISG patients (in the absence of treatment), for genes predicted to act as antiviral effectors based on experiments in Huh‐7.5 cells (Schoggins et al, 2011; Metz et al, 2013). Only genes that are significantly up‐regulated (FDR < 0.05, no fold change threshold) following pegIFN‐α/ribavirin treatment are shown. Blue: genes that are also significantly differentially expressed (FDR < 0.1) between low‐ISG and high‐ISG patients. Red: genes that are not significant in the comparison between low‐ISG and high‐ISG patients (FDR ≥ 0.1). Black: genes not tested in the comparison between low‐ISG and high‐ISG patients due to low or variable expression levels (Materials and Methods).
Expression patterns of six putative antiviral effector genes that are not significantly different between low‐ISG and high‐ISG patients (FDR ≥ 0.1). We selected genes reported in both publications (Schoggins et al, 2011; Metz et al, 2013) which were significantly up‐regulated following pegIFN‐α/ribavirin treatment in our samples, but not between low‐ISG and high‐ISG patients. All resulting genes are shown. y‐Axis: log2‐transformed RPKM levels. x‐Axis: different categories of samples. Gray: control, non‐CHC patients; green: CHC low‐ISG samples; orange: CHC high‐ISG samples; red: biopsies obtained after pegIFN‐α/ribavirin treatment, at different time points. The dots represent individual samples. Boxplots are super‐imposed over the individual expression levels. Horizontal bars represent median values. Boxes represent the inter‐quartile (25–75%) ranges of the distribution. Boxplot whiskers extend to the most extreme data point found within 1.5 times the inter‐quartile distance from the box.
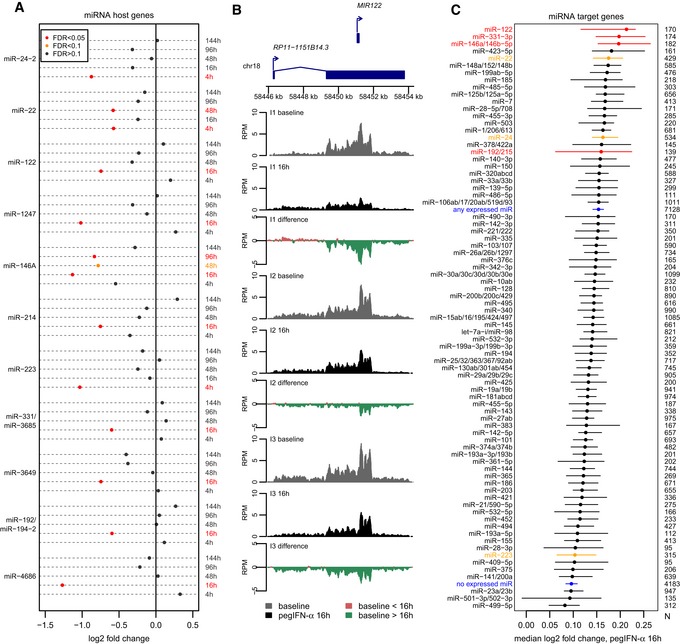
Dot‐chart representing the expression changes of 11 miRNA host genes following pegIFN‐α treatment, at different time points. Red: significant changes, FDR < 0.05; orange: FDR between 0.05 and 0.1; black: FDR > 0.1.
RNA‐seq coverage profiles along the miR‐122 host gene, for pre‐treatment and post‐treatment biopsies at the 16‐h time point, for the three analyzed individuals (here termed I1, I2, and I3). Gray: normalized read coverage for baseline/pre‐treatment biopsies. Black: normalized read coverage for post‐treatment biopsies. Red: positive difference between post‐treatment and pre‐treatment biopsies. Green: negative difference between post‐treatment and pre‐treatment biopsies.
Dot‐chart of the median fold expression change following pegIFN‐α/ribavirin treatment at the 16‐h time point, for predicted targets of miRNAs whose hosts are down‐regulated (red dots) or of other miRNAs (black dots). We show 79 miRNA families with at least 100 conserved target genes. As a control, we show the median fold expression change for all genes predicted to be targets of any liver‐expressed miRNAs or of genes not predicted to be targeted by these miRNAs (blue dots). The horizontal bars represent 95% confidence intervals of the median, constructed with a bootstrap resampling approach (Materials and Methods). Only miRNAs with high expression in normal or HCV‐infected liver were analyzed (Hou et al, 2011). Evolutionarily conserved miRNA target predictions were extracted from TargetScan v7.1 (Agarwal et al, 2015; Materials and Methods). miRNAs highlighted in red correspond to primary miRNA transcripts significantly down‐regulated at the 16‐h time point; miRNAs highlighted in orange correspond to primary miRNA transcripts significantly down‐regulated at other time points.
References
-
- Altschul SF, Gish W, Miller W, Myers EW, Lipman DJ (1990) Basic local alignment search tool. J Mol Biol 215: 403–410 - PubMed
-
- Asselah T, Bieche I, Narguet S, Sabbagh A, Laurendeau I, Ripault MP, Boyer N, Martinot‐Peignoux M, Valla D, Vidaud M et al (2008) Liver gene expression signature to predict response to pegylated interferon plus ribavirin combination therapy in patients with chronic hepatitis C. Gut 57: 516–524 - PubMed
-
- Bedossa P, Poynard T (1996) An algorithm for the grading of activity in chronic hepatitis C. The METAVIR Cooperative Study Group. Hepatology 24: 289–293 - PubMed
Publication types
MeSH terms
Substances
LinkOut - more resources
Full Text Sources
Other Literature Sources
Molecular Biology Databases
