An official website of the United States government
The .gov means it’s official.
Federal government websites often end in .gov or .mil. Before
sharing sensitive information, make sure you’re on a federal
government site.
The site is secure.
The https:// ensures that you are connecting to the
official website and that any information you provide is encrypted
and transmitted securely.
The human reference genome is part of the foundation of modern human biology and a monumental scientific achievement. However, because it excludes a great deal of common human variation, it introduces a pervasive reference bias into the field of human genomics. To reduce this bias, it makes sense to draw on representative collections of human genomes, brought together into reference cohorts. There are a number of techniques to represent and organize data gleaned from these cohorts, many using ideas implicitly or explicitly borrowed from graph-based models. Here, we survey various projects underway to build and apply these graph-based structures-which we collectively refer to as genome graphs-and discuss the improvements in read mapping, variant calling, and haplotype determination that genome graphs are expected to produce.
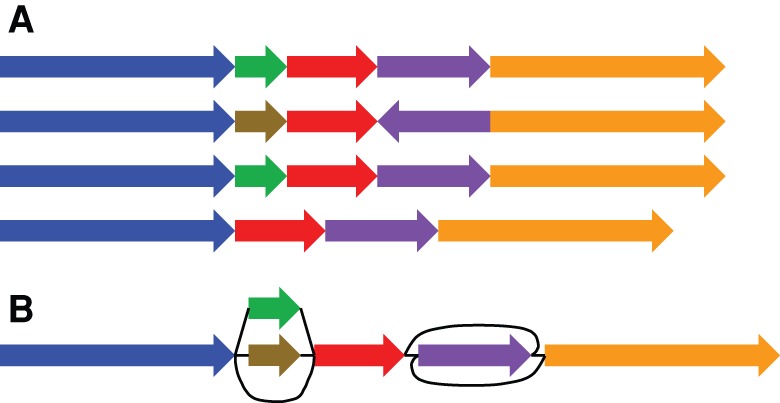
Schematic representation of two population-level reference structures. ( A ) A reference cohort,…
Figure 1.
Schematic representation of two population-level reference structures. (A) A reference cohort, in which there is no attempt to identify homologies between the genome sequences. (B) A genome graph, in which homologies are collapsed and included as alternate paths in the graph.
Figure 2.
Four types of genome graphs,…
Figure 2.
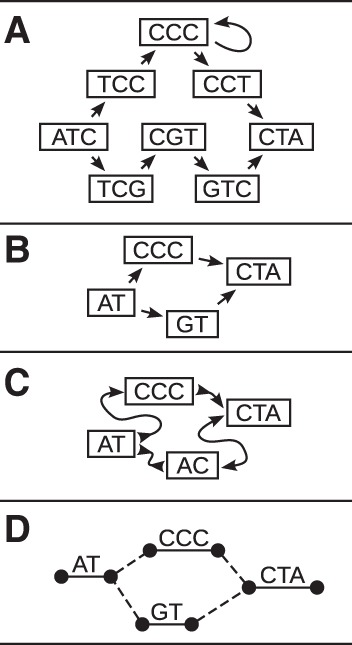
Four types of genome graphs, all constructed from the pair of sequences ATCCCCTA …
Figure 2.
Four types of genome graphs, all constructed from the pair of sequences ATCCCCTA and ATGTCTA. (A) De Bruijn graph. (B) Directed acyclic graph. (C) Bidirected graph (a.k.a., sequence graph). (D) Biedged graph (a.k.a., biedged sequence graph).
Figure 3.
Ultrabubble sites in a biedged…
Figure 3.
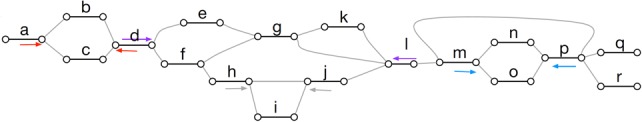
Ultrabubble sites in a biedged sequence graph. Each arrow shows the terminal node…
Figure 3.
Ultrabubble sites in a biedged sequence graph. Each arrow shows the terminal node of a site. The color of the arrows indicates the node pairing. Note that the ultrabubble denoted by the gray pair of arrows is nested within the ultrabubble denoted by the purple arrows. (Reprinted from Paten et al. 2017, with permission from the author.)
Figure 4.
A pangenome ordering on a…
Figure 4.
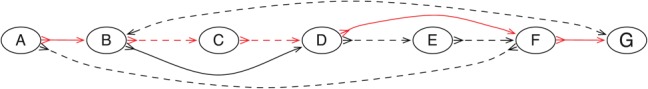
A pangenome ordering on a graph constructed from two genomes. The red edges…
Figure 4.
A pangenome ordering on a graph constructed from two genomes. The red edges indicate the path of the pangenome through the graph. The solid and dotted edges indicate the adjacencies between nodes in the two source genomes. (Adapted from Nguyen et al. 2015, with permission from the author.)
Figure 5.
A schematic example of an…
Figure 5.
A schematic example of an “Array Sequence Graph” of the type used to…
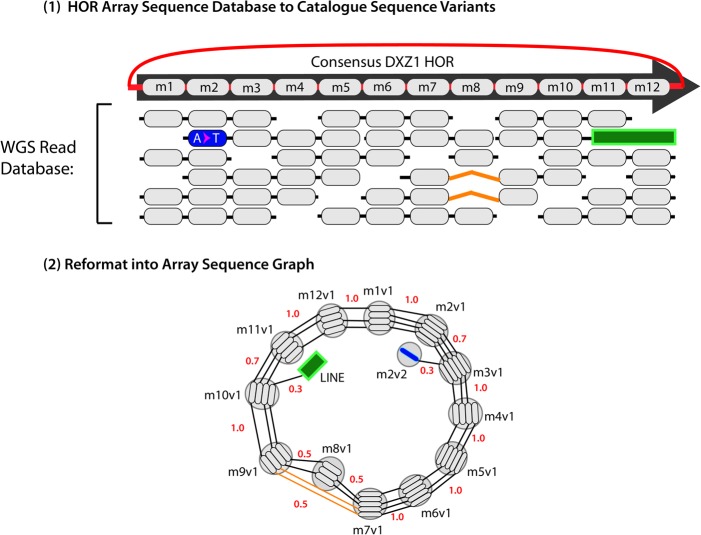
Figure 5.
A schematic example of an “Array Sequence Graph” of the type used to construct a linearization of the DXZ1 repeat array in the X Chromosome centromere (Miga et al. 2014). A collection of reads (top) shown in the context of a consensus higher-order repeat are converted into a graph representation (bottom). A cycle around the graph represents a higher-order repeat, and the individual repeat units (oblongs) are represented within each node (circles). Edges between individual repeat units represent phasing information from input reads. Transitions between nodes are annotated with probabilities. (Adapted from Miga et al. 2014, with permission from the author.)
Figure 6.
A reference genome graph hierarchy…
Figure 6.
A reference genome graph hierarchy (most collapsed graph at the top , less…
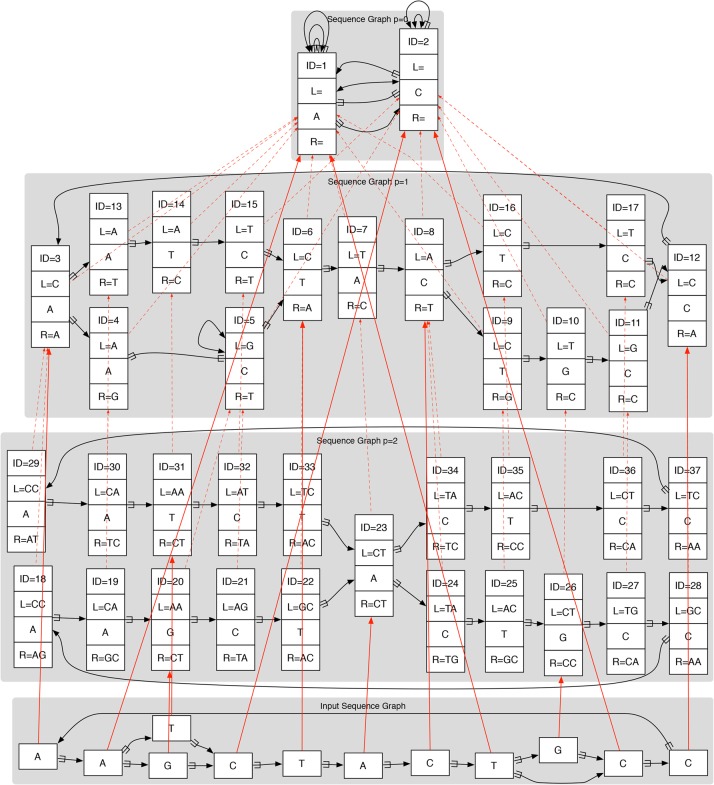
Figure 6.
A reference genome graph hierarchy (most collapsed graph at the top, less collapsed lower), with an input graph (bottom) mapped to it. All the graphs in the reference hierarchy are de Bruijn graphs. Dotted red lines show projections between graphs in the hierarchy, whereas solid red lines show mapping of the input sequence graph into the hierarchy. Here, each node has a unique ID, and the L and R strings represent flanking contexts mapping strings required for unique identification. (Reprinted from Paten et al. 2014, with permission from the author.)
Figure 7.
Distinct 1000 Genomes Project haplotypes…
Figure 7.
Distinct 1000 Genomes Project haplotypes embedded within a variation subgraph. Haplotypes are shown…
Figure 7.
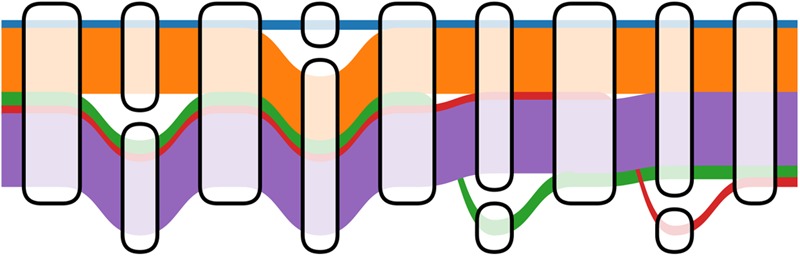
Distinct 1000 Genomes Project haplotypes embedded within a variation subgraph. Haplotypes are shown as colored ribbons with width proportional to the log of their frequency. The number of possible paths traversing left to right is 16, but only five are observed in the 1000 Genomes Project because of linkage disequilibrium. (Figure based on prototype by W Beyer, pers. comm.)
Figure 8.
Bidirected sequence graph ( A …
Figure 8.
Bidirected sequence graph ( A ) being unfolded into a directed acyclic graph…
Figure 8.
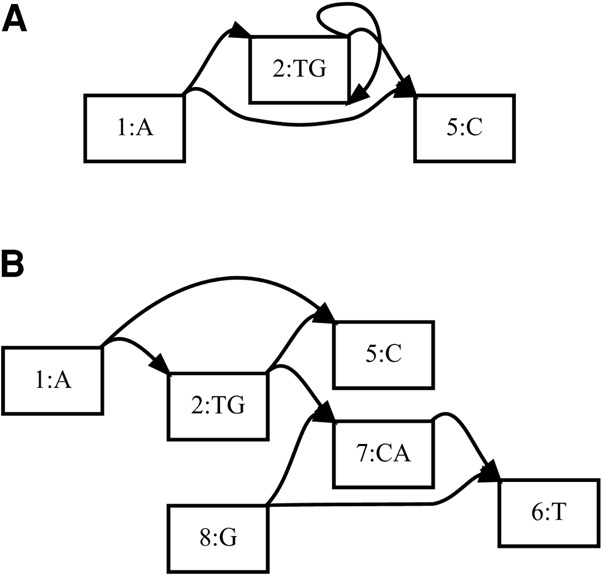
Bidirected sequence graph (A) being unfolded into a directed acyclic graph (B), in preparation for partial-order alignment. Node 6 is a reversed view of node 1, node 7 is a reversed view of node 2, and node 8 is a reversed view of node 5. (Reprinted from Garrison et al. [in prep], with permission from the author.)
The 1000 Genomes Project Consortium. 2015. A global reference for human genetic variation. Nature 526: 68–74.
-
PMC
-
PubMed
Brandt DY, Aguiar VR, Bitarello BD, Nunes K, Goudet J, Meyer D. 2015. Mapping bias overestimates reference allele frequencies at the HLA genes in the 1000 Genomes Project Phase I Data. G3 (Bethesda) 5: 931–941.
-
PMC
-
PubMed
Chaisson MJ, Huddleston J, Dennis MY, Sudmant PH, Malig M, Hormozdiari F, Antonacci F, Surti U, Sandstrom R, Boitano M, et al. 2015. Resolving the complexity of the human genome using single-molecule sequencing. Nature 517: 608–611.
-
PMC
-
PubMed
Church DM, Schneider VA, Graves T, Auger K, Cunningham F, Bouk N, Chen HC, Agarwala R, McLaren WM, Ritchie GRS, et al. 2011. Modernizing reference genome assemblies. PLoS Biol 9: e1001091.
-
PMC
-
PubMed
Church DM, Schneider VA, Steinberg KM, Schatz MC, Quinlan AR, Chin CS, Kitts PA, Aken B, Marth GT, Hoffman MM, et al. 2015. Extending reference assembly models. Genome Biol 16: 13.
-
PMC
-
PubMed