

Multiparametric Imaging of Organ System Interfaces
- PMID: 28360260
- PMCID: PMC5419074
- DOI: 10.1161/CIRCIMAGING.116.005613
Multiparametric Imaging of Organ System Interfaces
Abstract
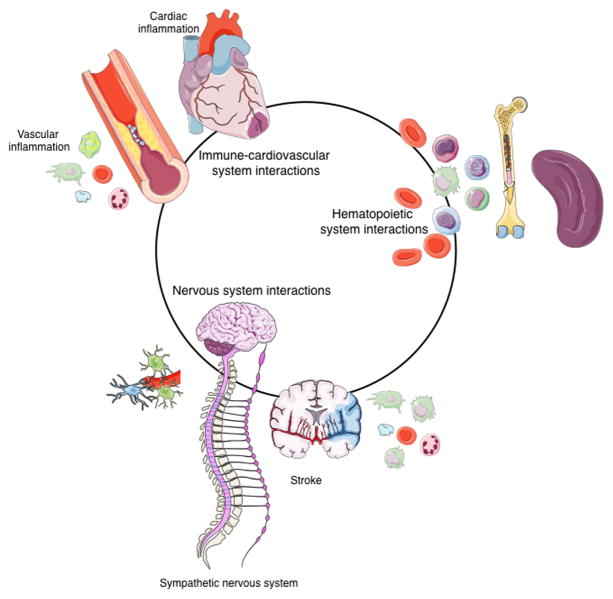
Cardiovascular diseases are a consequence of genetic and environmental risk factors that together generate arterial wall and cardiac pathologies. Blood vessels connect multiple systems throughout the entire body and allow organs to interact via circulating messengers. These same interactions facilitate nervous and metabolic system's influence on cardiovascular health. Multiparametric imaging offers the opportunity to study these interfacing systems' distinct processes, to quantify their interactions, and to explore how these contribute to cardiovascular disease. Noninvasive multiparametric imaging techniques are emerging tools that can further our understanding of this complex and dynamic interplay. Positron emission tomography/magnetic resonance imaging and multichannel optical imaging are particularly promising because they can simultaneously sample multiple biomarkers. Preclinical multiparametric diagnostics could help discover clinically relevant biomarker combinations pivotal for understanding cardiovascular disease. Interfacing systems important to cardiovascular disease include the immune, nervous, and hematopoietic systems. These systems connect with classical cardiovascular organs, such as the heart and vasculature, and with the brain. The dynamic interplay between these systems and organs enables processes, such as hemostasis, inflammation, angiogenesis, matrix remodeling, metabolism, and fibrosis. As the opportunities provided by imaging expand, mapping interconnected systems will help us decipher the complexity of cardiovascular disease and monitor novel therapeutic strategies.
Keywords: biomarkers; brain; cardiovascular diseases; hematopoietic system; systems biology.
© 2017 American Heart Association, Inc.
Figures
Similar articles
-
Multi-Modality Imaging in the Assessment of Cardiovascular Toxicity in the Cancer Patient.JACC Cardiovasc Imaging. 2018 Aug;11(8):1173-1186. doi: 10.1016/j.jcmg.2018.06.003. JACC Cardiovasc Imaging. 2018. PMID: 30092972 Review.
-
Imaging Risk in Multisystem Inflammatory Diseases.JACC Cardiovasc Imaging. 2019 Dec;12(12):2517-2537. doi: 10.1016/j.jcmg.2018.06.033. Epub 2019 Mar 13. JACC Cardiovasc Imaging. 2019. PMID: 30878436 Review.
-
Diagnosis of cancer therapy-related cardiovascular toxicities: A multimodality integrative approach and future developments.Arch Cardiovasc Dis. 2025 Mar;118(3):185-198. doi: 10.1016/j.acvd.2024.12.012. Epub 2025 Jan 30. Arch Cardiovasc Dis. 2025. PMID: 39947997 Review.
-
Emerging Roles for Adipose Tissue in Cardiovascular Disease.Arterioscler Thromb Vasc Biol. 2018 Aug;38(8):e137-e144. doi: 10.1161/ATVBAHA.118.311421. Arterioscler Thromb Vasc Biol. 2018. PMID: 30354196 Free PMC article. Review. No abstract available.
-
Multiorgan, Multimodality Imaging in Cardiometabolic Disease.Circ Cardiovasc Imaging. 2017 Nov;10(11):e005447. doi: 10.1161/CIRCIMAGING.117.005447. Circ Cardiovasc Imaging. 2017. PMID: 29122843 Free PMC article. Review.
Cited by
-
Myeloid cell contributions to cardiovascular health and disease.Nat Med. 2018 Jun;24(6):711-720. doi: 10.1038/s41591-018-0064-0. Epub 2018 Jun 4. Nat Med. 2018. PMID: 29867229 Free PMC article. Review.
-
Myeloid cells in cardiovascular organs.J Intern Med. 2019 May;285(5):491-502. doi: 10.1111/joim.12844. Epub 2018 Dec 25. J Intern Med. 2019. PMID: 30585362 Free PMC article. Review.
-
Triple-marker cardiac MRI detects sequential tissue changes of healing myocardium after a hydrogel-based therapy.Sci Rep. 2019 Dec 18;9(1):19366. doi: 10.1038/s41598-019-55864-7. Sci Rep. 2019. PMID: 31852978 Free PMC article.
-
Macrophages and Cardiovascular Health.Physiol Rev. 2018 Oct 1;98(4):2523-2569. doi: 10.1152/physrev.00068.2017. Physiol Rev. 2018. PMID: 30156496 Free PMC article. Review.
-
Whole-Body Atherosclerosis Imaging by Positron Emission Tomography/Magnetic Resonance Imaging: From Mice to Nonhuman Primates.Arterioscler Thromb Vasc Biol. 2020 May;40(5):1123-1134. doi: 10.1161/ATVBAHA.119.313629. Epub 2020 Apr 2. Arterioscler Thromb Vasc Biol. 2020. PMID: 32237905 Free PMC article. Review.
References
-
- Stephens DJ, Allan VJ. Light microscopy techniques for live cell imaging. Science. 2003;300:82–86. - PubMed
-
- Zipfel WR, Williams RM, Webb WW. Nonlinear magic: multiphoton microscopy in the biosciences. Nat Biotechnol. 2003;21:1369–1377. - PubMed
-
- Shaner NC, Steinbach PA, Tsien RY. A guide to choosing fluorescent proteins. Nat Methods. 2005;2:905–909. - PubMed
Publication types
MeSH terms
Substances
Grants and funding
LinkOut - more resources
Full Text Sources
Other Literature Sources
Research Materials
