

Aging increases cell-to-cell transcriptional variability upon immune stimulation
- PMID: 28360329
- PMCID: PMC5405862
- DOI: 10.1126/science.aah4115
Aging increases cell-to-cell transcriptional variability upon immune stimulation
Erratum in
-
Erratum for the Report: "Aging increases cell-to-cell transcriptional variability upon immune stimulation" by C. P. Martinez-Jimenez, N. Eling, H.-C. Chen, C. A. Vallejos, A. A. Kolodziejczyk, F. Connor, L. Stojic, T. F. Rayner, M. J. T. Stubbington, S. A. Teichmann, M. de la Roche, J. C. Marioni, D. T. Odom.Science. 2019 Dec 20;366(6472):eaba3487. doi: 10.1126/science.aba3487. Science. 2019. PMID: 31857449 No abstract available.
Abstract
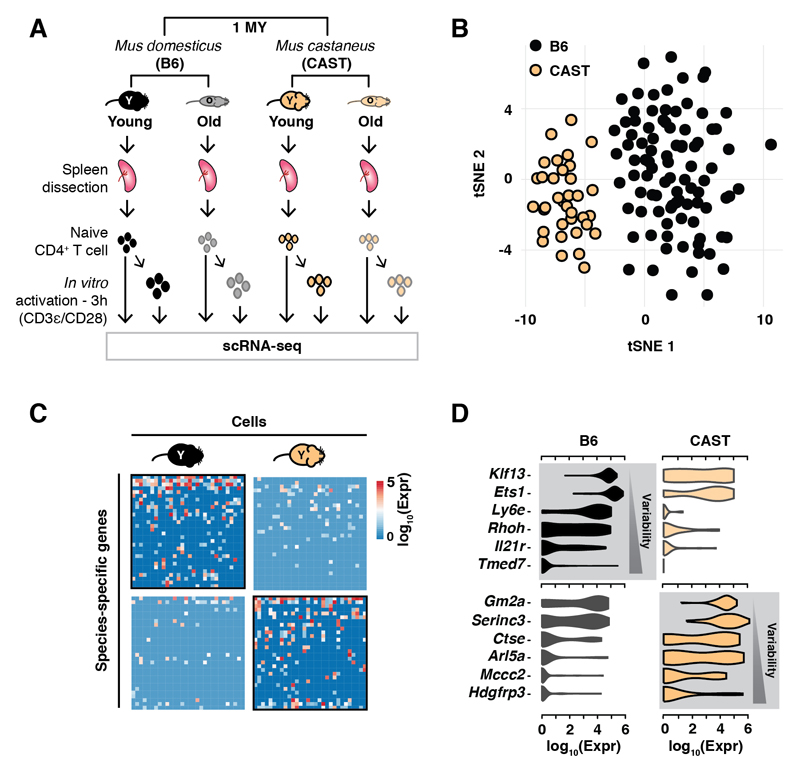
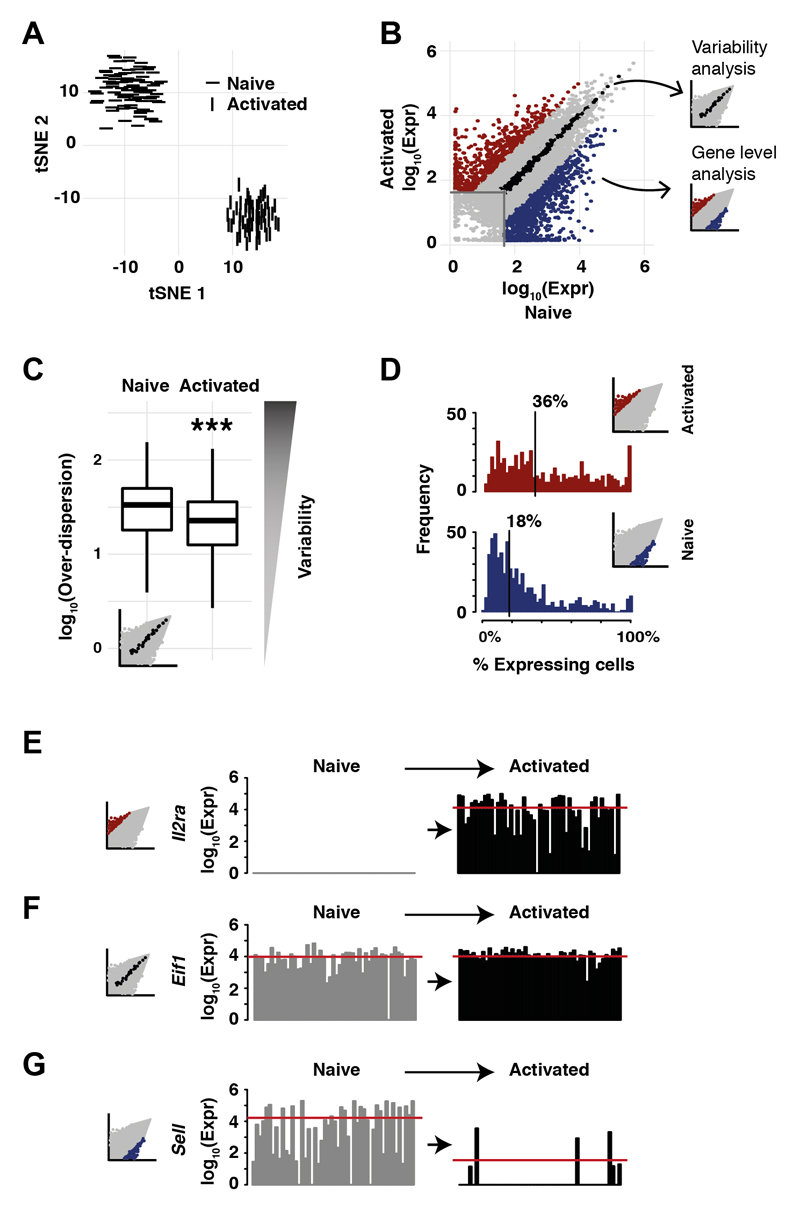
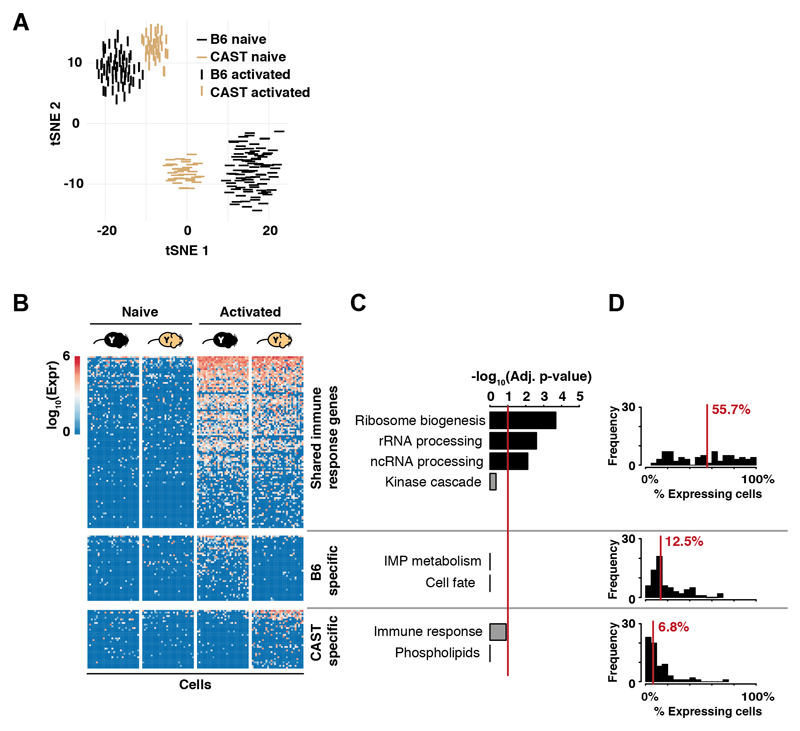
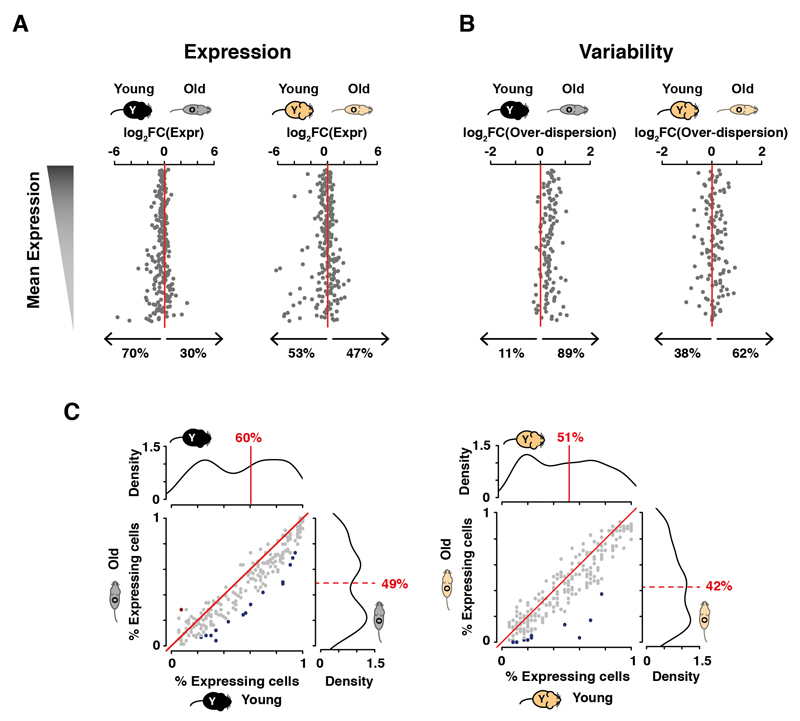
Aging is characterized by progressive loss of physiological and cellular functions, but the molecular basis of this decline remains unclear. We explored how aging affects transcriptional dynamics using single-cell RNA sequencing of unstimulated and stimulated naïve and effector memory CD4+ T cells from young and old mice from two divergent species. In young animals, immunological activation drives a conserved transcriptomic switch, resulting in tightly controlled gene expression characterized by a strong up-regulation of a core activation program, coupled with a decrease in cell-to-cell variability. Aging perturbed the activation of this core program and increased expression heterogeneity across populations of cells in both species. These discoveries suggest that increased cell-to-cell transcriptional variability will be a hallmark feature of aging across most, if not all, mammalian tissues.
Copyright © 2017, American Association for the Advancement of Science.
Figures
References
Publication types
MeSH terms
Substances
Grants and funding
- 22231/CRUK_/Cancer Research UK/United Kingdom
- MC_UP_0801/1/MRC_/Medical Research Council/United Kingdom
- 260507/ERC_/European Research Council/International
- A15603/CRUK_/Cancer Research UK/United Kingdom
- 17043/CRUK_/Cancer Research UK/United Kingdom
- 202878/Z/16/Z/WT_/Wellcome Trust/United Kingdom
- 615584/ERC_/European Research Council/International
- BB/I015914/3/BB_/Biotechnology and Biological Sciences Research Council/United Kingdom
- 22257/CRUK_/Cancer Research UK/United Kingdom
- 107609/WT_/Wellcome Trust/United Kingdom
- 202878ODOM/WT_/Wellcome Trust/United Kingdom
- A22257/CRUK_/Cancer Research UK/United Kingdom
- 646794/ERC_/European Research Council/International
- 098051/WT_/Wellcome Trust/United Kingdom
- MC_UU_00002/10/MRC_/Medical Research Council/United Kingdom
- 20412/CRUK_/Cancer Research UK/United Kingdom
LinkOut - more resources
Full Text Sources
Other Literature Sources
Medical
Molecular Biology Databases
Research Materials
