. 2017 Mar 30;7(1):510.
doi: 10.1038/s41598-017-00615-9.

Muscle-specific downregulation of GR levels inhibits adipogenesis in porcine intramuscular adipocyte tissue

Affiliations

Muscle-specific downregulation of GR levels inhibits adipogenesis in porcine intramuscular adipocyte tissue

Weiwei Chu et al. Sci Rep. .

Abstract

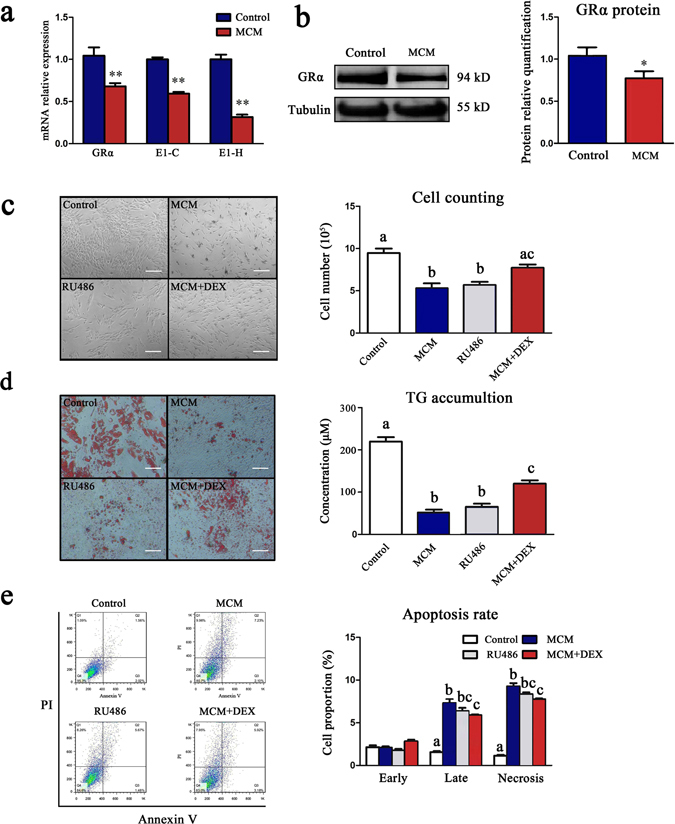
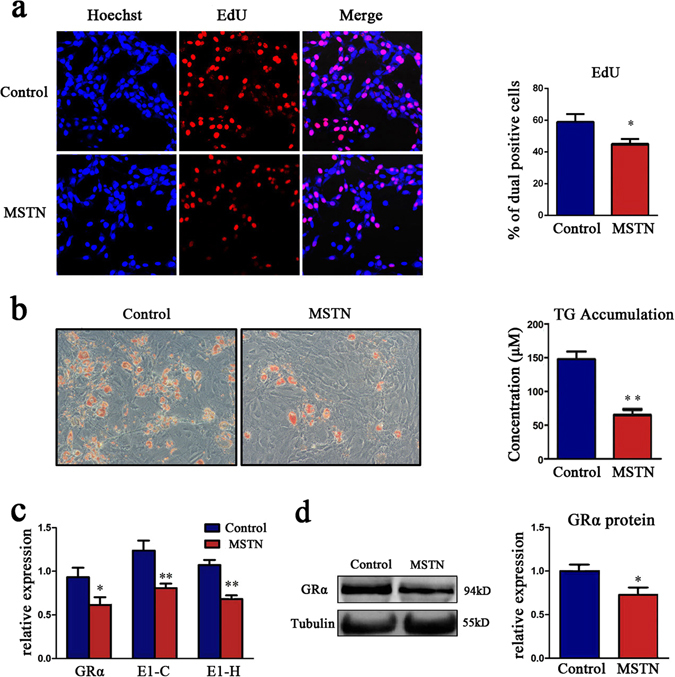
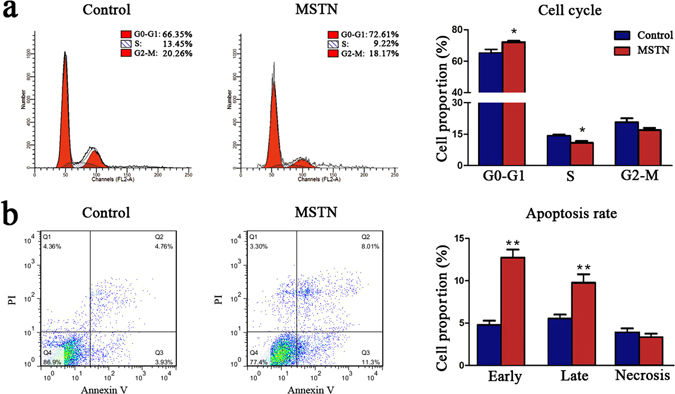
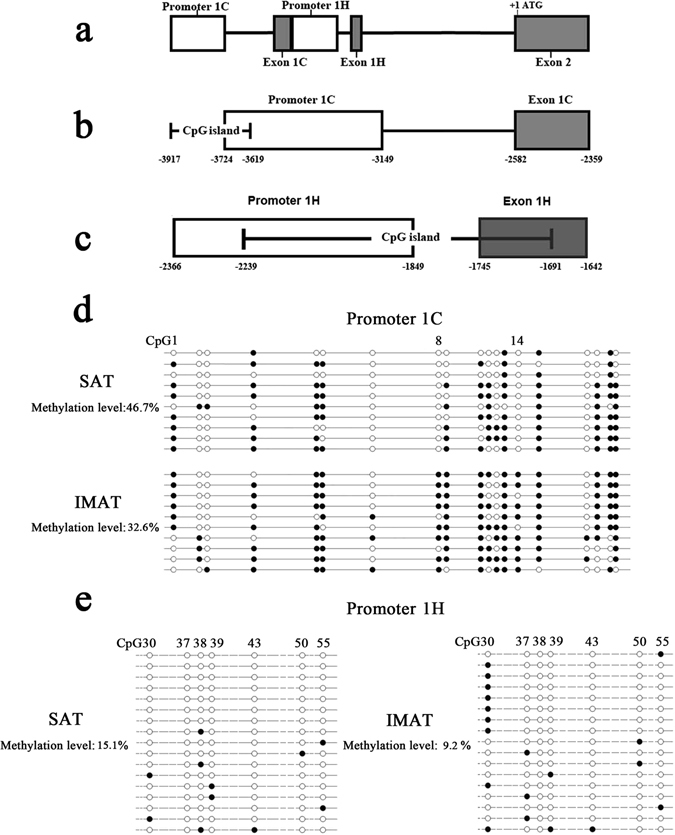
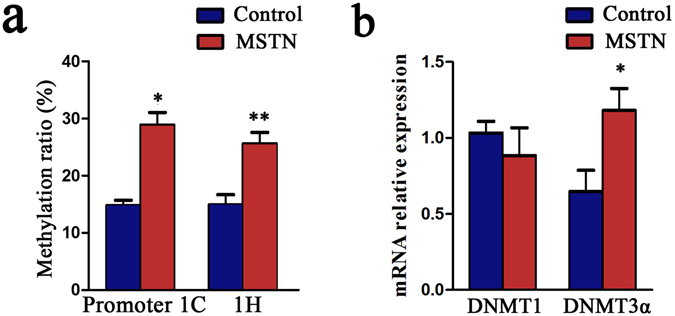
Intramuscular adipose is conducive to good pork quality, whereas subcutaneous adipose is considered as waste in pig production. So uncovering the regulation differences between these two adiposes is helpful to tissue-specific control of fat deposition. In this study, we found the sensitivity to glucocorticoids (GCs) was lower in intramuscular adipocytes (IMA) compared with subcutaneous adipocytes (SA). Comparison of glucocorticoid receptor (GR) revealed that IMA had lower GR level which contributed to its reduced GCs sensitivity. Higher methylation levels of GR promotor 1-C and 1-H were detected in IMA compared with SA. GR expression decrease was also found in adipocytes when treated with muscle conditioned medium (MCM) in vitro, which resulted in significant inhibition of adipocytes proliferation and differentiation. Since abundant myostatin (MSTN) was detected in MCM by ELISA assay, we further investigated the effect of this myokine on adipocytes. MSTN treatment suppressed adipocytes GR expression, cell proliferation and differentiation, which mimicked the effects of MCM. The methylation levels of GR promotor 1-C and 1-H were also elevated after MSTN treatment. Our study reveals the role of GR in muscle fiber inhibition on intramuscular adipocytes, and identifies myostatin as a muscle-derived modulator for adipose GR level.


Conflict of interest statement

The authors declare that they have no competing interests.

Figures

Figure 1
Figure 1
IMA was less sensitive to GCs than SA. (a) The EdU assay of SA and IMA pre-adipocytes. The porcine SA and IMA pre-adipocytes were treated with 1‰ ethanol or 100 nM DEX for 3 days, then the proliferating nuclei were stained red with EdU, the nuclei of all cells were stained blue with Hoechst for 2 hours. Three random pictures per group from confocal microscopy were used to count the cell numbers of EdU positive cells and Hoechst positive cells, and the ratio of the EdU positive cells to Hoechst positive cells was calculated in each picture. Data are shown as the mean ± SEM, n = 3 per group, *P < 0.05. (b) The differentiation of SA and IMA pre-adipocytes after induced with DEX. Cells were induced to differentiation by 2.5 μM DEX, and imaged by inverted microscope. Scale bar = 100 μm. (c) Triglyceride accumulation in SA and IMA treated as (b) was detected on day 9. Data are shown as the mean ± SEM, n = 3 per group, *P < 0.05. (d) mRNA expression of lipid metabolism genes in SA and IMA tissues of sows injected with 1 U/kg ACTH (n = 6) or equivalent volume saline (n = 6) intravenously per day for a total 9 days were detected. *Means significant differences between control and ACTH groups, *P < 0.05, **P < 0.01.
Figure 2
Figure 2
GR levels in IMA were lower than SA. Backfat and longissimus dorsi muscles were from 12 Erhualian sows, then the adipose tissues were collected for RNA and protein isolation. (a) Copy numbers of total GR, GRα, GRβ mRNA in SA and IMA tissues were detected by RT-qPCR. (b) The ratio of GRα/GRβ was displayed according to the result obtained in (a). Data are shown as the mean ± SEM, n = 12 per group, *P < 0.05. (c) Expression of GRα protein in SA and IMA tissues was detected by Western blot (left), and the relative protein expression level was displayed as column charts (right). n = 3 per group, **P < 0.01.
Figure 3
Figure 3
Expression patterns of GR exon 1 variants. (a) Copy number of GR exon 1 variants in SA and IMA tissues. n = 12 per group, *P < 0.05. (b) Variants proportion of GRα and GRβ in SA and IMA tissues. n = 6 per group, within column the different lowercases mean significant difference (One-way ANOVO, P < 0.05) within the columns, and the same lowercase means no significant difference (One-way ANOVO, P > 0.05).
Figure 4
Figure 4
Skeletal muscle conditioned medium inhibited the adipogenesis by reducing GRα expression. The subcutaneous pre-adipocytes were cultured with skeletal muscle conditioned medium (MCM) or ordinary medium for 3 days, then the cells were collected for RNA, protein isolation and flow cytometry assay. (a) The mRNA expression of GRα and E1-C, E1-H was detected by RT-qPCR, n = 6 per group. (b) Expression of GRα protein was detected by Western blot (left) and displayed as column charts after quantification (right), n = 3 per group, *P < 0.05. (c) The effects of MCM on the proliferation of pre-adipocytes were detected by cell imaging (left) and cell counting (right). Cells were cultured with normal culture medium, MCM medium, normal culture medium with 100 nM RU486, or 100 nM DEX + MCM medium respectively, n = 6 per group. The different lowercases mean significant difference (One-way ANOVO, P < 0.05) within the columns, and the same lowercase means no significant difference (One-way ANOVO, P > 0.05), the same below. (d) The effects of MCM on the pre-adipocytes differentiation. After reaching confluence, pre-adipocytes were induced to differentiation for 12 days, then the Oil-red O staining (left) and TG assay (right) were conducted. n = 3 per group. (e) The effects of MCM on the apoptosis of pre-adipocytes were detected by flow cytometry (left) and displayed as column charts after quantification (right), n = 3 per group.
Figure 5
Figure 5
MSTN inhibited adipogenesis and reduced GRα expression. (a) The effects of MSTN on the proliferation of subcutaneous pre-adipocytes. Pre-adipocytes were treated with 50 ng/ml MSTN for 2 days, then the proliferating nuclei were stained red with EdU for 2 hours, and nuclei of all cells were stained blue with Hoechst (left). Three random pictures per group from confocal microscopy were used to count the cell numbers of EdU positive cells and Hoechst positive cells, and the ratio of the EdU positive cells to Hoechst positive cells was calculated in each picture (right). (b) Oil red O staining (left) and TG assay (right), n = 3 per group. The pre-adipocytes were cultured in culture medium until full confluence, then the cells were induced to differentiation with PBS or 50 ng/ml MSTN for 9 days. (c) The mRNA expression of GRα, exon 1C and 1H was detected by RT-qPCR, n = 6 per group. (d) The protein expression of GRα was detected by Western blot (left) and displayed as column charts after quantification (right), n = 3 per group. *P < 0.05; **P < 0.01.
Figure 6
Figure 6
MSTN influenced cell cycles and apoptosis of adipocytes. Subcutaneous pre-adipocytes were treated with 50 ng/ml MSTN for 2 days and then harvested for further detection. (a) The effects of MSTN on the cell cycles of pre-adipocytes. Cells were stained with PI, then the cell cycles were detected by flow cytometry (left) and subsequently displayed as column charts after quantification (right), n = 3 per group. (b) The effects of MSTN on the apoptosis of pre-adipocytes. Cells were stained with PI and Annexin V, then the apoptosis rate was detected by flow cytometry (left) and displayed as column charts after quantification (right). n = 3 per group, *P < 0.05; **P < 0.01.
Figure 7
Figure 7
Methylation levels of promoter 1-C and 1-H were higher in IMA. (a) Locations of promoter 1-C and 1-H. The gray vertical bars represent the exons of GR gene; the open bar represents the promoter. (b) Location of CpG island in promoter 1-C. (c) Location of CpG islands in promoter 1-H. Nucleotide numbering is relative to + 1 at the initiating ATG codon. (d) Methylation status of promoter 1-C in IMA and SA. (e) Methylation status of promoter 1-H in IMA and SA. Each line represents an individual bacterial clone that was sequenced. Open circles indicate unmethylated CpG sites. Black circles indicate methylated CpG sites.
Figure 8
Figure 8
MSTN elevated the methylation levels of promoter 1-C and 1-H. After treated with 50 ng/ml MSTN for 2 days, the pre-adipocytes were harvested, then the methylation status of promoter 1-C and 1-H were detected by methylated DNA immunoprecipitation method (a), and the relative mRNA expression of DNA methyltransferase DNMT1 and DNMT3α were detected by RT-qPCR (b). n = 6 per group. *P < 0.05; **P < 0.01.

Similar articles

Cited by

References

    1. Tran TT, Kahn CR. Transplantation of adipose tissue and stem cells: role in metabolism and disease. Nat Rev Endocrinol. 2010;6:195–213. doi: 10.1038/nrendo.2010.20. - DOI - PMC - PubMed
    1. Hovenier R, Kanis E, Asseldonk TV, Westerink NG. Genetic parameters of pig meat quality traits in a halothane negative population. Livestock Production Science. 1992;32:309–321. doi: 10.1016/0301-6226(92)90002-L. - DOI
    1. Kouba M, Sellier P. A review of the factors influencing the development of intermuscular adipose tissue in the growing pig. Meat science. 2011;88:213–220. doi: 10.1016/j.meatsci.2011.01.003. - DOI - PubMed
    1. Kouba M, Bonneau M. Compared development of intermuscular and subcutaneous fat in carcass and primal cuts of growing pigs from 30 to 140 kg body weight. Meat science. 2009;81:270–274. doi: 10.1016/j.meatsci.2008.08.001. - DOI - PubMed
    1. Wang S, et al. Glucose utilization, lipid metabolism and BMP-Smad signaling pathway of porcine intramuscular preadipocytes compared with subcutaneous preadipocytes. Cellular physiology and biochemistry: international journal of experimental cellular physiology, biochemistry, and pharmacology. 2013;31:981–996. doi: 10.1159/000350116. - DOI - PubMed

Publication types

MeSH terms

LinkOut - more resources