

Sex differences in the influence of body mass index on anatomical architecture of brain networks
- PMID: 28360430
- PMCID: PMC5548596
- DOI: 10.1038/ijo.2017.86
Sex differences in the influence of body mass index on anatomical architecture of brain networks
Abstract
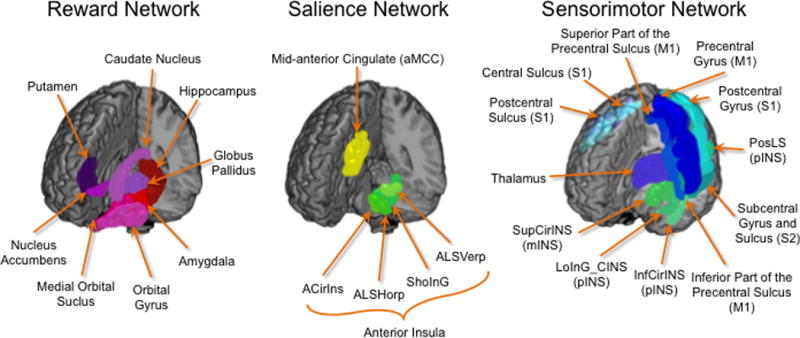
Background/objectives: The brain has a central role in regulating ingestive behavior in obesity. Analogous to addiction behaviors, an imbalance in the processing of rewarding and salient stimuli results in maladaptive eating behaviors that override homeostatic needs. We performed network analysis based on graph theory to examine the association between body mass index (BMI) and network measures of integrity, information flow and global communication (centrality) in reward, salience and sensorimotor regions and to identify sex-related differences in these parameters.
Subjects/methods: Structural and diffusion tensor imaging were obtained in a sample of 124 individuals (61 males and 63 females). Graph theory was applied to calculate anatomical network properties (centrality) for regions of the reward, salience and sensorimotor networks. General linear models with linear contrasts were performed to test for BMI and sex-related differences in measures of centrality, while controlling for age.
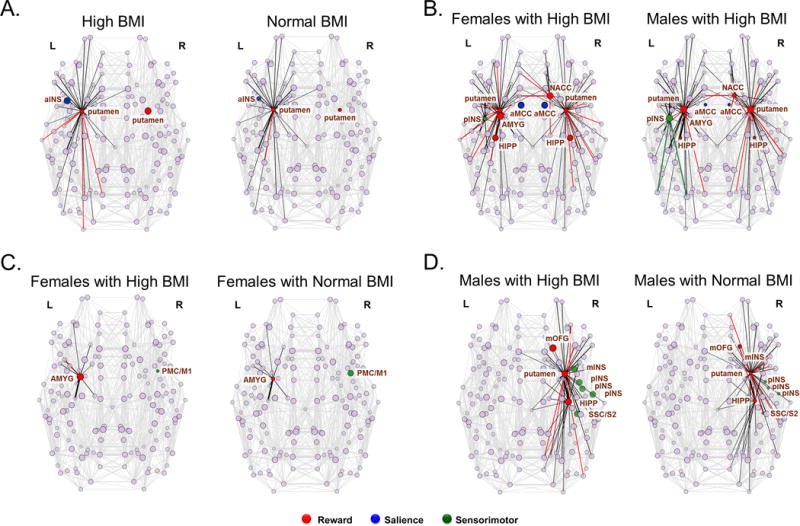
Results: In both males and females, individuals with high BMI (obese and overweight) had greater anatomical centrality (greater connectivity) of reward (putamen) and salience (anterior insula) network regions. Sex differences were observed both in individuals with normal and elevated BMI. In individuals with high BMI, females compared to males showed greater centrality in reward (amygdala, hippocampus and nucleus accumbens) and salience (anterior mid-cingulate cortex) regions, while males compared to females had greater centrality in reward (putamen) and sensorimotor (posterior insula) regions.
Conclusions: In individuals with increased BMI, reward, salience and sensorimotor network regions are susceptible to topological restructuring in a sex-related manner. These findings highlight the influence of these regions on integrative processing of food-related stimuli and increased ingestive behavior in obesity, or in the influence of hedonic ingestion on brain topological restructuring. The observed sex differences emphasize the importance of considering sex differences in obesity pathophysiology.
Conflict of interest statement
Figures
 Reward
 Salience
 Sensorimotor
Similar articles
-
Patterns of brain structural connectivity differentiate normal weight from overweight subjects.Neuroimage Clin. 2015 Jan 13;7:506-17. doi: 10.1016/j.nicl.2015.01.005. eCollection 2015. Neuroimage Clin. 2015. PMID: 25737959 Free PMC article.
-
Alterations in reward network functional connectivity are associated with increased food addiction in obese individuals.Sci Rep. 2021 Feb 9;11(1):3386. doi: 10.1038/s41598-021-83116-0. Sci Rep. 2021. PMID: 33564081 Free PMC article. Clinical Trial.
-
Obesity is marked by distinct functional connectivity in brain networks involved in food reward and salience.Behav Brain Res. 2015;287:127-34. doi: 10.1016/j.bbr.2015.03.016. Epub 2015 Mar 14. Behav Brain Res. 2015. PMID: 25779924
-
Reward processing in obesity, substance addiction and non-substance addiction.Obes Rev. 2014 Nov;15(11):853-69. doi: 10.1111/obr.12221. Epub 2014 Sep 29. Obes Rev. 2014. PMID: 25263466 Review.
-
Common and distinct networks underlying reward valence and processing stages: a meta-analysis of functional neuroimaging studies.Neurosci Biobehav Rev. 2011 Apr;35(5):1219-36. doi: 10.1016/j.neubiorev.2010.12.012. Epub 2010 Dec 24. Neurosci Biobehav Rev. 2011. PMID: 21185861 Free PMC article. Review.
Cited by
-
History of early life adversity is associated with increased food addiction and sex-specific alterations in reward network connectivity in obesity.Obes Sci Pract. 2019 Aug 30;5(5):416-436. doi: 10.1002/osp4.362. eCollection 2019 Oct. Obes Sci Pract. 2019. PMID: 31687167 Free PMC article.
-
Neuroimaging of Sex/Gender Differences in Obesity: A Review of Structure, Function, and Neurotransmission.Nutrients. 2020 Jun 30;12(7):1942. doi: 10.3390/nu12071942. Nutrients. 2020. PMID: 32629783 Free PMC article. Review.
-
Improvement in Uncontrolled Eating Behavior after Laparoscopic Sleeve Gastrectomy Is Associated with Alterations in the Brain-Gut-Microbiome Axis in Obese Women.Nutrients. 2020 Sep 24;12(10):2924. doi: 10.3390/nu12102924. Nutrients. 2020. PMID: 32987837 Free PMC article.
-
Whole-brain functional connectivity correlates of obesity phenotypes.Hum Brain Mapp. 2020 Dec;41(17):4912-4924. doi: 10.1002/hbm.25167. Epub 2020 Aug 17. Hum Brain Mapp. 2020. PMID: 32804441 Free PMC article.
-
Brain functional and structural magnetic resonance imaging of obesity and weight loss interventions.Mol Psychiatry. 2023 Apr;28(4):1466-1479. doi: 10.1038/s41380-023-02025-y. Epub 2023 Mar 14. Mol Psychiatry. 2023. PMID: 36918706 Free PMC article. Review.
References
-
- Lovejoy JC, Sainsbury A, Stock Conference Working G Sex differences in obesity and the regulation of energy homeostasis. Obesity reviews: an official journal of the International Association for the Study of Obesity. 2009;10(2):154–67. - PubMed
-
- Flegal KM, Carroll MD, Ogden CL, Curtin LR. Prevalence and Trends in Obesity Among US Adults, 1999–2008. Jama-J Am Med Assoc. 2010;303(3):235–241. - PubMed
-
- Ogden CL, Carroll MD, Kit BK, Flegal KM. Prevalence of obesity in the United States, 2009–2010. NCHS data brief. 2012;(82):1–8. - PubMed
Publication types
MeSH terms
Grants and funding
LinkOut - more resources
Full Text Sources
Other Literature Sources
