. 2017 Mar 15:10:70.
doi: 10.3389/fnmol.2017.00070. eCollection 2017.

Genetic Tracing of Cav3.2 T-Type Calcium Channel Expression in the Peripheral Nervous System

Affiliations

Genetic Tracing of Cav3.2 T-Type Calcium Channel Expression in the Peripheral Nervous System

Yinth A Bernal Sierra et al. Front Mol Neurosci. .

Abstract

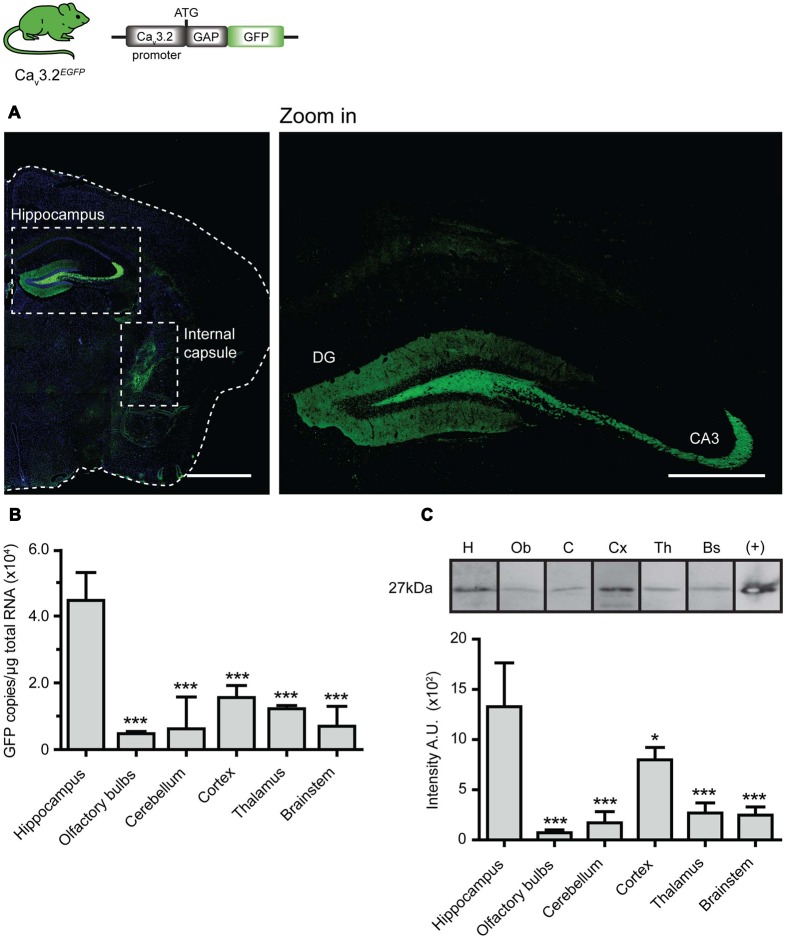
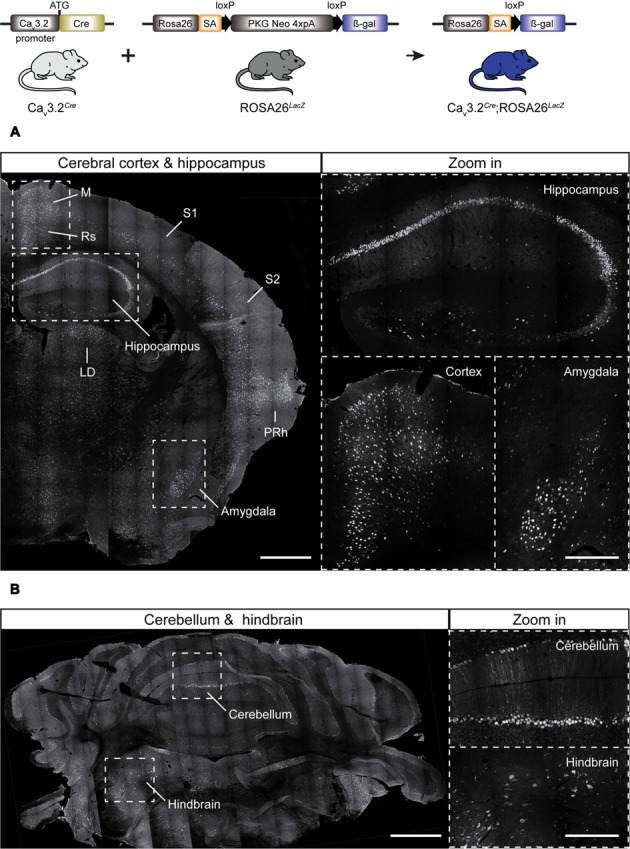
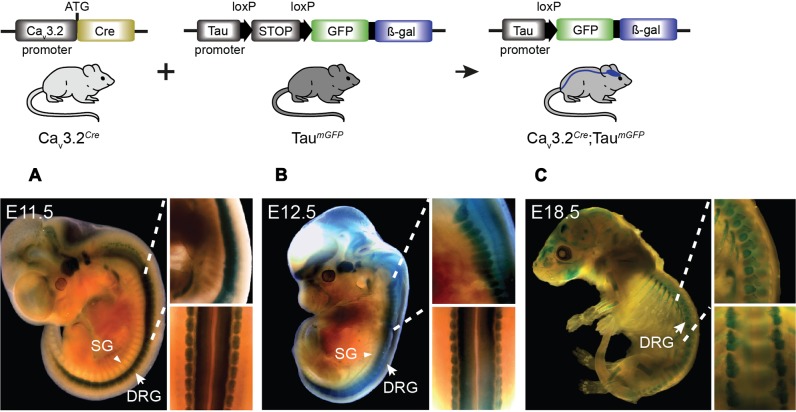
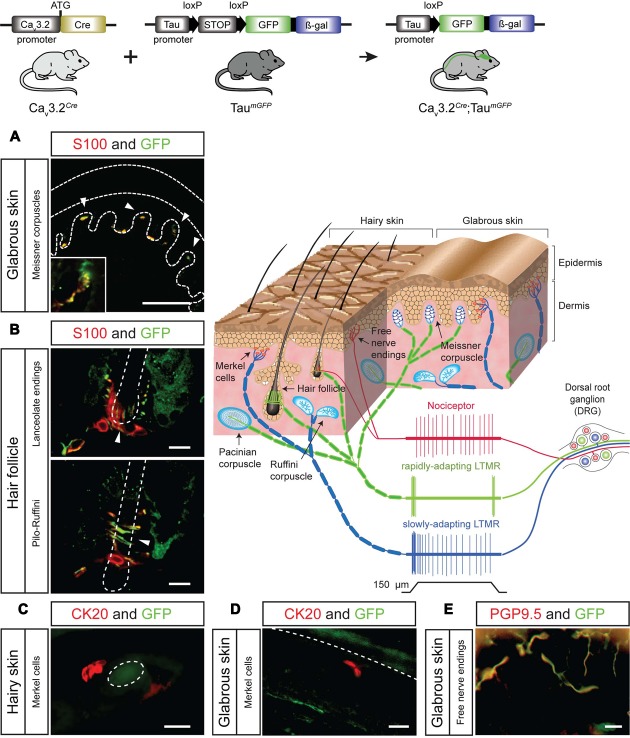
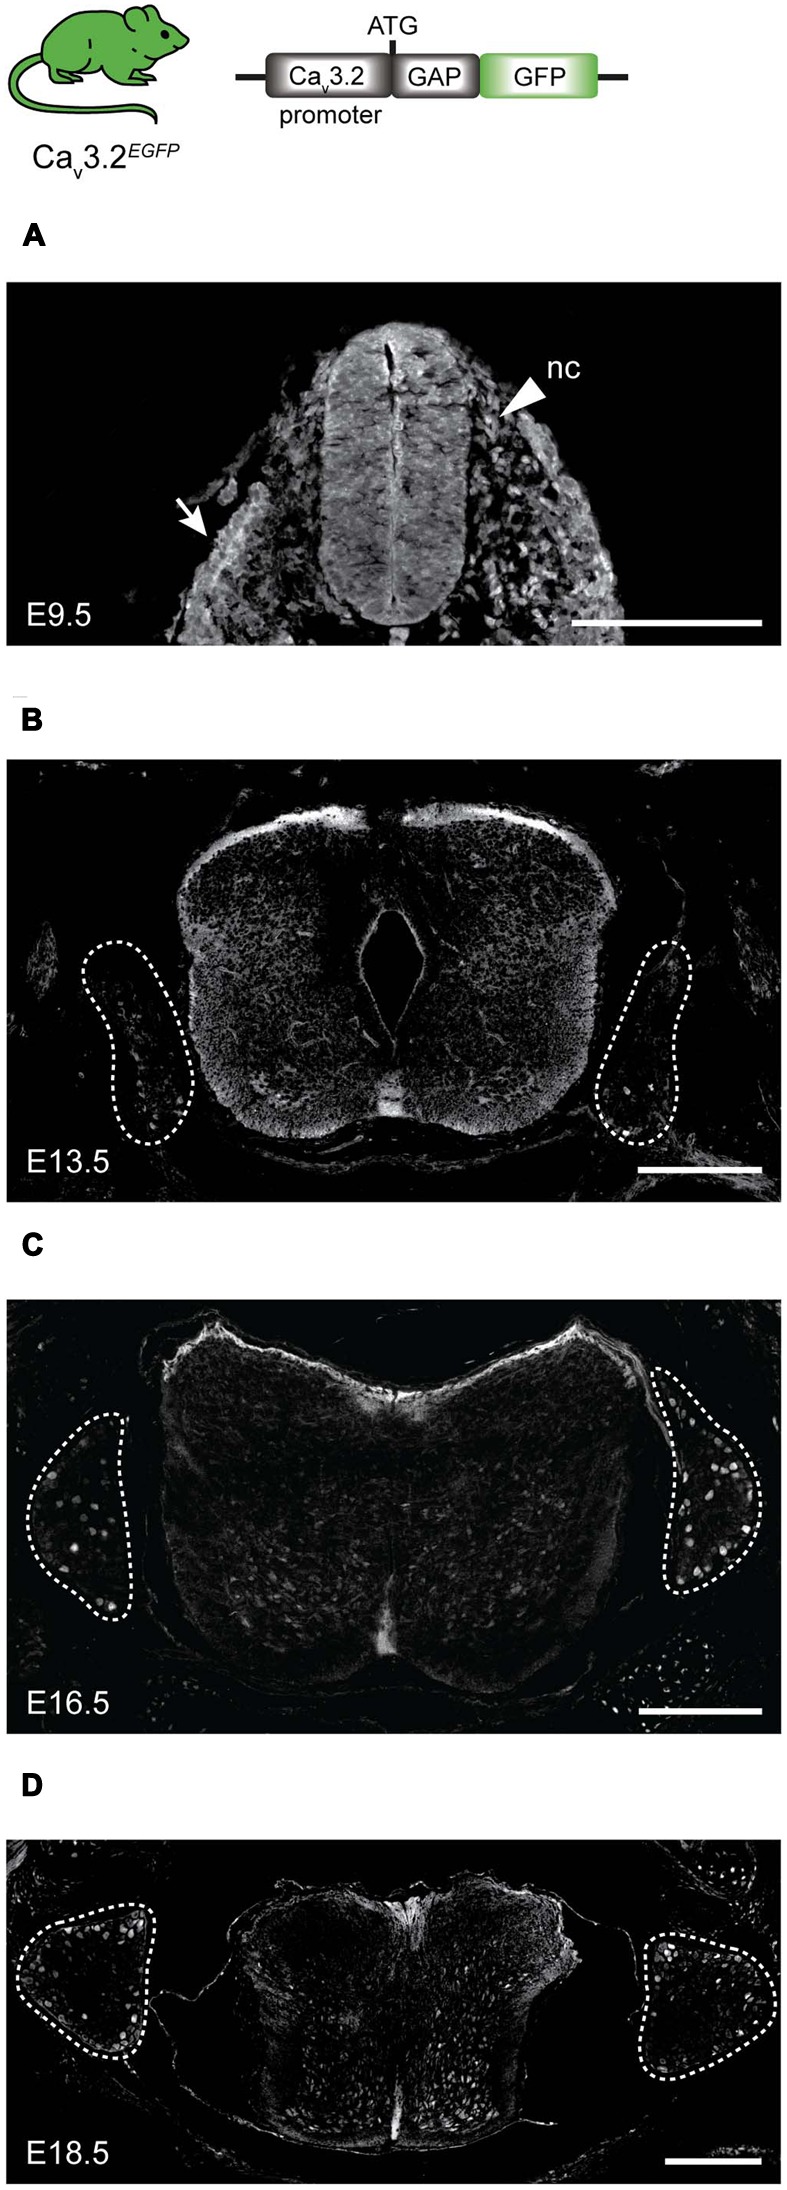
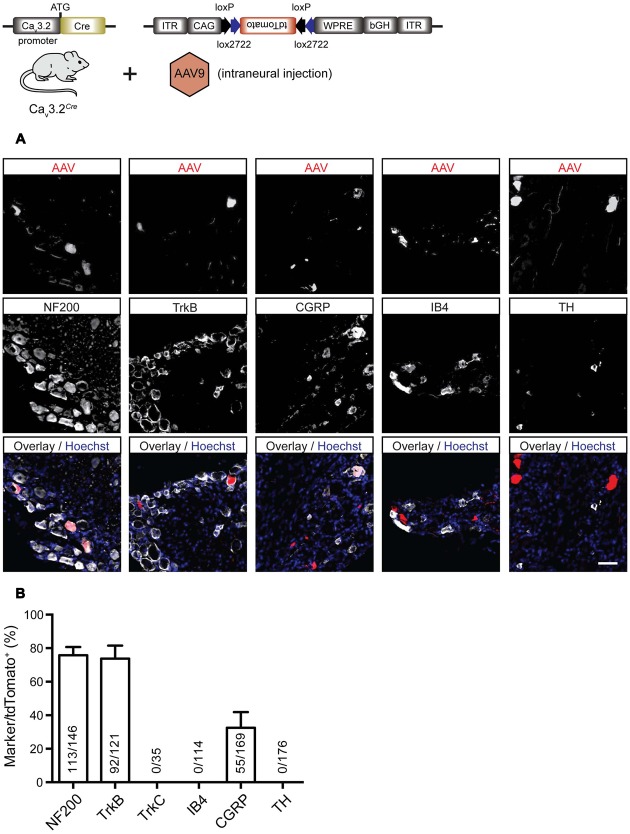
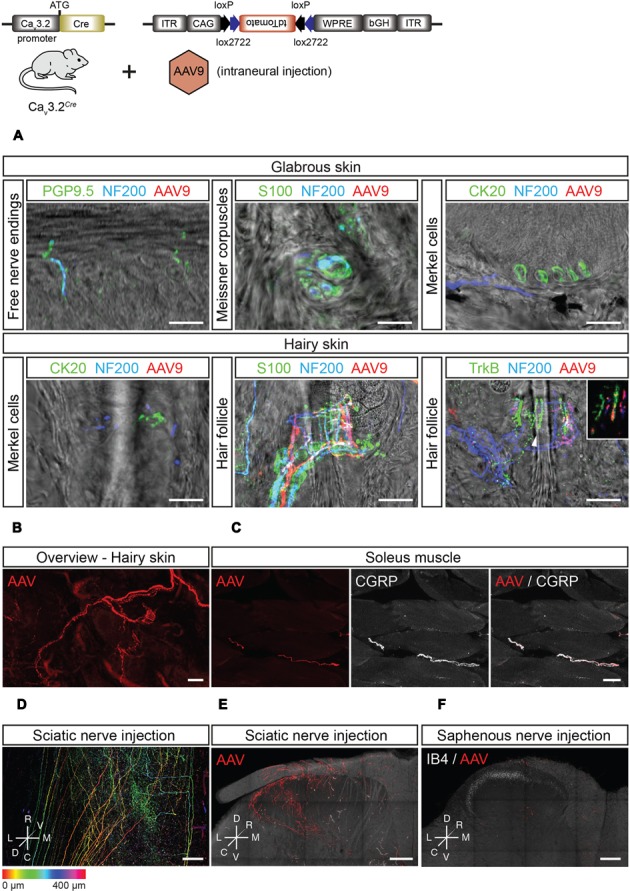
Characterizing the distinct functions of the T-type ion channel subunits Cav3.1, 3.2 or 3.3 has proven difficult due to their highly conserved amino-acid sequences and the lack of pharmacological blockers specific for each subunit. To precisely determine the expression pattern of the Cav3.2 channel in the nervous system we generated two knock-in mouse strains that express EGFP or Cre recombinase under the control of the Cav3.2 gene promoter. We show that in the brains of these animals, the Cav3.2 channel is predominantly expressed in the dentate gyrus of the hippocampus. In the peripheral nervous system, the activation of the promoter starts at E9.5 in neural crest cells that will give rise to dorsal root ganglia (DRG) neurons, but not sympathetic neurons. As development progresses the number of DRG cells expressing the Cav3.2 channel reaches around 7% of the DRG at E16.5, and remains constant until E18.5. Characterization of sensory neuron subpopulations at E18.5 showed that EGFP+ cells are a heterogeneous population consisting mainly of TrkB+ and TrkC+ cells, while only a small percentage of DRG cells were TrkA+. Genetic tracing of the sensory nerve end-organ innervation of the skin showed that the activity of the Cav3.2 channel promoter in sensory progenitors marks many mechanoreceptor and nociceptor endings, but spares slowly adapting mechanoreceptors with endings associated with Merkel cells. Our genetic analysis reveals for the first time that progenitors that express the Cav3.2 T-type calcium channel, defines a sensory specific lineage that populates a large proportion of the DRG. Using our Cav3.2-Cre mice together with AAV viruses containing a conditional fluorescent reporter (tdTomato) we could also show that Cre expression is largely restricted to two functionally distinct sensory neuron types in the adult ganglia. Cav3.2 positive neurons innervating the skin were found to only form lanceolate endings on hair follicles and are probably identical to D-hair receptors. A second population of nociceptive sensory neurons expressing the Cav3.2 gene was found to be positive for the calcitonin-gene related peptide but these neurons are deep tissue nociceptors that do not innervate the skin.

Keywords: Cav3.2; D-hair receptors; genetic tracing; hairy skin; muscle nociceptors; sensory neuron progenitors; slowly-adapting mechanoreceptors; spinal cord.


Figures

FIGURE 1
FIGURE 1
EGFP expression pattern in brain of Cav3.2EGFP knock-in mice. (A) EGFP immunostaining of brain coronal sections of Cav3.2GFP mouse. Positive staining is observed only in axons of the hippocampus (also see zoom in) and in the internal capsule. Scale bar: 1 mm; scale bar in the zoom in panel: 500 μm. (B) Quantification of GFP mRNA in different regions of the brain by qPCR. The amount of EGFP molecules per μg of total RNA used for reverse transcription was calculated using a standard curve constructed with consecutive dilutions of the pEGFP-N3 plasmid (Ct vs. log[EGFP]). The amount of EGFP molecules in the hippocampus was compared to those from other regions in the brain. ∗∗∗P ≤ 0.001, n = 3, Dunnet’s multiple comparison test. Data presented as mean + SD. (C) Lower panel shows representative Western blots of different brain regions with the GFP protein band at 27 kDa. Note that bands were imaged from the same Western blot but the lane order was changed for presentation purposes. Protein extract from HEK cells transfected with pEGFP-N3 was used as a positive control. The bar graph illustrates the densitometry quantification of EGFP in brain. Arbitrary units (AUs) from the hippocampus were compared to those from the other regions of the brain. P ≤ 0.05; ∗∗∗P ≤ 0.001, n = 3, Dunnet’s multiple comparison test. Data presented as mean ± SD.
FIGURE 2
FIGURE 2
Cre activation in the brain of Cav3.2Cre; Rosa26LacZ mice. (A) Coronal section of Cav3.2Cre;Rosa26LacZ adult mouse brain stained using antibody against β-gal. Dashed lines indicate brain regions that are shown as a zoom in: hippocampus, cortex, and amygdala. In these regions, dense and intense βgal signal was observed. (B) Coronal sections of cerebellum and hindbrain. Notice that not every single Purkinje cell of the cerebellum was positive (zoom in). Positive staining for β-gal in some cells of the hindbrain are shown in a zoom in. Scale bars: 600 μm; scale bars in the zoom in panels: 300 μm. M, motor cortex; Rs, retrosplenial cortex; S1, primary somatosensory cortex; S2, secondary somatosensory cortex; LD, laterodorsal thalamic nucleus; PRh, perirhinal cortex.
FIGURE 3
FIGURE 3
Cre activation in Cav3.2Cre; TaumGFP mice in development. β-gal expression in the nervous system of Cav3.2Cre;TaumGFP mice as shown by the blue staining. Embryos at stages (A) E11.5, (B) E12.5, and (C) E18.5 of development. Note the stronger β-gal staining in the spinal cord and DRGs in early stages compared to the brain. The staining observed in bones in the E18.5 embryos was also observed in negative controls. Zoom in panels: lateral and dorsal views of the spinal cord. DRG, dorsal root ganglia indicated with arrows; SG, sympathetic ganglia indicated with arrowheads.
FIGURE 4
FIGURE 4
Sensory end organs in the skin and their innervation by sensory afferents in Cav3.2Cre;TaumGFP mice. (A) Co-immunostaining of GFP and S100 for visualization of Meissner’s corpuscles in sections of the hind paw glabrous skin. Dashed lines indicate the epidermis and dermis. Arrow heads indicate the location of the Meissner corpuscles. A magnification of one of the Meissner corpuscles is shown in the bottom left corner. Scale bar: 100 μm. (B) Co-immunostaining of GFP and S100 in hairy skin slices of the paw for visualization of lanceolate endings and pilo-Ruffini endings. Arrow heads indicate the structure of the nerve innervating the hair follicle. Scale bars: 20 μm. (C,D) Co-immunostaining of GFP and CK20 to visualize Merkel cells in hairy skin and in the glabrous skin slices. (C) Horizontal section of hairy skin. The dashed circle indicates the outline of a hair. Scale bar: 20 μm. (D) Perpendicular section of the glabrous skin of the paw. The dashed line indicates the border between epidermis and dermis. Scale bar: 20 μm. (E) Examples of GFP+ free nerve endings in the glabrous skin double-stained for the pan-neuronal marker PGP9.5. Scale bar: 20 μm. Cartoon: sensory end organs located in the skin innervated by primary afferent fiber endings. The response properties of nociceptors (red), rapidly adapting mechanoreceptors (green), and slowly adapting mechanoreceptors (green) to mechanical stimulation are illustrated.
FIGURE 5
FIGURE 5
EGFP expression during development in spinal cord and DRG of Cav3.2EGFP knock-in mice. (A) At E9.5, EGFP is expressed in some cells of the neuronal crest (nc) indicated by an arrow head, in the epithelium indicated by an arrow, and in the spinal cord. (B) At E13.5, a few cells of the DRG are EGFP+, while the staining at the dorsal side of the spinal cord is stronger. (C) At E16.5 the number of EGFP+ cells increases in the DRG, but staining in the spinal cord is reduced. (D) Finally at E18.5, EGFP expression in the DRG appears constant while the positive staining has almost disappeared in the spinal cord. Dashed lines outline the DRGs. Scale bars: 200 μm.
FIGURE 6
FIGURE 6
Immunostainings for characterization of tdTomato positive cells in the DRG of virally transduced Cav3.2Cre mice. (A) Immunostainings of tdTomato+ cells with markers for sensory neuron subtypes, i.e., NF200, TrkB, TrkC, CGRP, IB4, and TH. Scale bar: 50 μm. (B) Quantification of double labeled cells. The ordinate represents tdTomato+ cells co-expressing one of the molecular markers used divided by the total number of tdTomato+ cells in the DRG. Data presented as mean + SD. N = 3 animals, at least three DRGs per animal were examined.
FIGURE 7
FIGURE 7
Peripheral and central innervation of tdTomato positive cells of virally transduced Cav3.2Cre mice. (A) Sensory end organs in the skin and their innervation by sensory afferents in virally transduced Cav3.2Cre mice after intrasciatic AAV injection. Sensory fibers were labeled using NF200 and/or PGP9.5. In the glabrous skin, Meissner corpuscles were visualized using an antibody against S100, and Merkel cells were stained using an antibody against CK20. In the hairy skin, Merkel cells were also immunostained using an antibody against CK20. Hair follicles were visualized by immunostaining of terminal Schwann cells using an antibody against S100. Hair follicle afferents were immunostained with antibodies against NF200 and TrkB. Scale bars: 20 μm. (B) Whole-mount imaging of hairy skin with tdTomato+ fibers innervating hair follicles. Scale bar: 25 μm. (C) In the soleus muscle, tdTomato+ sensory afferents were observed and identified as nociceptors by immunostaining using an antibody against CGRP. Scale bar: 20 μm. (D–F) Central termination of virally transduced Cav3.2Cre positive fibers after intrasciatic AAV injection. (D) Dorsoventral projection (with depth color coding) of a tiled image stack of the lumbar spinal cord of a Cav3.2Cre mouse showing TdTomato+ central terminals of Cav3.2Cre expressing sensory neurons, Scale bar: 100 μm. (E) Maximum intensity projections of a thick transverse slice of the lumbar spinal cord after intra-sciatic nerve AAV injection. Scale bar: 100 μm. (F) Maximum intensity projection of a thick transverse slice of the lumbar spinal cord after intra-saphenous nerve AAV injection. Scale bar: 100 μm.

Similar articles

Cited by

References

    1. Aptel H., Hilaire C., Pieraut S., Boukhaddaoui H., Mallié S., Valmier J., et al. (2007). The Cav3.2/α1H T-type Ca2+ current is a molecular determinant of excitatory effects of GABA in adult sensory neurons. Mol. Cell. Neurosci. 36 293–303. 10.1016/j.mcn.2007.07.009 - DOI - PubMed
    1. Averill S., McMahon S. B., Clary D. O., Reichardt L. F., Priestley J. V. (1995). Immunocytochemical localization of trkA receptors in chemically identified subgroups of adult rat sensory neurons. Eur. J. Neurosci. 7 1484–1494. 10.1111/j.1460-9568.1995.tb01143.x - DOI - PMC - PubMed
    1. Bachy I., Franck M. C. M., Li L., Abdo H., Pattyn A., Ernfors P. (2011). The transcription factor Cux2 marks development of an A-delta sublineage of TrkA sensory neurons. Dev. Biol. 360 77–86. 10.1016/j.ydbio.2011.09.007 - DOI - PubMed
    1. Bourane S., Garces A., Venteo S., Pattyn A., Hubert T., Fichard A., et al. (2009). Low-threshold mechanoreceptor subtypes selectively express MafA and are specified by Ret signaling. Neuron 64 857–870. 10.1016/j.neuron.2009.12.004 - DOI - PubMed
    1. Bourinet E., Alloui A., Monteil A., Barrère C., Couette B., Poirot O., et al. (2005). Silencing of the Cav3.2 T-type calcium channel gene in sensory neurons demonstrates its major role in nociception. EMBO J. 24 315–324. 10.1038/sj.emboj.7600515 - DOI - PMC - PubMed

LinkOut - more resources