. 2017 Mar 15:8:154.
doi: 10.3389/fphys.2017.00154. eCollection 2017.

Differences in Oral Structure and Tissue Interactions during Mouse vs. Human Palatogenesis: Implications for the Translation of Findings from Mice

Affiliations

Differences in Oral Structure and Tissue Interactions during Mouse vs. Human Palatogenesis: Implications for the Translation of Findings from Mice

Kai Yu et al. Front Physiol. .

Abstract

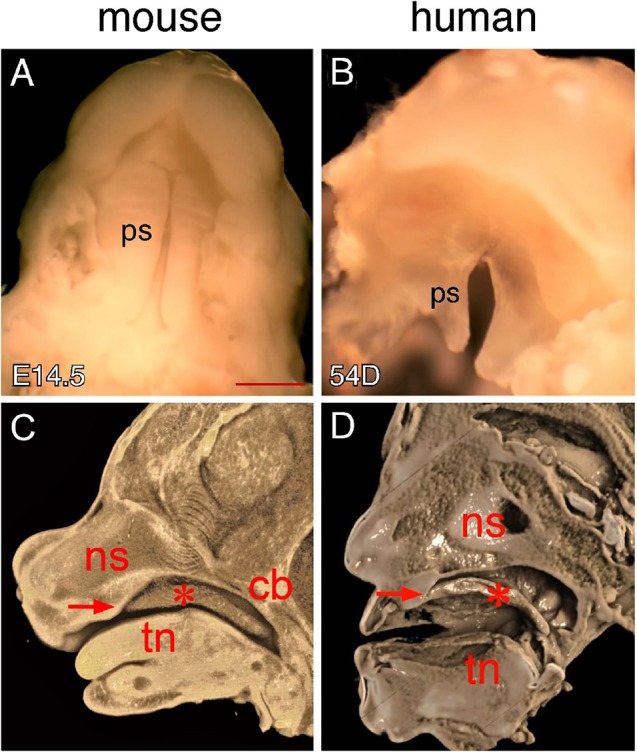
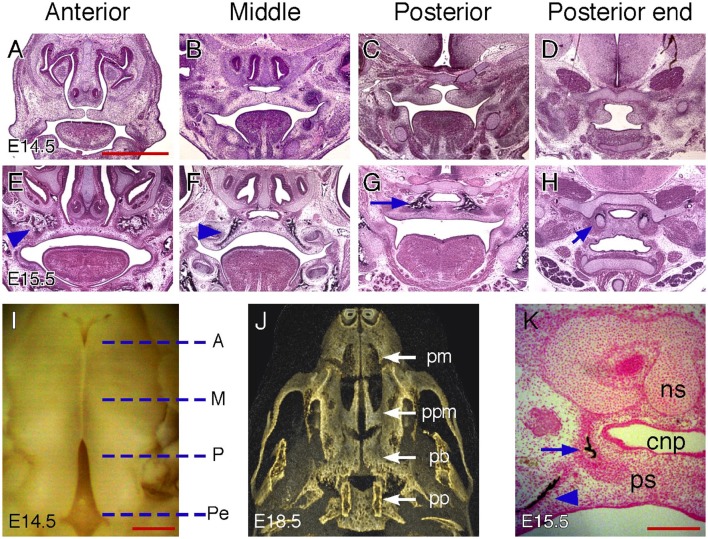
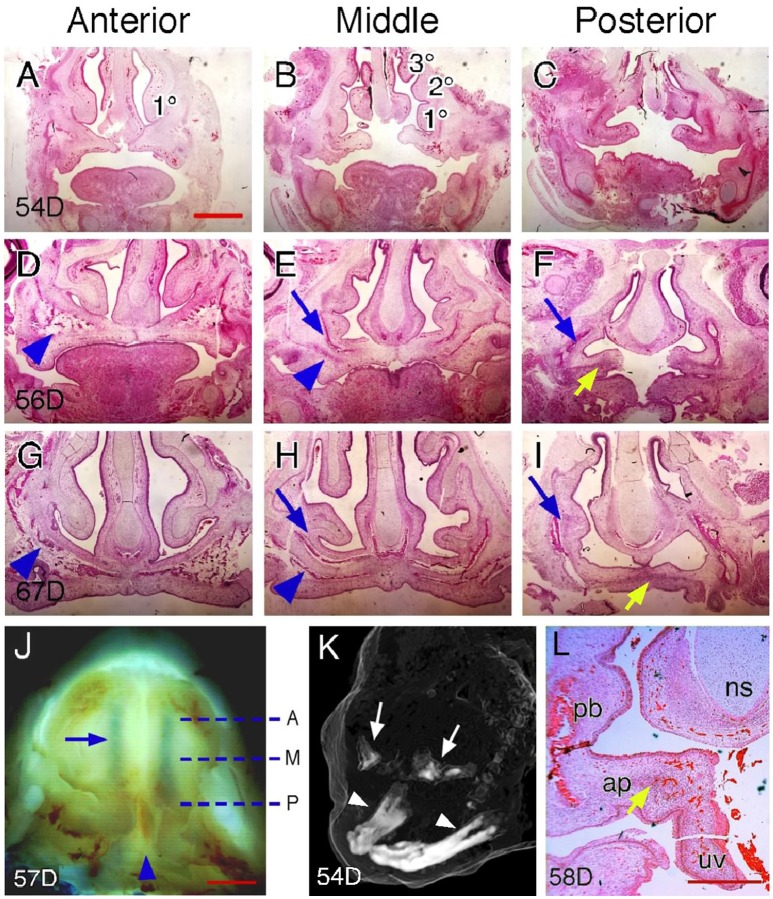
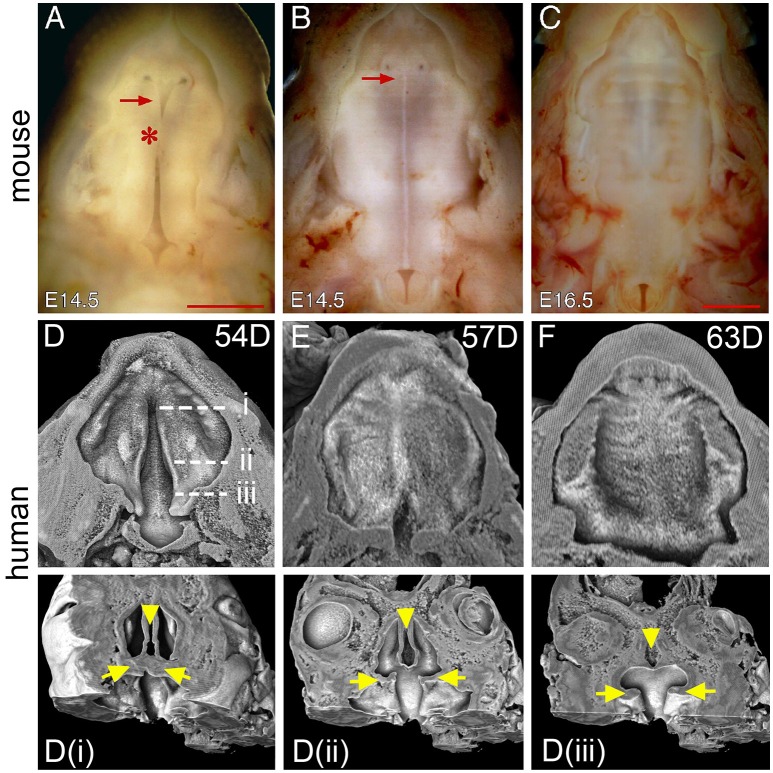
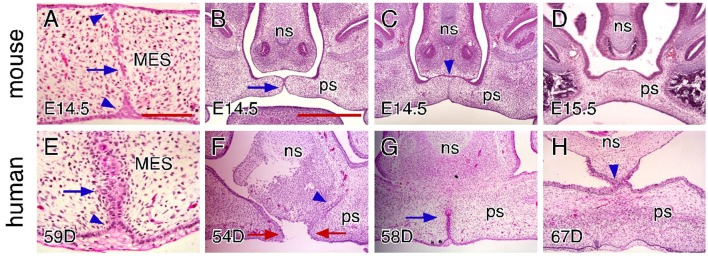
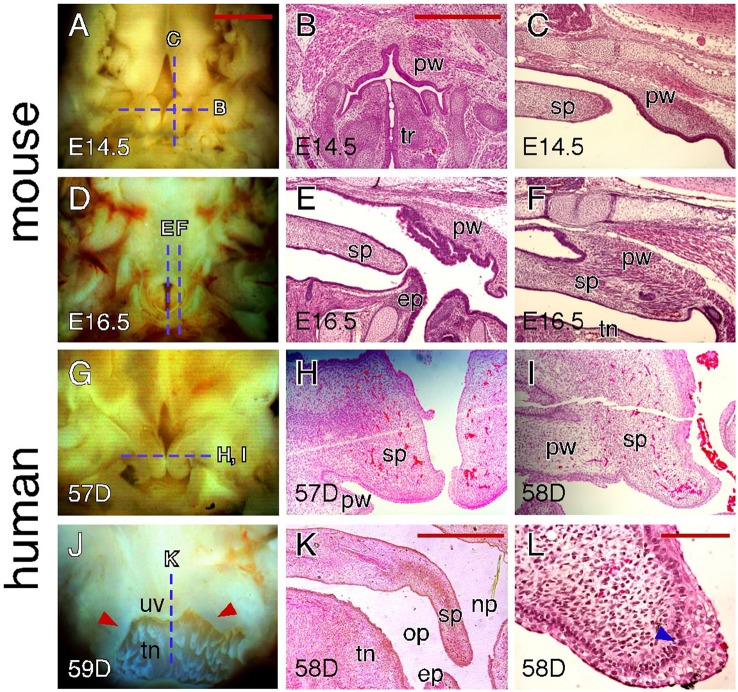
Clefting of the secondary palate is one of the most common human birth defects and results from failure of the palatal shelves to fuse during embryonic development. Palatogenesis is traditionally considered to be a highly conserved developmental process among mammalian species. However, cleft palate phenotypes in humans are considerably more variable than those seen in mice, the most common animal model for studying palatal development and pathogenesis of cleft palate. In this investigation, we utilized macroscopic observations, histology and 3D imaging techniques to directly compare palate morphology and the oral-nasal cavity during palate closure in mouse embryos and human conceptuses. We showed that mouse and human palates display distinct morphologies attributable to the structural differences of the oral-nasal cavity. We further showed that the palatal shelves interact differently with the primary palate and nasal septum in the hard palate region and with pharyngeal walls in the soft palate region during palate closure in mice and humans. Knowledge of these morphological differences is important for improved translation of findings in mouse models of human cleft lip/palate and, as such, should ultimately enhance our understanding of human palatal morphogenesis and the pathogenesis of cleft lip/palate in humans.

Keywords: cleft palate; hard palate; human development; mouse models; nasal septum; palatogenesis; soft palate; uvula.


Figures

Figure 1
Figure 1
Comparison of mouse and human secondary palates. (A) Inferior view of newly elevated palatal shelves of an E14.5 mouse embryo. (B) Inferior view of newly elevated palatal shelves of a 54-day human embryo. (C) Virtual mid-sagittal cut through a 3D-rendered Optical Projection Tomography (OPT) scan of an E14.5 mouse embryonic head. (D) Virtual mid-sagittal cut through a 3D rendered microCT scan of a PTAH-stained 54-day human embryonic head. Asterisks in (C,D) indicate elevated palatal shelves. Arrows in (C,D) indicate the junction between the primary and secondary palate. cb, cranial base; ns, nasal septum; ps palatal shelf; tn, tongue. Scale bar in (A) for (A,B), 1 mm.
Figure 2
Figure 2
Palatal regions along the AP axis in mice. (A–D) H&E-stained coronal sections of an E14.5 mouse embryonic head showing anterior, middle, posterior, and posterior end regions. (E–H) H&E stained coronal sections of an E15.5 mouse embryonic head showing anterior, middle, posterior and posterior end regions. Arrowheads in (E,F) indicate maxillary ossification. Arrow in (G) indicates palatine bone ossification. Arrow in (H) indicate cartilages in the pterygoid process. (I) Inferior view of partially fused palatal shelves of an E14.5 mouse embryo. Dotted lines indicate the equivalent position of coronal sections shown in (A–H). A, anterior; M, middle; P, posterior; Pe, posterior end. (J) Inferior view of a 3D rendered microCT scan of an E18.5 mouse embryonic head showing skeletal patterns in the palate. pm, premaxilla; ppm, palatine process of the maxilla; pb, palatine bone; pp, pterygoid process. (K) Von Kossa-stained coronal section of an E15.5 mouse embryonic head showing both maxillary (arrowhead) and palatine bone (arrow) ossification in the middle region. cnp, common nasal passage; ns, nasal septum; ps, palatal shelf. Scale bars in (A) for (A–H), 1 mm; in (I), 500 μm; in (K), 200 μm.
Figure 3
Figure 3
Palatal regions along the AP axis in humans. (A–C) H&E-stained coronal sections of a 54-day, (D–F) a 56-day, and (G–I) a 67-day human fetal head showing anterior, middle and posterior regions. Arrowheads in (D,E,G,H) indicate maxillary ossification. Blue arrows in (E,F,H,I) indicate palatine bone ossification. Yellow arrows in (F,I) indicate aponeurosis. 1°, inferior nasal concha; 2°, middle nasal concha; 3°, superior nasal concha. (J) Inferior view of partially fused palatal shelves of a 57-day human conceptus. Dotted lines indicate the equivalent position of coronal sections shown in (A–I). A, anterior; M, middle; P, posterior. Arrowhead indicates the posterior end region. Arrow indicates the inferior nasal meatus. (K) Oblique view of a 3D-rendered microCT scan of a 54-day human embryonic head showing initial stages of ossification of the maxillae (arrows) compared to the advanced ossification of the mandible (arrowheads). Note: the soft tissue surface of the head is rendered as a “ghost” image for context. (L) H&E-stained coronal section of a 58-day human fetal head showing the posterior end region. Arrow indicates aponeurosis. ap, aponeurosis; ns, nasal septum; pb, palatine bone; uv, uvula. Scale bars in (A) for (A–I), 1 mm; in (J), 1 mm; in (L), 500 μm.
Figure 4
Figure 4
Comparison of palate closure in mice and humans. (A) Inferior view of the palatal shelves of an E14.5 mouse embryo showing initial contact at the middle region (asterisk). (B) Inferior view of a second E14.5 mouse embryo showing the formation of the MES after contact. Note that the MES appears as a white line in the middle. Arrows in (A,B) indicate a gap between the primary and secondary palate. (C) Inferior view of a completely fused palate of an E16.5 mouse embryo. (D) 3D rendered image showing unfused palatal shelf of PTAH-stained facial tissue from a 54-day human conceptus (the same one as in Figure 1D). Dotted lines indicate virtual segmentation planes along the AP axis to generate the coronal sections shown in (Di–iii). Arrows indicate the palatal shelves and arrowheads indicate the nasal septum. (E) 3D rendered image showing partially fused palatal shelves of a PTAH-stained 57-day human conceptus. (F) 3D rendered image showing a completely fused palate of a PTAH-stained 63-day human conceptus. Scale bar in (A) for (A,B), 1 mm; in (C), 1 mm.
Figure 5
Figure 5
Comparison of craniofacial tissue interactions during closure of the hard palate in mice and humans. (A) H&E-stained coronal section showing MES degeneration in an E14.5 mouse palate. Arrow indicates epithelial islands and arrowheads indicate the epithelial triangles. (B) H&E-stained coronal section showing the contact of the palatal shelves in the anterior region (arrow) in an E14.5 mouse palate. Note that the palatal shelves are not in contact with the nasal septum. (C) H&E-stained coronal section showing epithelial seam formation between the palate and nasal septum in the anterior region (arrowhead) in an E14.5 mouse palate. Note the degenerated MES at the same region. (D) H&E-stained coronal section showing that the palate does not contact or fuse with the nasal septum in the posterior portions of the anterior region in an E15.5 mouse palate. (E) H&E-stained coronal section showing MES degeneration in a 59-day human palate. Arrow indicates epithelial rosettes and arrowhead indicates the alignment of the basal cells in the epithelial triangle. (F) H&E-stained coronal section showing epithelial seam formation between the palate and nasal septum in the anterior region (arrowhead) in a 54-day human palate. Note the gap between the opposing MEEs (red arrows). (G) H&E-stained coronal section showing partially (and dorsally) degenerated MES in the anterior region (arrow) in a 58-day human palate. Note that the palate completely fuses with the nasal septum. (H) H&E-stained coronal section showing that the palate is also in contact and fuses with the nasal septum in the posterior region in a 67-day human palate. Note the completely fused palate in the same region. ns, nasal septum; ps, palatal shelf. Scale bars in (A) for (A,E), 100 μm; in (B) for (B–D), and (F–H), 500 μm.
Figure 6
Figure 6
Comparison of craniofacial tissue interactions during closure of the soft palate in mice and humans. (A) Inferior view of the palatal shelves of an E14.5 mouse embryo showing the gap in the posterior end region. Dotted lines indicate the section planes represented in similarly aged (E14.5) embryos (shown in B,C). (B) H&E-stained coronal section showing outgrowths of the pharyngeal wall in an E14.5 mouse embryo. (C) H&E-stained para-sagittal section showing the posterior tip of the palatal shelves and pharyngeal outgrowth in an E14.5 mouse palate. (D) Inferior view of the palate of an E16.5 mouse embryo showing the opening between the pharyngeal walls. Dotted lines indicate the section planes represented in a similarly aged (E16.5) embryo (shown in E,F). (E) H&E-stained mid-sagittal section showing the interactions between the posterior tip of the palate and epiglottis in an E16.5 mouse palate. (F) H&E-stained para-sagittal section showing the fusion between the posterior tip of the palate and pharyngeal wall in an E16.5 mouse palate. (G) Inferior view of the palatal shelves of a 57-day human conceptus showing the gap at the posterior end region. Dotted line indicates the section plane represented in similarly aged (57 and 58-day) conceptuses (shown in H,I). (H) H&E-stained coronal section showing the unfused palatal shelves in the posterior end region of a 57-day human palate. (I) H&E-stained coronal section showing the mediolateral fusion of the palatal shelf and pharyngeal wall in the posterior end region of a 58-day human palate. (J) Posterior view of the fused palate of a 59-day human conceptus showing the uvula. Dotted line indicates the section plane represented in a similarly aged (58-day) conceptus (shown in K). Arrowheads indicate the palatopharyngeal arch. (K) H&E-stained mid-sagittal section showing that the posterior tip of a 58-day human palate is not in contact with the epiglottis. (L) H&E-stained coronal section showing the MEE at the posterior tip of a 58-day human palate. Arrowhead indicates the less-organized, multi-layered cuboidal epithelial cells. ep, epiglottis; op, oral pharynx; np, nasal pharynx; pw, pharyngeal wall; sp, soft palate; tn, tongue; tr, trachea; uv, uvula. Scale bars in (A) for (A,D,G,J), 1 mm; in (B) for (B,C,E,F,H,I), 500 μm; in (K), 1 mm; in (L), 100 μm.

Similar articles

Cited by

References

    1. Beaty T. H., Ruczinski I., Murray J. C., Marazita M. L., Munger R. G., Hetmanski J. B., et al. . (2011). Evidence for gene-environment interaction in a genome wide study of nonsyndromic cleft palate. Genet. Epidemiol. 35, 469–478. 10.1002/gepi.20595 - DOI - PMC - PubMed
    1. Brinkley L. L., Vickerman M. M. (1979). Elevation of lesioned palatal shelves in vitro. J. Embryol. Exp. Morphol. 54, 229–240. - PubMed
    1. Brinkley L. L., Vickerman M. M. (1982). The effects of chlorcyclizine-induced alterations of glycosaminoglycans on mouse palatal shelf elevation in vivo and in vitro. J. Embryol. Exp. Morphol. 69, 193–213. - PubMed
    1. Bulleit R. F., Zimmerman E. F. (1985). The influence of the epithelium on palate shelf reorientation. J. Embryol. Exp. Morphol. 88, 265–279. - PubMed
    1. Burdi A. R., Faist K. (1967). Morphogenesis of the palate in normal human embryos with special emphasis on the mechanisms involved. Am. J. Anat. 120, 149–159. 10.1002/aja.1001200112 - DOI

LinkOut - more resources