. 2017 Mar 15:8:264.
doi: 10.3389/fimmu.2017.00264. eCollection 2017.

Fasciola hepatica Immune Regulates CD11c+ Cells by Interacting with the Macrophage Gal/GalNAc Lectin

Affiliations

Fasciola hepatica Immune Regulates CD11c+ Cells by Interacting with the Macrophage Gal/GalNAc Lectin

Ernesto Rodríguez et al. Front Immunol. .

Abstract

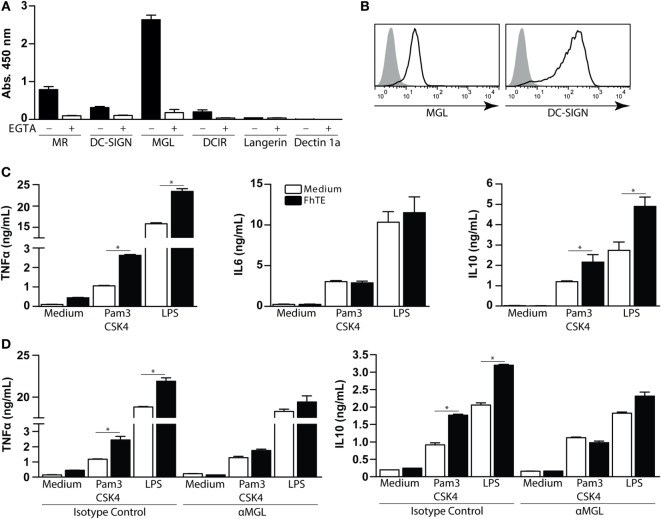
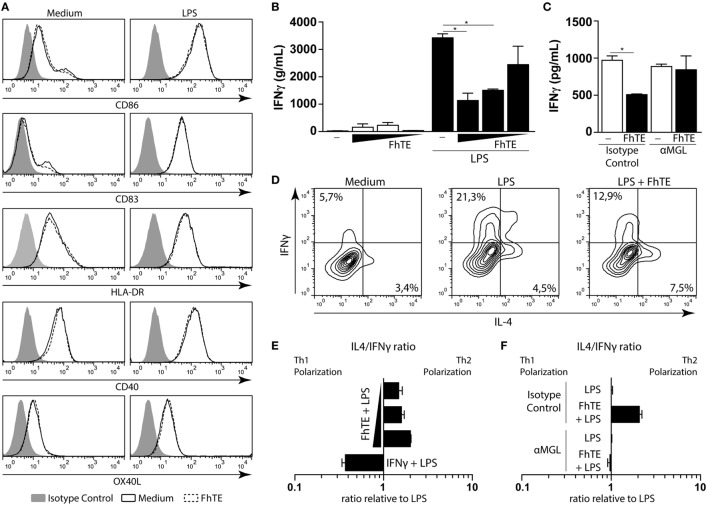
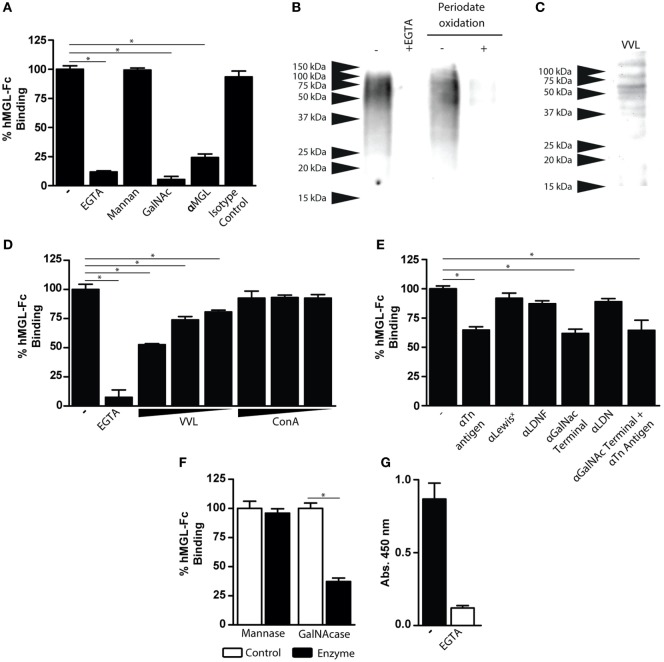
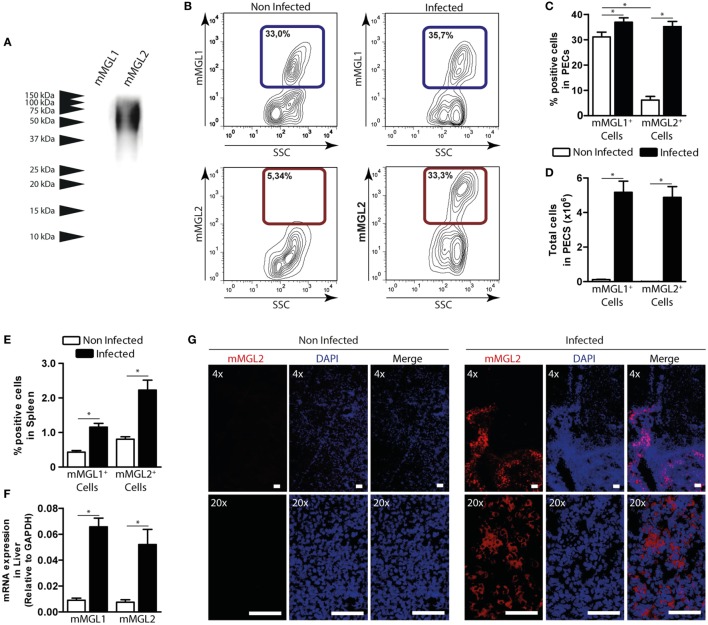
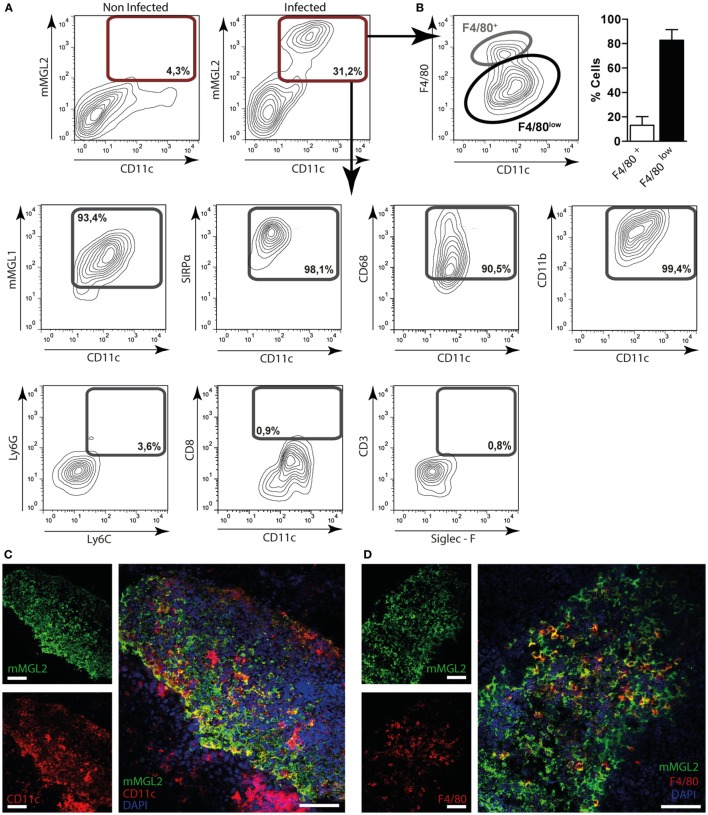
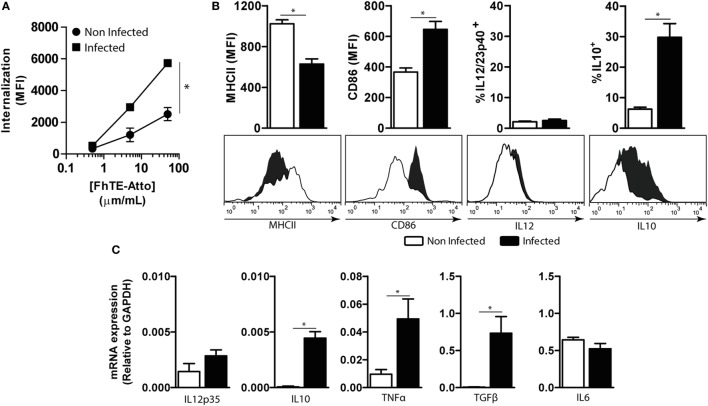
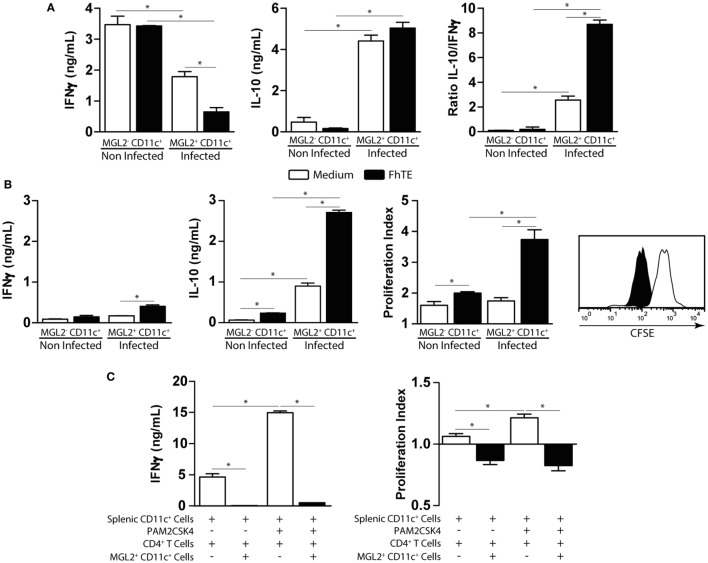
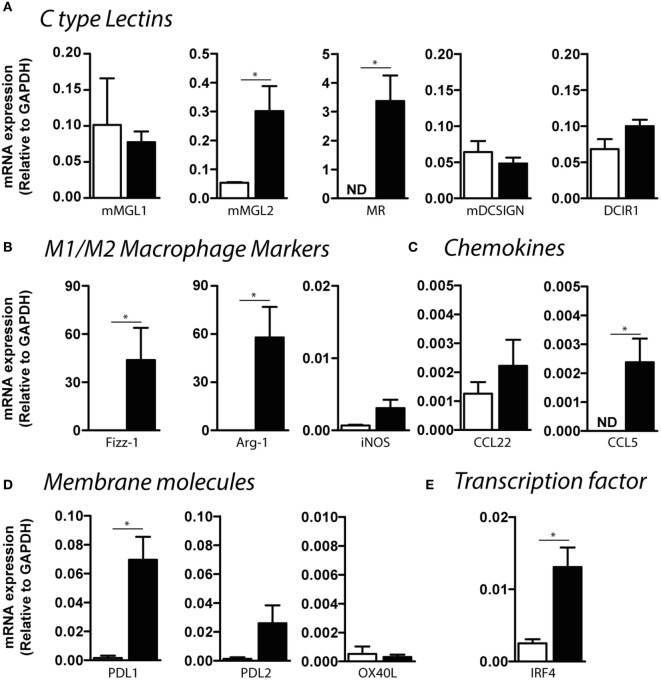
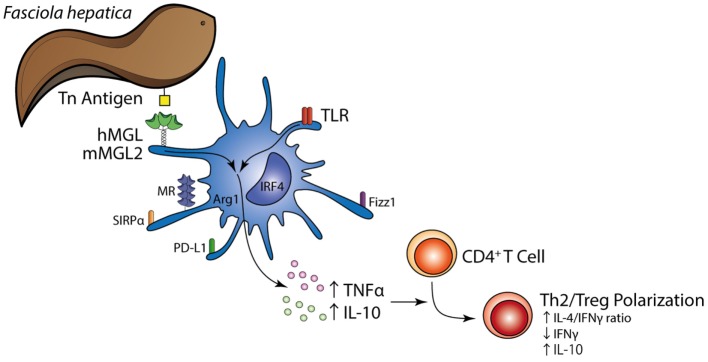
Fasciolosis, caused by Fasciola hepatica and Fasciola gigantica, is a trematode zoonosis of interest in public health and livestock production. Like other helminths, F. hepatica modulates the host immune response by inducing potent polarized Th2 and regulatory T cell immune responses and by downregulating the production of Th1 cytokines. In this work, we show that F. hepatica glycans increase Th2 immune responses by immunomodulating TLR-induced maturation and function of dendritic cells (DCs). This process was mediated by the macrophage Gal/GalNAc lectin (MGL) expressed on DCs, which recognizes the Tn antigen (GalNAc-Ser/Thr) on parasite components. More interestingly, we identified MGL-expressing CD11c+ cells in infected animals and showed that these cells are recruited both to the peritoneum and the liver upon F. hepatica infection. These cells express the regulatory cytokines IL-10, TNFα and TGFβ and a variety of regulatory markers. Furthermore, MGL+ CD11c+ cells expand parasite-specific Th2/regulatory cells and suppress Th1 polarization. The results presented here suggest a potential role of MGL in the immunomodulation of DCs induced by F. hepatica and contribute to a better understanding of the molecular and immunoregulatory mechanisms induced by this parasite.

Keywords: C-type lectin receptors; dendritic cell; glycans; helminth; immune regulation; macrophage Gal/GalNAc lectin.


Figures

Figure 1
Figure 1
Macrophage Gal/GalNAc lectin recognizes F. hepatica glycoconjugates and potentiates the production of IL-10 and TNF-α by Pam3CSK4-stimulated monocyte-derived DCs (mo-DCs). (A) Binding of different hCLR-Fc on FhTE-coated plates in presence (white bars) or absence (black bars) of EGTA. (B) Expression of hMGL and DC-SIGN (as differentiation marker) on mo-DCs was confirmed by flow cytometry. (C) IL-6, IL-10 and TNFα levels on supernatants from Pam3CSK4 and LPS-stimulated mo-DC cultures incubated with and without FhTE. (D) moDCs were stimulated as in (B), in the presence of an anti-hMGL antibody or isotype control. A representative result of one out of four donors is shown (±SEM, indicated by error bars). Asterisks indicate statistically significant differences (*p < 0.05).
Figure 2
Figure 2
FhTE induces Th2 polarization by reducing IFNγ and increasing IL-4 production. moDCs were incubated with coated FhTE in the presence or absence of LPS (10 μg/ml) for 48 h and the expression of costimulatory molecules was evaluated by flow cytometry (A). To evaluate the capacity of the stimulated moDCs to polarize naïve CD4 T cells, cells were washed and incubated with CD4+ CD45RA+ T cells (ratio 1:10) in the presence of Staphylococcal Enterotoxin B (10 pg/ml). After 5 days, supernatants were harvested for the evaluation of IFNγ (B,C), and replaced with 100 U of IL-2. After 5 days, Th1/Th2 polarization of T cells was evaluated by intracellular staining of IFNγ and IL-4 after stimulation with PMA and Ionomycin in the presence of Brefeldin A (D–F). When indicated (C,F), moDCs were preincubated with an anti-hMGL antibody or an isotype control, before stimulation. IL-4/IFNγ ratio was evaluated relative to the control, based in single positive cells. Concentration of FhTE used: 200, 100, and 50 μg/ml. A representative result of one out of four donors is shown (±SEM, indicated by error bars). Asterisks indicate statistically significant differences (*p < 0.05).
Figure 3
Figure 3
Characterization of FhTE glycoconjugates that are recognized by hMGL. (A) hMGL binding was evaluated on FhTE-coated plates with hMGL-Fc previously incubated with EGTA, mannan, GalNAc, anti-hMGL antibody, or isotype control. (B) Western Blot with hMGL-Fc on FhTE. Recognition of FhTE by hMGL was abrogated with EGTA and with periodate oxidation treatment of FhTE. (C) Lectin blot of FhTE using the GalNAc-specific lectin Vicia Villosa (VVL). (D) Inhibition of hMGL binding to plate-bound FhTE with the lectins VVL and ConA (1, 0.1, and 0.1 μg/ml). (E) Inhibition of hMGL binding to plate-bound FhTE with different carbohydrate-specific antibodies. (F) hMGL binding on FhTE-coated plates previously incubated with mannase or GalNAcase. (G) Binding of hMGL on membrane-associated parasite component-coated plates in presence (white bars) or absence (black bars) of EGTA. A representative figure of three or four independent experiments is shown (±SD, indicated by error bars). Asterisks indicate statistically significant differences (*p < 0.05).
Figure 4
Figure 4
mMGL2+ cells are recruited to the peritoneum during F. hepatica infection. (A) Recognition of mMGL1 and mMGL2 of FhTE by western blotting. (B) Evaluation by flow cytometry of mMGL1+ and mMGL2+ cells in the peritoneal cavity of infected and control mice. (C) Percentage of mMGL1+ or mMGL2+ cells in the peritoneum of infected and control mice. (D) Total cell numbers of mMGL1+ or mMGL2+ cells in the peritoneum of infected and control mice. (E) Percentage of mMGL1+ or mMGL2+ cells in the spleen of infected and control mice. (F) mRNA expression of mMGL1 and mMGL2 in the liver of infected and control animals. (G) MGL2 expression in livers of infected and control animals. A representative figure of three independent experiments is shown (±SD, indicated by error bars). Asterisks indicate statistically significant differences (*p < 0.05). The bar represents 100 μm.
Figure 5
Figure 5
Immunephenotyping of mMGL2+ cells in the peritoneum and in the liver of F. hepatica-infected animals. (A) Cells from the peritoneal cavity from infected or control mice were stained with CD11c-, mMGL1-, mMGL2-, CD11b-, CD8-, F4/80-, SIRPα-, CD68-, Ly6G-, Ly6C-, CD3-, and Siglec-F-specific antibodies and evaluated by flow cytometry. (B) Percentage of mMGL2+ CD11c+ F4/80+ or mMGL2+ CD11c+ F4/80low cells from PECs of infected animals. (C) Expression of MGL2+ and CD11c+ cells in the liver of infected mice. (D) Expression of MGL2+, CD11c+ and F4/80+ cells in the liver of infected mice. The bar represents 100 μm. A representative figure of three independent experiments is shown (±SD, indicated by error bars).
Figure 6
Figure 6
Characterization of CD11c+ mMGL2+ cells. CD11c+ cells were purified from the peritoneal cavity of infected mice at 3 wpi and naive mice. (A) Uptake was evaluated by flow cytometry on PECs previously incubated with different concentrations of Atto 647-labeled FhTE for 1 h at 37°C or 4°C as a control. Internalization is calculated as the difference between the MFI at 37°C and MFI at 4°C. (B) The expression of MHCII and CD86 and the production of IL-12/23p40 and IL-10 by CD11c+ purified cells were evaluated by flow cytometry. (C) Expression of IL-6, IL-12p35, IL-10, TNFα, and TGFβ was evaluated by qRT-PCR on RNA obtained from purified CD11c+ cells. A representative figure of three independent experiments is shown (±SD, indicated by error bars). Asterisks indicate statistically significant differences (*p < 0.05).
Figure 7
Figure 7
Functional analyses of CD11c+ mMGL2+ cells. (A) CD11c+ purified cells from the peritoneal cavity of infected or control mice were stimulated with FhTE-coated plates overnight at 37°C, washed and incubated with purified C57BL/6 CD4+ T cells from naive animals for 5 days at 37°C. IFNγ and IL-10 production by T cells was evaluated on culture supernatants by ELISA. (B) CD11c+ purified cells from the peritoneal cavity of infected or control mice were stimulated with FhTE overnight at 37°C, washed and incubated with purified BALB/c CD4+ T cells from 3-week-infected animals for 5 days at 37°C. IFNγ and IL-10 production by T cells was evaluated on culture supernatants by ELISA. Proliferation was evaluated on CFSE-stained CD4+ T cells by flow cytometry. The proliferation index was calculated as the ratio between the percentage of CFSElow CD4+ cells and CFSElow CD4+ cells with medium. (C) CD11c+ purified cells from the spleen of naïve BALB/c mice were stimulated with Pam2CSK4 in the presence or absence of FhTE overnight at 37°C, washed and incubated with purified C57BL/6 CD4+ T cells from naive animals for 5 days at 37°C in presence or absence of MGL2+ CD11c+ cells (100,000/well) from 3-week-infected animals. IFNγ production by T cells was evaluated on culture supernatants by ELISA. Proliferation was evaluated on CFSE-stained CD4+ T cells by flow cytometry. The proliferation index was calculated as the ratio between the percentage of CFSElow CD4+ cells and CFSElow CD4+ cells with medium. A representative figure of three independent experiments is shown (±SD, indicated by error bars). Asterisks indicate statistically significant differences (*p < 0.05).
Figure 8
Figure 8
Expression of C-type lectin receptors, chemokines, and regulatory molecules by CD11c+ mMGL2+ cells. Expression by qRT-PCR of CLRs (A), macrophage markers (B), chemokines (C), regulatory membrane molecules (D), and IRF-4 (E) was evaluated on purified peritoneal CD11c+ cells from infected (black bars) and control (white bars) mice. A representative figure of three independent experiments is shown (±SD, indicated by error bars). Asterisks indicate statistically significant differences (*p < 0.05).
Figure 9
Figure 9
Schematic illustration summarizing the main findings in the present study. The Tn antigen on F. hepatica interacts with MGL expressed on the DC surface, triggering a regulatory program together with TLR signaling that induces enhanced expression of TNFα and IL-10 by DCs and a Th2/regulatory T cell polarization.

References

    1. Ashrafi K, Bargues MD, O’Neill S, Mas-Coma S. Fascioliasis: a worldwide parasitic disease of importance in travel medicine. Travel Med Infect Dis (2014) 12(6 Pt A):636–49.10.1016/j.tmaid.2014.09.006 - DOI - PubMed
    1. Dowling DJ, Hamilton CM, Donnelly S, La Course J, Brophy PM, Dalton J, et al. Major secretory antigens of the helminth Fasciola hepatica activate a suppressive dendritic cell phenotype that attenuates Th17 cells but fails to activate Th2 immune responses. Infect Immun (2010) 78(2):793–801.10.1128/IAI.00573-09 - DOI - PMC - PubMed
    1. Walsh KP, Brady MT, Finlay CM, Boon L, Mills KH. Infection with a helminth parasite attenuates autoimmunity through TGF-beta-mediated suppression of Th17 and Th1 responses. J Immunol (2009) 183(3):1577–86.10.4049/jimmunol.0803803 - DOI - PubMed
    1. O’Neill SM, Brady MT, Callanan JJ, Mulcahy G, Joyce P, Mills KH, et al. Fasciola hepatica infection downregulates Th1 responses in mice. Parasite Immunol (2000) 22(3):147–55.10.1046/j.1365-3024.2000.00290.x - DOI - PubMed
    1. Flynn RJ, Mulcahy G. The roles of IL-10 and TGF-beta in controlling IL-4 and IFN-gamma production during experimental Fasciola hepatica infection. Int J Parasitol (2008) 38(14):1673–80.10.1016/j.ijpara.2008.05.008 - DOI - PubMed