. 2017 Mar 14;18(Suppl 3):80.
doi: 10.1186/s12859-017-1469-3.

AfterQC: automatic filtering, trimming, error removing and quality control for fastq data

Affiliations

AfterQC: automatic filtering, trimming, error removing and quality control for fastq data

Shifu Chen et al. BMC Bioinformatics. .

Abstract

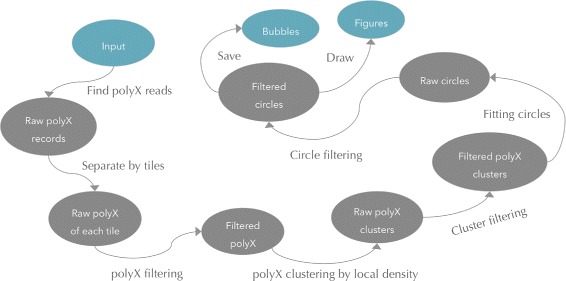
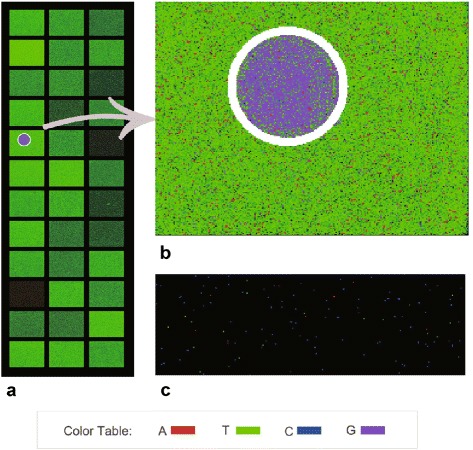
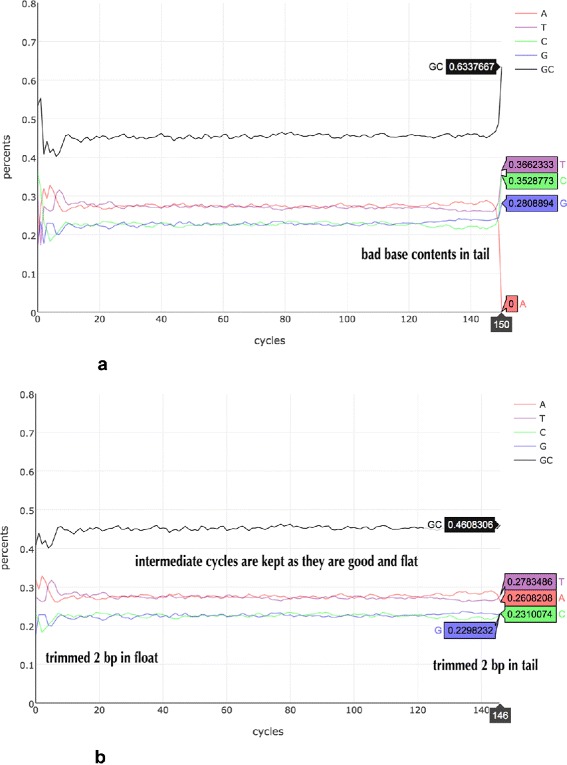
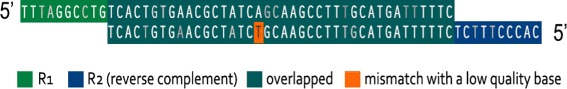
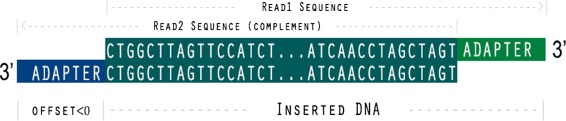
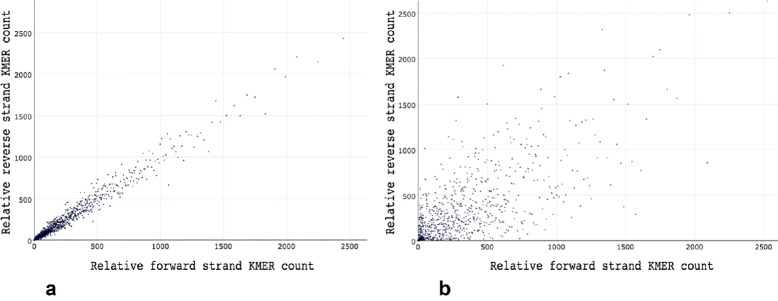
Background: Some applications, especially those clinical applications requiring high accuracy of sequencing data, usually have to face the troubles caused by unavoidable sequencing errors. Several tools have been proposed to profile the sequencing quality, but few of them can quantify or correct the sequencing errors. This unmet requirement motivated us to develop AfterQC, a tool with functions to profile sequencing errors and correct most of them, plus highly automated quality control and data filtering features. Different from most tools, AfterQC analyses the overlapping of paired sequences for pair-end sequencing data. Based on overlapping analysis, AfterQC can detect and cut adapters, and furthermore it gives a novel function to correct wrong bases in the overlapping regions. Another new feature is to detect and visualise sequencing bubbles, which can be commonly found on the flowcell lanes and may raise sequencing errors. Besides normal per cycle quality and base content plotting, AfterQC also provides features like polyX (a long sub-sequence of a same base X) filtering, automatic trimming and K-MER based strand bias profiling.

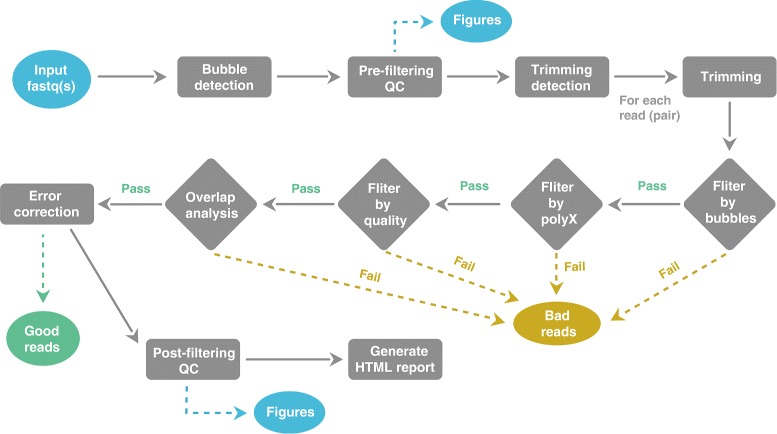
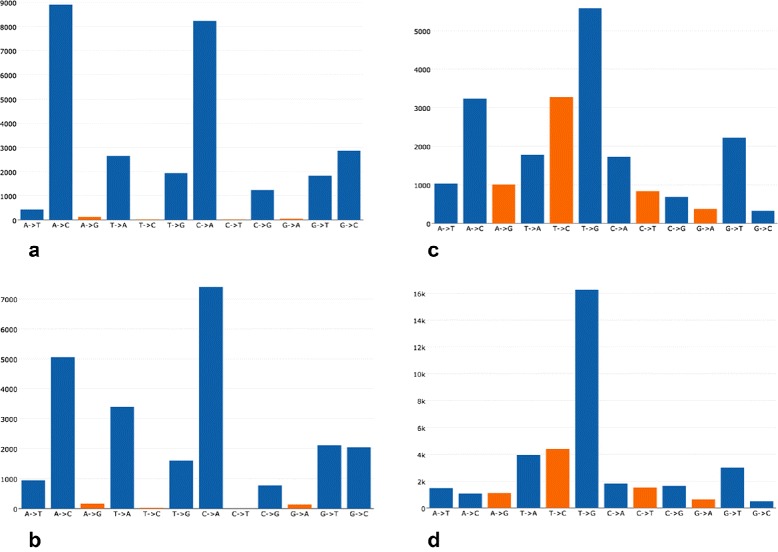
Results: For each single or pair of FastQ files, AfterQC filters out bad reads, detects and eliminates sequencer's bubble effects, trims reads at front and tail, detects the sequencing errors and corrects part of them, and finally outputs clean data and generates HTML reports with interactive figures. AfterQC can run in batch mode with multiprocess support, it can run with a single FastQ file, a single pair of FastQ files (for pair-end sequencing), or a folder for all included FastQ files to be processed automatically. Based on overlapping analysis, AfterQC can estimate the sequencing error rate and profile the error transform distribution. The results of our error profiling tests show that the error distribution is highly platform dependent.

Conclusion: Much more than just another new quality control (QC) tool, AfterQC is able to perform quality control, data filtering, error profiling and base correction automatically. Experimental results show that AfterQC can help to eliminate the sequencing errors for pair-end sequencing data to provide much cleaner outputs, and consequently help to reduce the false-positive variants, especially for the low-frequency somatic mutations. While providing rich configurable options, AfterQC can detect and set all the options automatically and require no argument in most cases.

Keywords: Bubble; Data filtering; NGS; Overlap analysis; Quality control.


Figures

Fig. 1
Fig. 1
Pipeline diagram of AfterQC. For each single or pair of FastQ file(s), AfterQC will perform pre-filtering QC, automatic trimming, data filtering, error correction and post-filtering QC. Reads will be categorized as good or bad reads and stored separately, figures will be included in the final HTML report
Fig. 2
Fig. 2
Algorithm diagram of deBubble. The major steps of this algorithm are polyX detection, polyX clustering and filtering, circle fitting and filtering
Fig. 3
Fig. 3
The output images of AfterQC deBubble. a is a sub-image of a lane of NextSeq 500 sequencer, from which we can find 1 bubble detected. b shows enlarged details of the bubble. c shows a sub-image of a tile of HiSeq 3000 with similar resolution of (b), which has much fewer polyX reads
Fig. 4
Fig. 4
An example of how automatic trimming works. Data is obtained from a cell-free DNA quality control sample, and sequenced by Illumina NextSeq 500 sequencer. a is the base content percentage curve before trimming and filtering, from which we can find base contents change dramatically in front and tail; b is the curve after trimming and filtering, from which we can find that the bad cycles in the tail are all trimmed, while only part of the front is trimmed. This results from the fact that we use different thresholds for the front and tail, since unflatness in front is more probably caused by different fragmentation methods, while unflatness in tail is usually caused by lab preparation or sequencing artefacts
Fig. 5
Fig. 5
An example of overlapping analysis: the original DNA template is 60 bp long and sequencing length is 2×50, R1 and R2 have 40 bp overlap at offset 10, and the edit distance of the overlapped sub-sequences is 1. Brighter colour represents higher quality. A mismatch pair is found with high quality A and very low quality T, then T can be corrected
Fig. 6
Fig. 6
a Illumina NextSeq 500 output run #1. b Illumina NextSeq 500 output run #2. c Illumina HiSeq X-tenoutput run #1. d Illumina HiSeq X-tenoutput run #2. Sequencing error transform distribution is platform associated. Data are obtained from internal quality control DNA samples, and sequenced by Illumina HiSeq X10 sequencer and Illumina NextSeq 500 sequencer. Values in X-axis represent the sequencing error, and the values in Y-axis represent the counts calculated from a pair of FastQ files. Fig. (a) and (b) are profiled from two different sequencing runs from same NextSeq sequencers, while Fig. (c) and (d) are profiled from two different runs from different HiSeq sequencers. We can find that the patterns of a) and b) are nearly identical, while patterns of (c) and (d) are similar, but with noticeable difference
Fig. 7
Fig. 7
An example of automatic adapter detection and cutting. The offset makes the best alignment for this pair of reads is negative, which indicates that the length of inserted DNA is less than the sequencing length. When the offset is detected, it is trivial to calculate the overlapping region, and cut the adapter bases (outside overlapping region) from 3’ of both read1 and read2
Fig. 8
Fig. 8
Two examples of strand bias profiling. X-axis is about the counts of relative forward strand K-MERs, while the Y-axis is about relative reverse ones. a shows a case of very little strand bias because most points are close to the line y=x, and (b) shows a case of serious strand bias because lots of points are close to X-axis and Y-axis, and repeat counts of some K-MERs are very high so the figure seems very sparse. Both files are downloaded from NCBI Sequence Read Archive (SRA), with accession numbers SRR1654347 and SRR2496735 [18]
Fig. 9
Fig. 9
Six sample data were examined in this evaluation experiment, all of them were downloaded from NCBI Sequence Read Archive (accession numbers: SRR2496699 SRR2496709, SRR2496731, SRR2496739, SRR2496749, SRR2496716) [18]. AfterQC preprocessed every sample data and produced clean data files. BWA + Samtools + VarScan2 pipeline was applied on both raw data (not preprocessed) and clean data (AfterQC preprocessed). The variants called from raw data, but not called from clean data were counted. In this figure, values in X-axis denote the mutation frequency and the values in Y-axis denote the number of raw data only mutations, with frequency in each of the windows. Mutations with frequency lower than 2% are categorized to the first window. From this figure, we can learn that AfterQC helps filtering out lots of low frequency mutations, while seeing no difference for relatively high frequency (10%+) mutations

References

    1. Schwarzenbach H, Hoon DS, Pantel K. Cell-free nucleic acids as biomarkers in cancer patients. Nat Rev Cancer. 2011;11(6):426–37. doi: 10.1038/nrc3066. - DOI - PubMed
    1. Quail MA, Smith M, Coupland P, Otto TD, Harris SR, Connor TR, Bertoni A, Swerdlow HP, Gu Y. A tale of three next generation sequencing platforms: comparison of ion torrent, pacific biosciences and illumina miseq sequencers. BMC genomics. 2012;13(1):1. doi: 10.1186/1471-2164-13-341. - DOI - PMC - PubMed
    1. Newman AM, Bratman SV, To J, Wynne JF, Eclov NC, Modlin LA, Liu CL, Neal JW, Wakelee HA, Merritt RE, Shrager JB. An ultrasensitive method for quantitating circulating tumor dna with broad patient coverage. Nature medicine. 2014;20(5):548. doi: 10.1038/nm.3519. - DOI - PMC - PubMed
    1. Andrews S. A Quality Control Tool for High Throughput Sequence Data. http://www.bioinformatics.bbsrc.ac.uk/projects/fastqc/. Accessed 7 Dec 2016.
    1. Schmieder R, Edwards R. Quality control and preprocessing of metagenomic datasets. Bioinformatics. 2014;27(6):266–7. - PMC - PubMed