Comparative Study
. 2017 Mar 14;18(Suppl 2):114.
doi: 10.1186/s12864-017-3501-4.

SILVA, RDP, Greengenes, NCBI and OTT - how do these taxonomies compare?

Affiliations
Comparative Study

SILVA, RDP, Greengenes, NCBI and OTT - how do these taxonomies compare?

Monika Balvočiūtė et al. BMC Genomics. .

Abstract

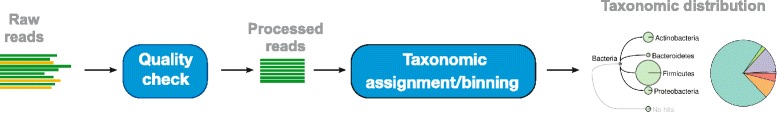
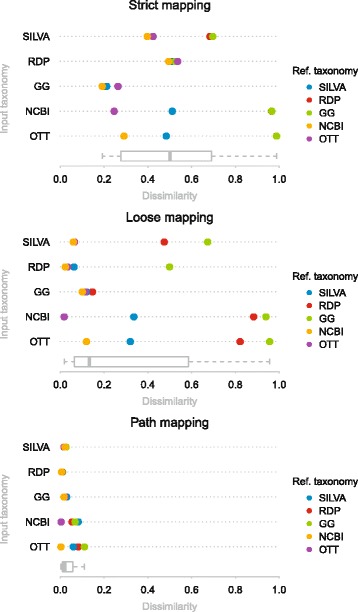
Background: A key step in microbiome sequencing analysis is read assignment to taxonomic units. This is often performed using one of four taxonomic classifications, namely SILVA, RDP, Greengenes or NCBI. It is unclear how similar these are and how to compare analysis results that are based on different taxonomies.

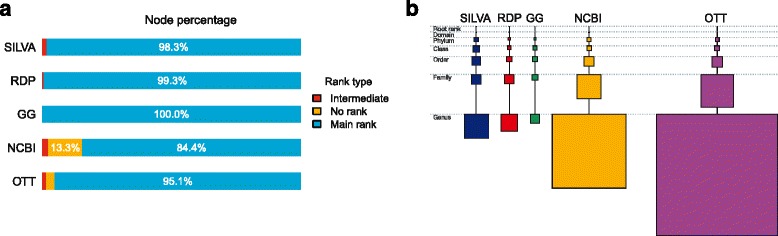
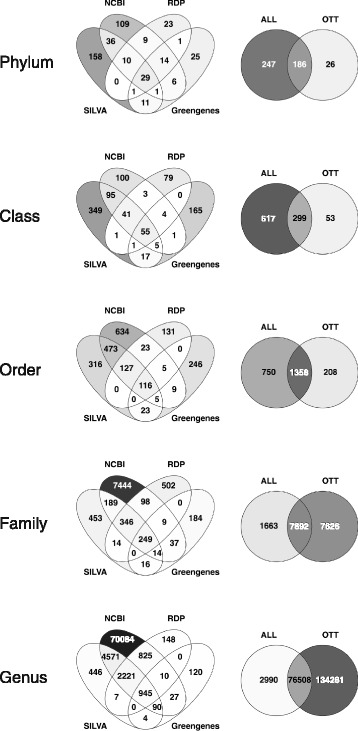
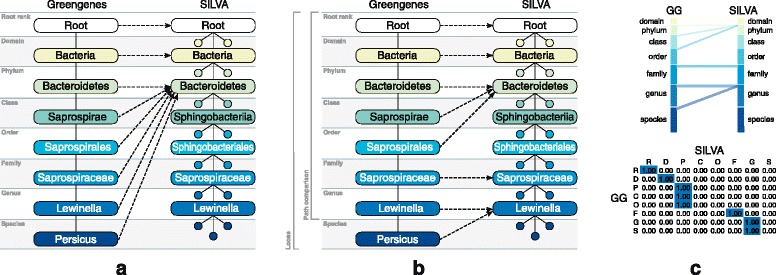
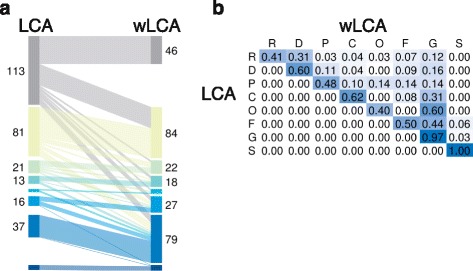
Results: We provide a method and software for mapping taxonomic entities from one taxonomy onto another. We use it to compare the four taxonomies and the Open Tree of life Taxonomy (OTT).

Conclusions: While we find that SILVA, RDP and Greengenes map well into NCBI, and all four map well into the OTT, mapping the two larger taxonomies on to the smaller ones is problematic.

Keywords: Greengenes; Metagenomics; NCBI; OTU assignment; Open tree of life; RDP; Silva; Taxonomic classification.


Figures

Fig. 1
Fig. 1
Basic taxonomic binning workflow
Fig. 2
Fig. 2
Composition of the five taxonomies. a Composition by rank type. Main rank stands for either root, domain, phylum, class, order, family, genus or species; intermediate includes all ‘sub–’, ‘infra–’, ‘super–’ etc. ranks. b Composition with respect to the number of nodes at each rank from root to genus. Square areas correspond to the number of nodes at each rank in each taxonomic classification
Fig. 3
Fig. 3
Comparison of taxonomies based on taxon names found at each rank from phylum to genus. The four taxonomies, SILVA, RDP, Greengenes and NCBI, commonly used for metagenomic analyses are compared in detail (Venn diagrams on the left) and then union of them (labeled ALL) is compared against OTT (Venn diagrams on the right). Colour intensity corresponds to the percentage of taxonomic units in the intersection. Produced with Venny 2.1 [33]
Fig. 4
Fig. 4
Examples of the mapping procedures (Greengenes into SILVA) on a set of nodes on the path from the Root to the species Persicus. a Strict mapping (top–down). From the root node we can match a path only down to the phylum level, hence all the nodes below the phylum level on the path in Greengenes are mapped to the phylum Bacteroidetes in SILVA. b Loose mapping (bottom–up). The node Persicus with species rank in Greengenes does not have a perfect match in SILVA, but its parent node Lewinella with genus rank has a match, therefore Persicus is mapped to the same node as Lewinella. In the path comparisons we consider only nodes that can be mapped perfectly themselves or whose descendants have perfect mappings. Here we consider the node Lewinella and all above, but leave out species node Persicus. c Visualization of the loose mapping from (b) as parallel sets and a heatmap with numeric values. Parallel sets plot show the “flow” of the mappings; the more parallel lines connecting the two bars, the better the overall mapping. Heatmap values are normalized by the row sums. A strong emphasis of the main diagonal indicates that the two taxonomies are compatible
Fig. 5
Fig. 5
Dissimilarities between the five taxonomies based on the pairwise mappings as estimated using formula 1. Box plots under each plot show distribution of all scores for each mapping procedure
Fig. 6
Fig. 6
Difference between taxonomic assignment with LCA and weighted LCA. Both plots indicate more specific assignments by weighted LCA as compared to LCA. Bars in the parallel sets plot in a correspond to the ranks from top as follows: root, domain, phylum, class, order, family, genus and species. Columns and rows in the heatmap in b correspond to the same ranks: R (root), D (domain), P (phylum), C (class), O (order), F (family), G (genus) and S (species)

References

    1. Huson DH, Beier S, Flade I, Górska A, El-Hadidi M, Mitra S, Ruscheweyh HJ, Tappu R. MEGAN Community Edition - interactive exploration and analysis of large-scale microbiome sequencing data. PLoS Comput Biol. 2016;12(6):1004957. doi: 10.1371/journal.pcbi.1004957. - DOI - PMC - PubMed
    1. Pruesse E, Peplies J, Glöckner FO. Sina: Accurate high-throughput multiple sequence alignment of ribosomal RNA genes. Bioinformatics. 2012;28(14):1823–9. doi: 10.1093/bioinformatics/bts252. - DOI - PMC - PubMed
    1. Cole JR, Wang Q, Fish JA, Chai B, McGarrell DM, Sun Y, Brown CT, Porras-Alfaro A, Kuske CR, Tiedje JM. Ribosomal database project: data and tools for high throughput rRNA analysis. Nucleic Acids Res. 2014;42(Database issue):633–42. doi: 10.1093/nar/gkt1244. - DOI - PMC - PubMed
    1. Yilmaz P, Parfrey LW, Yarza P, Gerken J, Pruesse E, Quast C, Schweer T, Peplies J, Ludwig W, Glöckner FO. The SILVA and “All-species Living Tree Project (LTP)” taxonomic frameworks. Nucleic Acids Res. 2014;42(Database issue):643–8. doi: 10.1093/nar/gkt1209. - DOI - PMC - PubMed
    1. Wang Q, Garrity GM, Tiedje JM, Cole JR. Naïve Bayesian classifier for rapid assignment of rRNA sequences into the new bacterial taxonomy. Appl Environ Microbiol. 2007;73(16):5261–7. doi: 10.1128/AEM.00062-07. - DOI - PMC - PubMed

Publication types

Substances

LinkOut - more resources