. 2017 Mar 31:7:45656.
doi: 10.1038/srep45656.

Single-cell RNA sequencing identifies distinct mouse medial ganglionic eminence cell types

Affiliations

Single-cell RNA sequencing identifies distinct mouse medial ganglionic eminence cell types

Ying-Jiun J Chen et al. Sci Rep. .

Abstract

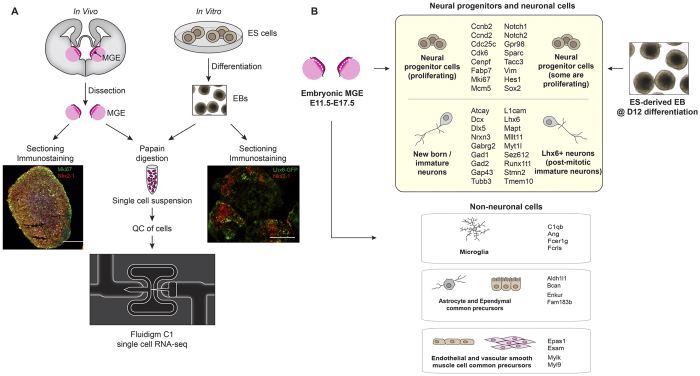
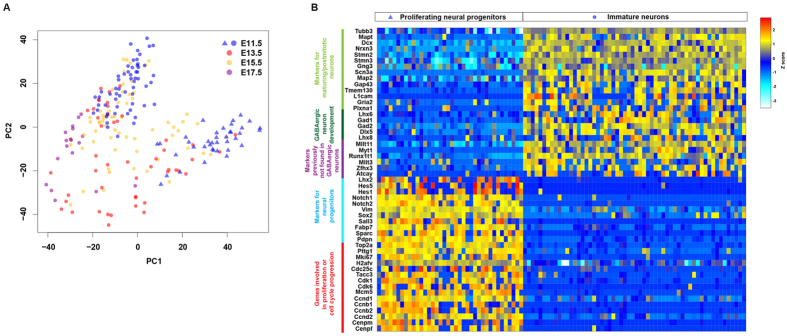
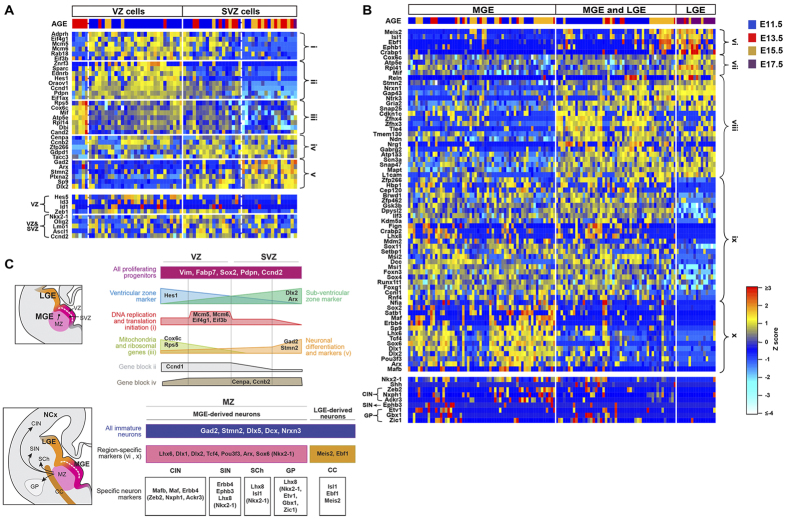
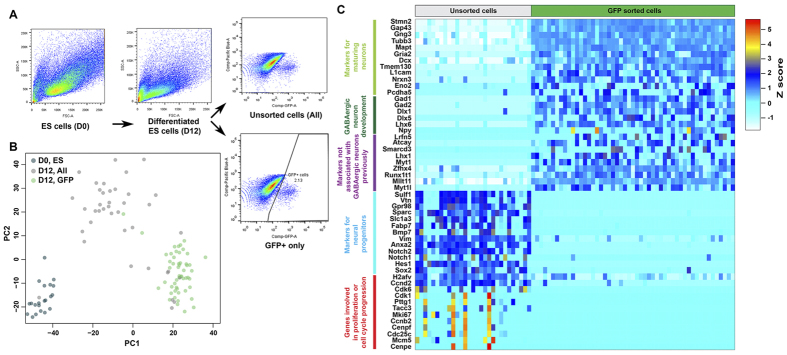
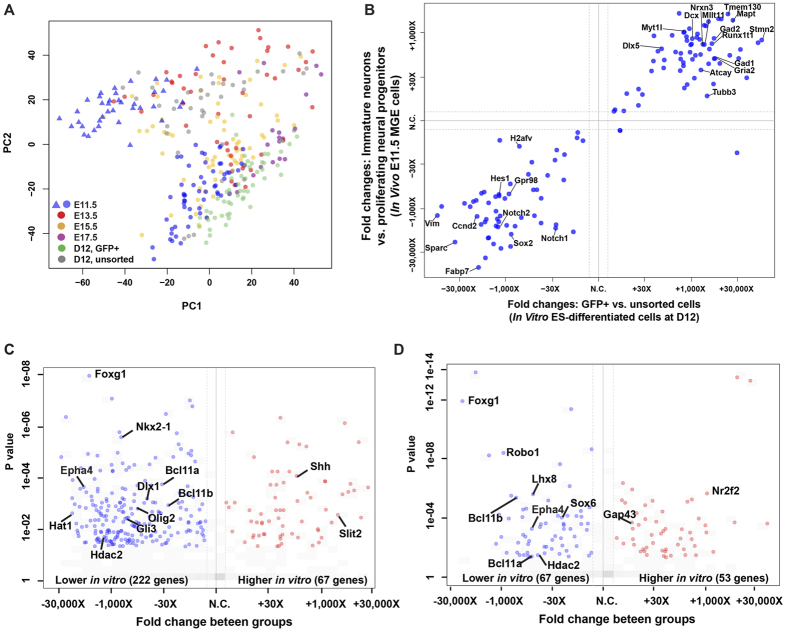
Many subtypes of cortical interneurons (CINs) are found in adult mouse cortices, but the mechanism generating their diversity remains elusive. We performed single-cell RNA sequencing on the mouse embryonic medial ganglionic eminence (MGE), the major birthplace for CINs, and on MGE-like cells differentiated from embryonic stem cells. Two distinct cell types were identified as proliferating neural progenitors and immature neurons, both of which comprised sub-populations. Although lineage development of MGE progenitors was reconstructed and immature neurons were characterized as GABAergic, cells that might correspond to precursors of different CINs were not identified. A few non-neuronal cell types were detected, including microglia. In vitro MGE-like cells resembled bona fide MGE cells but expressed lower levels of Foxg1 and Epha4. Together, our data provide detailed understanding of the embryonic MGE developmental program and suggest how CINs are specified.


Conflict of interest statement

All authors except for J.L.R. are/were employees of Genentech and declare no conflicts of interest. J.L.R. is supported by R01 Grant MH081880 from NIMH and is a Founder and Scientific Advisory Board of Neurona, Inc.

Figures

Figure 1
Figure 1. Illustration of experimental design and analysis of single-cell RNA-seq.
(A) MGE tissues of different embryonic ages were dissected from wild type mouse brains and processed either for immunostaining or single cell suspension. Embryonic stem (ES) cells J14 were differentiated into embryoid bodies (EBs) which were either processed for immunostaining or digested to generate single cell suspensions. Cell suspensions from in vitro and in vivo systems were subjected to single-cell RNA-seq with Fluidigm C1. Immunostaining of MGE tissues revealed the presence of Nkx2-1-positive (red) and Mki67-positive cells (green). Immunostaining of EB aggregates showed some cells expressing Lhx6-GFP (green) and Nkx2-1 (red). Scale bar, 200 μm. (B) Summary of cell types and transcriptional profiles identified in the MGE and in the differentiated ES cells.
Figure 2
Figure 2. Transcriptional analysis and identification of cell types in the MGE.
(A) Principal component analysis of single-cell RNA-seq data of the MGE at E11.5 (blue, n = 96), E13.5 (red, n = 48), E15.5 (orange, n = 63), and E17.5 (purple, n = 18) showed that E11.5 MGE cells cluster into two different populations (blue circles and triangles, n = 58 and 38, respectively). (B) Heatmap of selected genes differentially expressed between E11.5 MGE populations, interpreted as proliferating neural progenitors (triangles, n = 38) and post-mitotic immature neurons (circles, n = 58).
Figure 3
Figure 3. Cell sub-populations within proliferating neural progenitors and immature neurons from the MGE.
(A) A heatmap of selected PC-associated genes for proliferating neural progenitors (n = 69; E11.5 = 37, E13.5 = 19, E15.5 = 12, E17.5 = 1). Genes in the top panel are shown in the same relative order as in Supplementary Fig. 4A, representing genes (i) for DNA replication and translation initiation, (ii) with similar expression patterns as Hes1, (iii) encoding mitochondria and ribosomal RNAs, (iv) with similar expression patterns as Cenpa and Ccnb2, and (v) associated with neuronal specification like Gad2, and Stmn2. Additional VZ and SVZ markers are shown in the bottom panel. (B) A heatmap of selected PC-associated genes for immature neurons (n = 125, E11.5 = 58, E13.5 = 16, E15.5 = 38, E17.5 = 13). Genes in the top panel are shown in the same relative order as in Supplementary Fig. 4B, representing genes (vi) associated with LGE-derived neurons, (vii) of mitochondria and ribosomal RNAs, (viii) with neuronal functions or are neuronal markers, (ix) whose functions are transcriptional modifiers and/or basal ganglion patterning genes and (x) associated with MGE-derived neurons. The bottom panel of the heatmap shows additional markers that were used to assist the identification of MGE-derived neurons. (C) Illustrations of the MGE with sub-division of VZ, SVZ, and MZ (top left), and the future destinations of MGE-derived neurons (bottom left). Corridor cells (CC) are also shown. Summary of the characterization of MGE proliferating cells (top right) and immature neurons (bottom right) based on the PCA analyses are shown on the right. Region-specific markers and specific neuron markers were derived based on our single cell RNA-seq data. Genes that are shown inside brackets are additional markers not derived from PCA analysis. VZ, ventricular zone; SVZ, sub-ventricular zone; MZ, mantle zone; NCx, Neocortex; CIN, cortical interneurons; SIN, striatal interneurons; SCh, Striatal cholinergic interneurons; GP, globus pallidus.
Figure 4
Figure 4. Single-cell RNA-seq analysis of in vitro ES and MGE-like cells.
(A) Flow cytometry analysis of undifferentiated ES cells at day 0 (D0) and differentiated ES cells at day 12 (D12). D0 ES cells and D12 ES cells that were either unsorted or GFP sorted (GFP+) were subjected to single-cell RNA-seq. (B) Separate clusters representing ES D0 (teal, n = 21), D12 unsorted (grey, n = 39) and GFP+ (green, n = 53) cells can be identified by PCA. (C) Differential gene expression analysis of unsorted ES (n = 29) and GFP+ (n = 51) cells at D12.
Figure 5
Figure 5. Comparison of single-cell RNA-seq data from in vivo MGE and in vitro MGE-like cells.
(A) PCA of MGE cells at E11.5 (blue, n = 96), E13.5 (red, n = 48), E15.5 (orange, n = 63) and E17.5 (purple, n = 18), ES D12 unsorted (grey, n = 39) and ES D12 GFP+ (green, n = 53) cells. (B) Comparison between two systems displaying the relationship of differences found in vitro (X axis, fold change of GFP+ vs. unsorted cells) and in vivo (Y axis, fold change of E11.5 immature neurons vs. proliferating neural progenitors). Genes that were significantly differentially expressed (p < 0.05) in both systems are shown in the upper right and lower left corners with some highlighted. (C,D) Volcano plots displaying genes that were significantly differentially expressed (p < 0.05) (C) between in vitro unsorted cells and in vivo proliferating neural progenitors and (D) between in vitro GFP+ cells and in vivo immature neurons.

References

    1. Kepecs A. & Fishell G. Interneuron cell types are fit to function. Nature 505, 318–326 (2014). - PMC - PubMed
    1. Kubota Y. Untangling GABAergic wiring in the cortical microcircuit. Curr Opin Neurobiol 26, 7–14 (2014). - PubMed
    1. Rudy B., Fishell G., Lee S. & Hjerling-Leffler J. Three groups of interneurons account for nearly 100% of neocortical GABAergic neurons. Dev Neurobiol 71, 45–61 (2011). - PMC - PubMed
    1. Wonders C. P. & Anderson S. A. The origin and specification of cortical interneurons. Nat Rev Neurosci 7, 687–696 (2006). - PubMed
    1. Flames N. et al. Delineation of multiple subpallial progenitor domains by the combinatorial expression of transcriptional codes. J Neurosci 27, 9682–9695 (2007). - PMC - PubMed

Publication types