. 2017 Mar 31:8:14868.
doi: 10.1038/ncomms14868.

Dispersion/dilution enhances phytoplankton blooms in low-nutrient waters

Affiliations

Dispersion/dilution enhances phytoplankton blooms in low-nutrient waters

Yoav Lehahn et al. Nat Commun. .

Abstract

Spatial characteristics of phytoplankton blooms often reflect the horizontal transport properties of the oceanic turbulent flow in which they are embedded. Classically, bloom response to horizontal stirring is regarded in terms of generation of patchiness following large-scale bloom initiation. Here, using satellite observations from the North Pacific Subtropical Gyre and a simple ecosystem model, we show that the opposite scenario of turbulence dispersing and diluting fine-scale (∼1-100 km) nutrient-enriched water patches has the critical effect of regulating the dynamics of nutrients-phytoplankton-zooplankton ecosystems and enhancing accumulation of photosynthetic biomass in low-nutrient oceanic environments. A key factor in determining ecological and biogeochemical consequences of turbulent stirring is the horizontal dilution rate, which depends on the effective eddy diffusivity and surface area of the enriched patches. Implementation of the notion of horizontal dilution rate explains quantitatively plankton response to turbulence and improves our ability to represent ecological and biogeochemical processes in oligotrophic oceans.


Conflict of interest statement

The authors declare no competing financial interests.

Figures
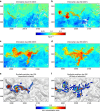
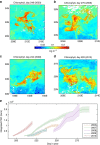
Figure 1
Figure 1. Spatio-temporal evolution of the 2007 bloom.
(ad) Satellite-derived maps of chlorophyll concentrations showing snapshots from the 3 months bloom evolution. Black polygon delineates bloom boundaries as defined by the 0.13 mg m−3 chlorophyll contour. (e,f) Density plot showing concentration of synthetic particles advected by the satellite-derived velocity field at the initial and final stages of the numerical experiment (days 0 and 58 of the numerical experiment, corresponding to year days 232 and 290, respectively). The particles were initiated over the area associated with the bloom's spatial extension on day 232 (that is, b) and were advected without any re-seeding. The positions of the particles in time is provided explicitly by the numerical integrator. Arrows represent the satellite-derived velocity vectors used for advecting the numerical particles. The remarkable similarity between bloom morphology and particle distribution after the 2-month period of particle advection is noteworthy (compare d and f).
Figure 2
Figure 2. Satellite-based Lagrangian time series of the 2007 bloom.
(a) Patch surface area. (b) Chlorophyll biomass integrated spatially over the patch surface area and vertically along the MLD as derived from ARGO floats. (c) Chlorophyll concentrations averaged spatially over the patch surface area. Black solid lines and shaded area denote mean and s.d. values, respectively, for different border-delimiting chlorophyll contours (0.11–0.16 mg m−3). Blue lines in a and b represent linear and logistic fits, respectively, for the mean time series. Dashed line in c shows background chlorophyll concentrations.
Figure 3
Figure 3. Dispersed blooms in the North Pacific Subtropical Gyre.
(ad) Maps of satellite-derived surface chlorophyll showing snapshots from the development of fine-scale dispersed blooms observed in four different years. (e) Satellite-based Lagrangian time series of total accumulation of POC for the blooms shown in this figure and for the 2007 bloom discussed in the text.
Figure 4
Figure 4. Plankton response to horizontal dilution in the ecosystem model.
(a) Normalized steady-state biomass accumulation of phytoplankton, zooplankton and nutrients (red, black and blue lines, respectively) for different values of the non-dimensional parameter γ, defined as the ratio between initial dilution rate and phytoplankton growth rate. Phytoplankton growth rate and grazing rate are 1.6 d−1 and 0.12 d−1, respectively. Black star marks maximum phytoplankton biomass yield (associated with β0_opt for the specific combination of growth rate and grazing rate). (b) Optimal initial dilution rate as a function of phytoplankton growth rate. Colours represent different grazing rates. Solid lines show the corresponding linear fits.

References

    1. Field C. B., Behrenfeld M. J., Randerson J. T. & Falkowski P. Primary production of the biosphere: integrating terrestrial and oceanic components. Science 281, 237–240 (1998). - PubMed
    1. Riley G. A. Factors controlling phytoplankton populations on Georges Bank. J. Marine Res. 6, 54–73 (1946).
    1. Abraham E. R. et al.. Importance of stirring in the development of an iron-fertilized phytoplankton bloom. Nature 407, 727–730 (2000). - PubMed
    1. Martin A. P. Phytoplankton patchiness: the role of lateral stirring and mixing. Prog. Oceanogr. 57, 125–174 (2003).
    1. Lehahn Y., d'Ovidio F., Lévy M. & Heifetz E. Stirring of the northeast Atlantic spring bloom: a Lagrangian analysis based on multi-satellite data. J. Geophys. Res. 112, C08005 (2007).

Publication types

LinkOut - more resources