

Hidden Markov models reveal complexity in the diving behaviour of short-finned pilot whales
- PMID: 28361954
- PMCID: PMC5374633
- DOI: 10.1038/srep45765
Hidden Markov models reveal complexity in the diving behaviour of short-finned pilot whales
Abstract
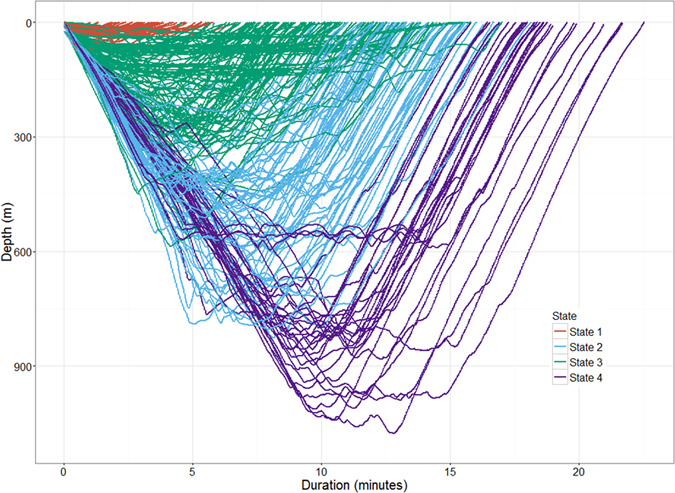
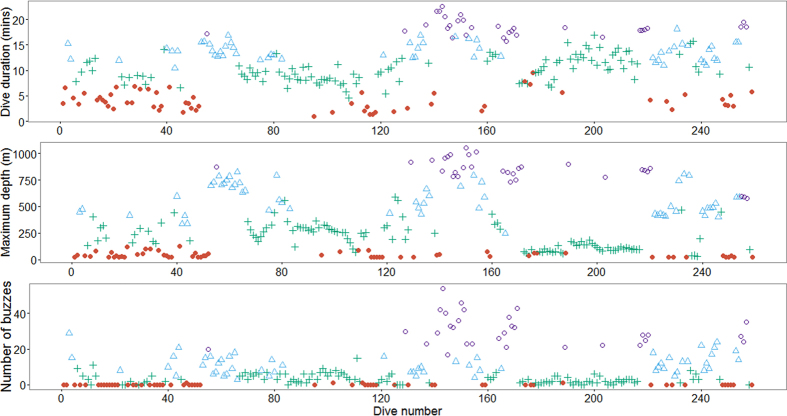
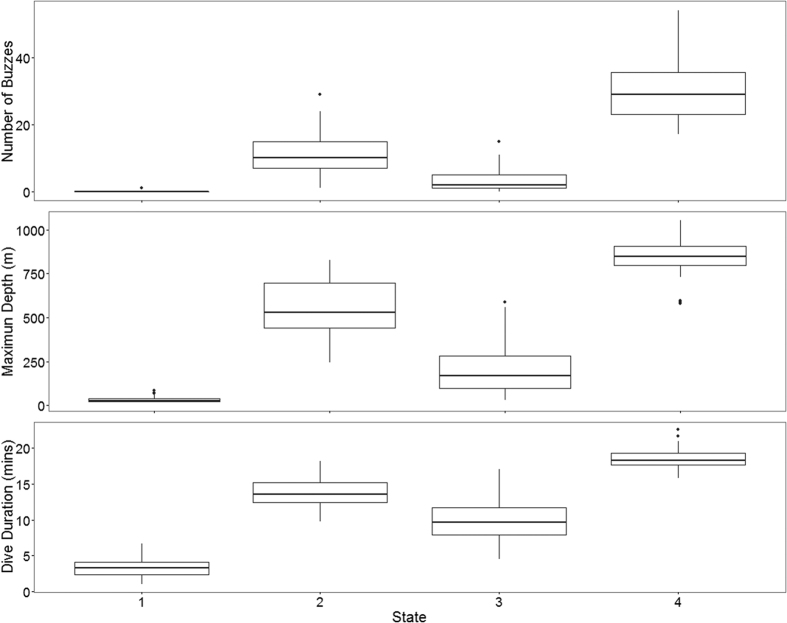
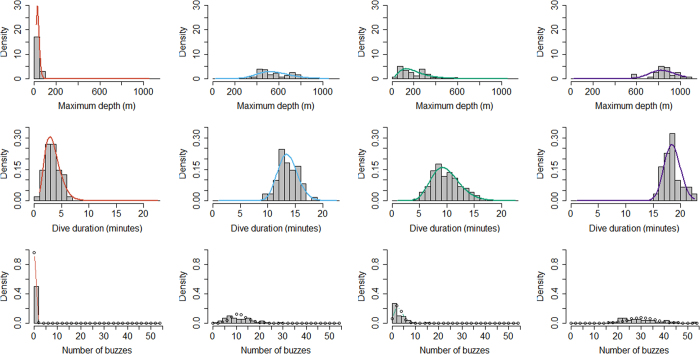
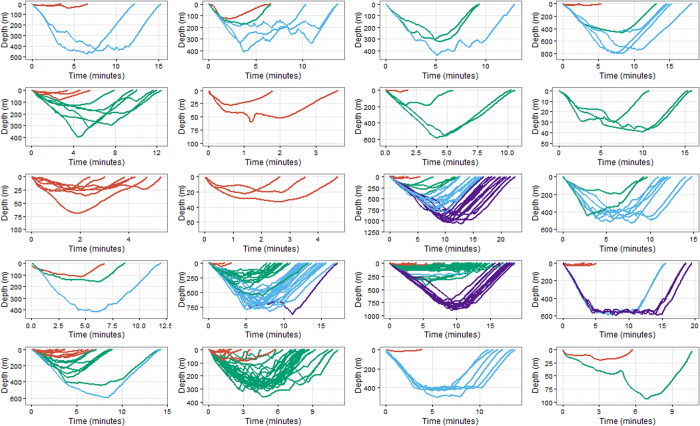
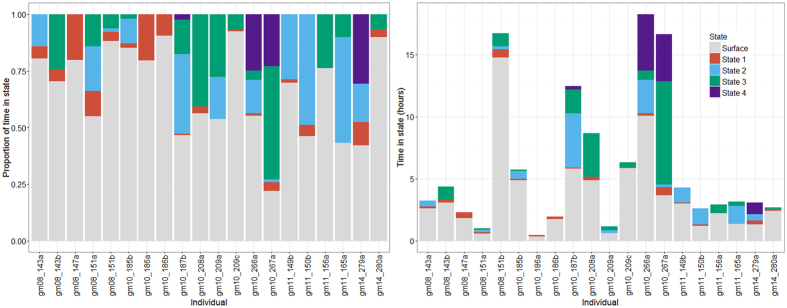
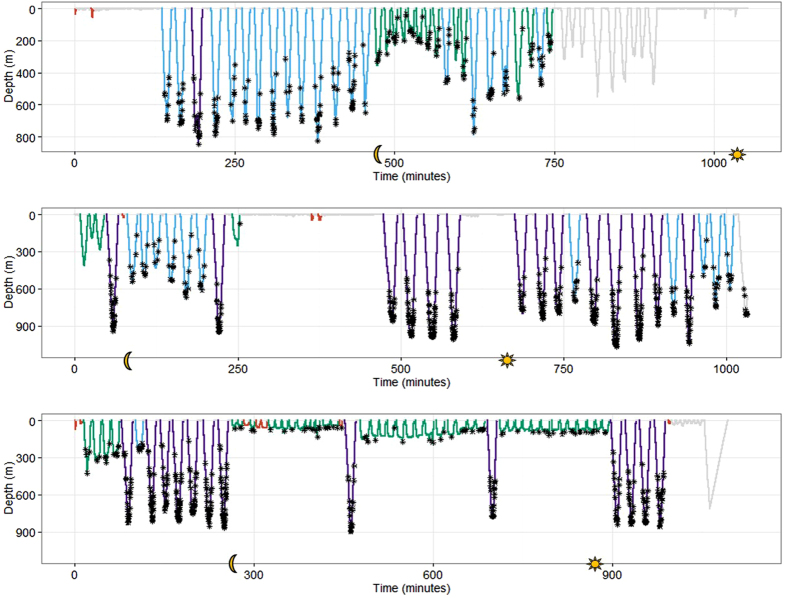
Diving behaviour of short-finned pilot whales is often described by two states; deep foraging and shallow, non-foraging dives. However, this simple classification system ignores much of the variation that occurs during subsurface periods. We used multi-state hidden Markov models (HMM) to characterize states of diving behaviour and the transitions between states in short-finned pilot whales. We used three parameters (number of buzzes, maximum dive depth and duration) measured in 259 dives by digital acoustic recording tags (DTAGs) deployed on 20 individual whales off Cape Hatteras, North Carolina, USA. The HMM identified a four-state model as the best descriptor of diving behaviour. The state-dependent distributions for the diving parameters showed variation between states, indicative of different diving behaviours. Transition probabilities were considerably higher for state persistence than state switching, indicating that dive types occurred in bouts. Our results indicate that subsurface behaviour in short-finned pilot whales is more complex than a simple dichotomy of deep and shallow diving states, and labelling all subsurface behaviour as deep dives or shallow dives discounts a significant amount of important variation. We discuss potential drivers of these patterns, including variation in foraging success, prey availability and selection, bathymetry, physiological constraints and socially mediated behaviour.
Conflict of interest statement
The authors declare no competing financial interests.
Figures
Similar articles
-
Cheetahs of the deep sea: deep foraging sprints in short-finned pilot whales off Tenerife (Canary Islands).J Anim Ecol. 2008 Sep;77(5):936-47. doi: 10.1111/j.1365-2656.2008.01393.x. Epub 2008 Apr 28. J Anim Ecol. 2008. PMID: 18444999
-
Diving behaviour of Cuvier's beaked whales (Ziphius cavirostris) off Cape Hatteras, North Carolina.R Soc Open Sci. 2019 Feb 6;6(2):181728. doi: 10.1098/rsos.181728. eCollection 2019 Feb. R Soc Open Sci. 2019. PMID: 30891284 Free PMC article.
-
Deep-diving foraging behaviour of sperm whales (Physeter macrocephalus).J Anim Ecol. 2006 May;75(3):814-25. doi: 10.1111/j.1365-2656.2006.01101.x. J Anim Ecol. 2006. PMID: 16689963
-
How man-made interference might cause gas bubble emboli in deep diving whales.Front Physiol. 2014 Jan 28;5:13. doi: 10.3389/fphys.2014.00013. eCollection 2014. Front Physiol. 2014. PMID: 24478724 Free PMC article. Review.
-
Physiological constraints and energetic costs of diving behaviour in marine mammals: a review of studies using trained Steller sea lions diving in the open ocean.J Comp Physiol B. 2017 Jan;187(1):29-50. doi: 10.1007/s00360-016-1035-8. Epub 2016 Sep 29. J Comp Physiol B. 2017. PMID: 27686668 Review.
Cited by
-
Strange attractor of a narwhal (Monodon monoceros).PLoS Comput Biol. 2022 Sep 22;18(9):e1010432. doi: 10.1371/journal.pcbi.1010432. eCollection 2022 Sep. PLoS Comput Biol. 2022. PMID: 36136974 Free PMC article.
-
Isotopic Niche Analysis of Long-Finned Pilot Whales (Globicephala melas edwardii) in Aotearoa New Zealand Waters.Biology (Basel). 2022 Sep 28;11(10):1414. doi: 10.3390/biology11101414. Biology (Basel). 2022. PMID: 36290319 Free PMC article.
-
Uncovering ecological state dynamics with hidden Markov models.Ecol Lett. 2020 Dec;23(12):1878-1903. doi: 10.1111/ele.13610. Epub 2020 Oct 19. Ecol Lett. 2020. PMID: 33073921 Free PMC article. Review.
-
A brief introduction to the analysis of time-series data from biologging studies.Philos Trans R Soc Lond B Biol Sci. 2021 Aug 16;376(1831):20200227. doi: 10.1098/rstb.2020.0227. Epub 2021 Jun 28. Philos Trans R Soc Lond B Biol Sci. 2021. PMID: 34176325 Free PMC article. Review.
-
Hidden Markov models reveal temporal patterns and sex differences in killer whale behavior.Sci Rep. 2019 Oct 18;9(1):14951. doi: 10.1038/s41598-019-50942-2. Sci Rep. 2019. PMID: 31628371 Free PMC article.
References
-
- Hooker S. K. & Baird R. W. Diving and ranging behaviour of odontocetes: a methodological review and critique. Mamm. Rev. 31, 81–105 (2001).
-
- Johnson M., Aguilar de Soto N. A. & Madsen P. T. Studying the behaviour and sensory ecology of marine mammals using acoustic recording tags: a review Mar. Ecol. Prog. Ser. 395, 55–73 (2009).
-
- Johnson M. P. & Tyack P. L. A digital acoustic recording tag for measuring the response of wild marine mammals to sound. IEEE J. Oceanic Eng. 28, 3–12 (2003).
Publication types
MeSH terms
LinkOut - more resources
Full Text Sources
Other Literature Sources
