

Effects of contact structure on the transient evolution of HIV virulence
- PMID: 28362805
- PMCID: PMC5391972
- DOI: 10.1371/journal.pcbi.1005453
Effects of contact structure on the transient evolution of HIV virulence
Abstract
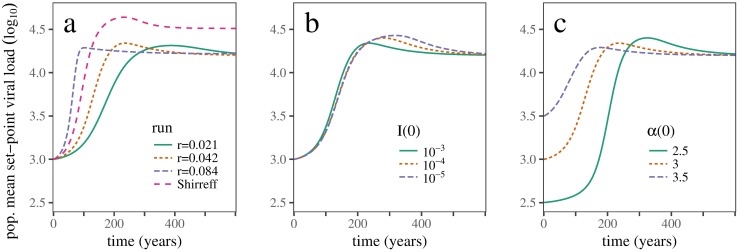
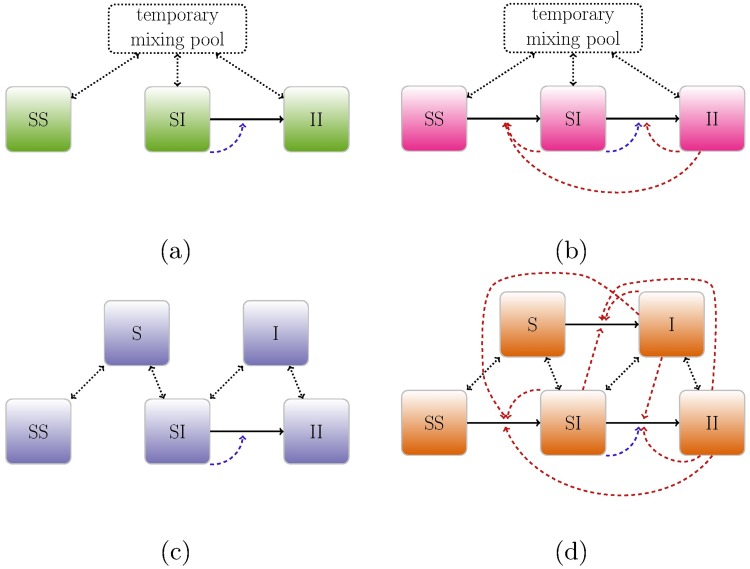
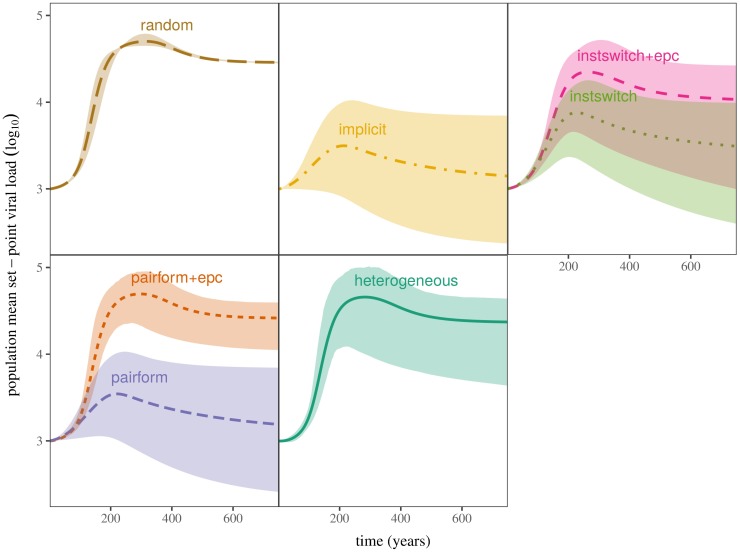
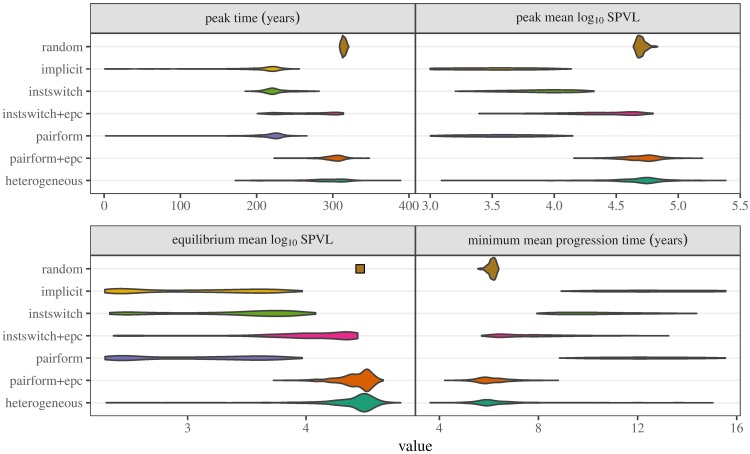
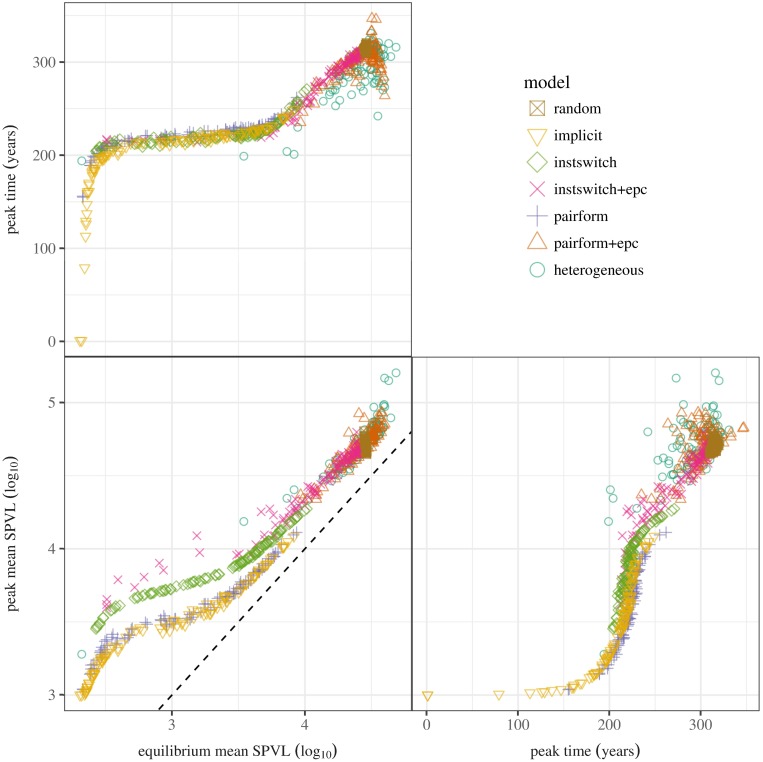
Early in an epidemic, high densities of susceptible hosts select for relatively high parasite virulence; later in the epidemic, lower susceptible densities select for lower virulence. Thus over the course of a typical epidemic the average virulence of parasite strains increases initially, peaks partway through the epidemic, then declines again. However, precise quantitative outcomes, such as the peak virulence reached and its timing, may depend sensitively on epidemiological details. Fraser et al. proposed a model for the eco-evolutionary dynamics of HIV that incorporates the tradeoffs between transmission and virulence (mediated by set-point viral load, SPVL) and their heritability between hosts. Their model used implicit equations to capture the effects of partnership dynamics that are at the core of epidemics of sexually transmitted diseases. Our models combine HIV virulence tradeoffs with a range of contact models, explicitly modeling partnership formation and dissolution and allowing for individuals to transmit disease outside of partnerships. We assess summary statistics such as the peak virulence (corresponding to the maximum value of population mean log10 SPVL achieved throughout the epidemic) across models for a range of parameters applicable to the HIV epidemic in sub-Saharan Africa. Although virulence trajectories are broadly similar across models, the timing and magnitude of the virulence peak vary considerably. Previously developed implicit models predicted lower virulence and slower progression at the peak (a maximum of 3.5 log10 SPVL) compared both to more realistic models and to simple random-mixing models with no partnership structure at all (both with a maximum of ≈ 4.7 log10 SPVL). In this range of models, the simplest random-mixing structure best approximates the most realistic model; this surprising outcome occurs because the dominance of extra-pair contact in the realistic model swamps the effects of partnership structure.
Conflict of interest statement
The authors have declared that no competing interests exist.
Figures
Similar articles
-
An HIV epidemic model based on viral load dynamics: value in assessing empirical trends in HIV virulence and community viral load.PLoS Comput Biol. 2014 Jun 19;10(6):e1003673. doi: 10.1371/journal.pcbi.1003673. eCollection 2014 Jun. PLoS Comput Biol. 2014. PMID: 24945322 Free PMC article.
-
Virus-induced target cell activation reconciles set-point viral load heritability and within-host evolution.Epidemics. 2013 Dec;5(4):174-80. doi: 10.1016/j.epidem.2013.09.002. Epub 2013 Sep 23. Epidemics. 2013. PMID: 24267873
-
Transmission selects for HIV-1 strains of intermediate virulence: a modelling approach.PLoS Comput Biol. 2011 Oct;7(10):e1002185. doi: 10.1371/journal.pcbi.1002185. Epub 2011 Oct 13. PLoS Comput Biol. 2011. PMID: 22022243 Free PMC article.
-
The impact of HIV-1 within-host evolution on transmission dynamics.Curr Opin Virol. 2018 Feb;28:92-101. doi: 10.1016/j.coviro.2017.12.001. Epub 2017 Dec 21. Curr Opin Virol. 2018. PMID: 29275182 Review.
-
Potential Pitfalls in Estimating Viral Load Heritability.Trends Microbiol. 2016 Sep;24(9):687-698. doi: 10.1016/j.tim.2016.04.008. Epub 2016 May 12. Trends Microbiol. 2016. PMID: 27185643 Review.
Cited by
-
Contact rate and risk factors of classical swine fever disease in commercial and smallholder pig farms, Karanganyar, Central Java, Indonesia.Vet World. 2021 Mar;14(3):758-763. doi: 10.14202/vetworld.2021.758-763. Epub 2021 Mar 24. Vet World. 2021. PMID: 33935424 Free PMC article.
-
The influence of social behaviour on competition between virulent pathogen strains.J Theor Biol. 2018 Oct 14;455:47-53. doi: 10.1016/j.jtbi.2018.06.028. Epub 2018 Jul 5. J Theor Biol. 2018. PMID: 29981338 Free PMC article.
-
Coupling the Within-Host Process and Between-Host Transmission of COVID-19 Suggests Vaccination and School Closures are Critical.Bull Math Biol. 2022 Dec 19;85(1):6. doi: 10.1007/s11538-022-01104-5. Bull Math Biol. 2022. PMID: 36536179 Free PMC article.
References
-
- Dwyer G, Levin SA, Buttel L. A simulation model of the population dynamics and evolution of myxomatosis. Ecol Monog. 1990;60:423–447. 10.2307/1943014 - DOI
Publication types
MeSH terms
LinkOut - more resources
Full Text Sources
Other Literature Sources
Medical
