. 2017 May 1;214(5):1259-1267.
doi: 10.1084/jem.20161533. Epub 2017 Mar 31.

Differentiation of germinal center B cells into plasma cells is initiated by high-affinity antigen and completed by Tfh cells

Affiliations

Differentiation of germinal center B cells into plasma cells is initiated by high-affinity antigen and completed by Tfh cells

Nike J Kräutler et al. J Exp Med. .

Abstract

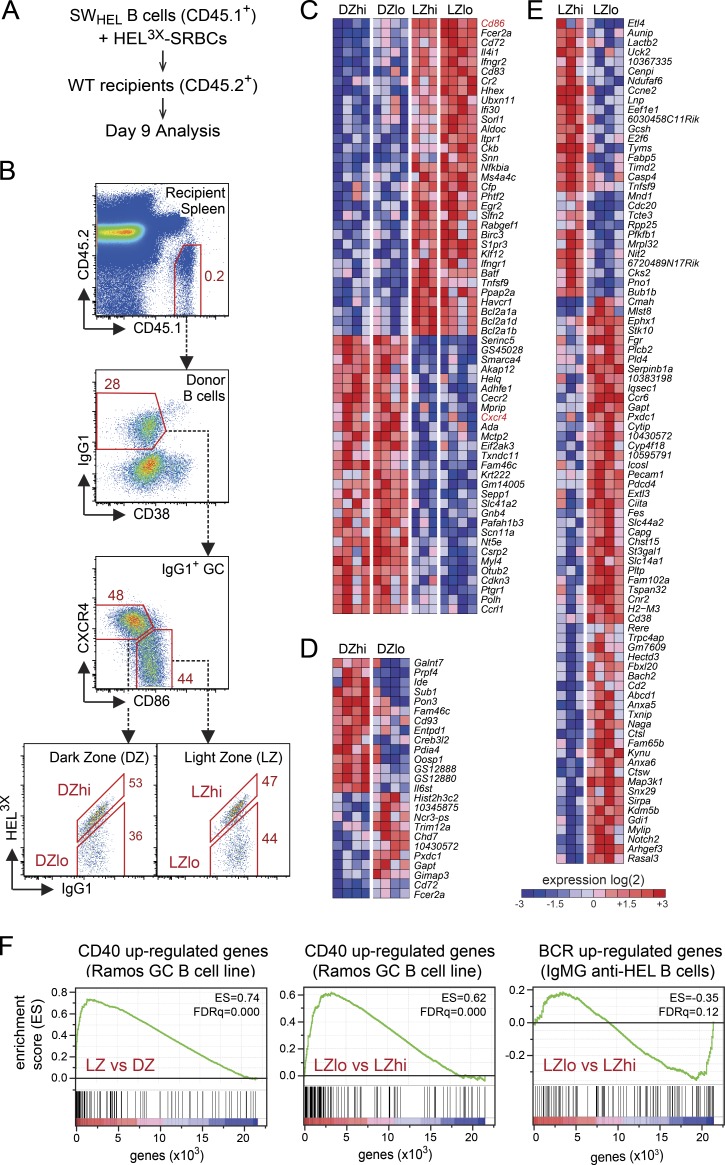
Plasma cells (PCs) derived from germinal centers (GCs) secrete the high-affinity antibodies required for long-term serological immunity. Nevertheless, the process whereby GC B cells differentiate into PCs is uncharacterized, and the mechanism underlying the selective PC differentiation of only high-affinity GC B cells remains unknown. In this study, we show that differentiation into PCs is induced among a discrete subset of high-affinity B cells residing within the light zone of the GC. Initiation of differentiation required signals delivered upon engagement with intact antigen. Signals delivered by T follicular helper cells were not required to initiate differentiation but were essential to complete the differentiation process and drive migration of maturing PCs through the dark zone and out of the GC. This bipartite or two-signal mechanism has likely evolved to both sustain protective immunity and avoid autoantibody production.


Figures

Figure 1.
Figure 1.
Identification of high- and low-affinity LZ and DZ SWHEL GC B cells and their affinity-dependent gene expression signatures. (A) General experimental strategy. (B) Flow cytometric gating used to sort and characterize donor-derived SWHEL GC B cells. IgG1+ GC B cells are resolved into high- and low-affinity DZ and LZ populations (DZhi, DZlo, LZhi, and LZlo). (C) Heat map showing genes differentially expressed between DZ and LZ GC B cells regardless of BCR antigen affinity. Genes encoding markers used to define the DZ and LZ subsets (Cd86 and Cxcr4) are indicated in red. The fold-change cutoff was set to ≥1.5984 (= fold-change up-regulation of Cxcr4 in DZ vs. LZ) with P ≤ 0.0005. (D and E) Heat maps showing genes differentially expressed according to BCR antigen affinity within either the DZ (D) or LZ (E). (F) GSEA of relative gene expression in total LZ versus total DZ GC B cells (left) or LZlo versus LZhi GC B cells (middle) against the gene set identified as up-regulated after CD40L stimulation of the human GC B cell line Ramos (Basso et al., 2004) and LZlo versus LZhi GC B cells against genes up-regulated by antigen (HEL) stimulation of B cells expressing an IgM BCR with an IgG1 cytoplasmic tail (Horikawa et al., 2007). FDRq, false discovery rate. Gene expression data represent four independent experiments of 25 mice per experiment.
Figure 2.
Figure 2.
Identification of early and late PC-lineage cells in the GC and enrichment of early PCs in the LZ. (A) Heat map of selected genes known to be up-regulated (top eight) or down-regulated (bottom three) in PCs, indicating a strong PC gene expression signature in the DZhi compartment. (B and C) GSEA of differential gene expression according to antigen affinity within the DZ (B) and LZ (C) compartments, against gene sets either up-regulated (left) or down-regulated (right) in PCs (Mori et al., 2008). FDRq, false discovery rate. (D) Proportion of cells within each of the four GC subcompartments detected as Blimp1-GFP+ on day 9 of the SWHEL.Blimp1gfp/+ response to HEL3X-SRBCs. (E, top) Day 9 GC B cells derived from SWHEL.Blimp1+/+ and SWHEL.Blimp1gfp/+ donor B cells resolving Blimp1-GFPlo, IgG1hi, and Blimp1-GFPhi IgG1lo subpopulations. (Bottom) Histogram overlays showing higher B220 and CD45 staining on the Blimp1-GFPlo IgG1hi population. (F) Flow cytometric analysis of the LZ and DZ phenotypes of Blimp1-GFP+ IgG1+ GC B cells. Data from are representative of five independent experiments of five mice per group. Flow cytometry plots are concatenated data from five recipient mice. P-values were calculated using a paired Student’s t test. *, 0.01 ≤ P < 0.05; **, 0.001 ≤ P < 0.01.
Figure 3.
Figure 3.
Blocking antigen access, but not Tfh cell help, prevents initiation of PC differentiation in the GC. (A) Schematic of antigen engagement and reception of cognate CD4+ Tfh cell help by SWHEL B cells in unmanipulated GCs (top), plus the mAb-based approaches used to specifically block Tfh cell help (bottom left) or block engagement of intact antigen by the SWHEL BCR (bottom right). Both HyHEL10* and HyHEL9 bind to HEL3X, but only HyHEL10* blocks access to the antigen by the SWHEL BCR. (B) Experimental design for mAb-blocking experiments. SWHEL.Blimp1gfp/+ B cells were permitted to form GCs in response to HEL3X-SRBCs and recipients and then given a single injection of mAbs 2 or 3 d before spleen harvest and analysis on day 9. (C and D) Impact of 3 d of mAb treatment on IgG1+ PC-lineage cells in GCs derived from SWHEL.Blimp1gfp/+ donor B cells. Representative flow cytometry profiles are shown (C), as well as enumeration of early (Blimp1-GFPlo IgG1hi) and late (Blimp1-GFPhi IgG1lo) PC-lineage populations in individual recipients (D). (E and F) Impact of 2 d of HyHEL10* treatment analyzed as for C and D. Data from each mAb treatment are representative of two to four independent experiments of five mice per group. Flow cytometry plots are concatenated data from five recipient mice. P-values were calculated using an unpaired Student’s t test. **, 0.001 ≤ P < 0.01.
Figure 4.
Figure 4.
PC-lineage cells are enriched in the LZ after depletion of CD4+ Tfh cells and colocalize with FDCs. (A and B) GC responses were established from SWHEL.Blimp1gfp/+ B cells and subjected to 3-d treatment with either anti-CD40L (A) or anti-CD4 (B) as outlined in Fig. 3. (Left) Representative flow cytometry profiles indicate the impact of mAb treatments on the LZ and DZ phenotypes of IgG1+ PC-lineage cells (Blimp1-GFP+). (Right) The proportions of IgG1+ PC-lineage cells that fell within the DZhi, DZlo, LZhi, and LZlo compartments in individual recipients were also enumerated. (C) Immunofluorescence histology of spleens from recipient mice 9 d after transfer of SWHEL B cells plus HEL3X-SRBCs and 3 d after injection of isotype control or anti-CD4 mAb. The B cell follicle (Fo) is marked by IgD (white), the LZ by CD35 (FDCs; red), and the DZ by CXCR4 (blue). The unstained T cell zone (TZ) is also indicated. IgG1+ PC-lineage cells are identifiable by bright (cytoplasmic) staining (green). Frequencies of IgG1+ PC-lineage cells identified within the LZ (containing CD35+ FDCs) by immunofluorescence analysis were 7% (5/66) in isotype-treated and 69% (76/110) in anti-CD4–treated mice (enumerated over 17 and 16 individual GCs, respectively). Bars, 50 µm. Data are representative of two to four independent experiments of five mice per group (A and B) or are representative of four independent experiments of five mice per group (C). P-values were calculated using an unpaired Student’s t test. ***, P < 0.001.

References

    1. Gatto D., and Brink R.. 2010. The germinal center reaction. J. Allergy Clin. Immunol. 126:898–907. 10.1016/j.jaci.2010.09.007 - DOI - PubMed
    1. Victora G.D., and Nussenzweig M.C.. 2012. Germinal centers. Annu. Rev. Immunol. 30:429–457. 10.1146/annurev-immunol-020711-075032 - DOI - PubMed
    1. Berek C., Berger A., and Apel M.. 1991. Maturation of the immune response in germinal centers. Cell. 67:1121–1129. 10.1016/0092-8674(91)90289-B - DOI - PubMed
    1. Jacob J., Kelsoe G., Rajewsky K., and Weiss U.. 1991. Intraclonal generation of antibody mutants in germinal centres. Nature. 354:389–392. 10.1038/354389a0 - DOI - PubMed
    1. Phan T.G., Paus D., Chan T.D., Turner M.L., Nutt S.L., Basten A., and Brink R.. 2006. High affinity germinal center B cells are actively selected into the plasma cell compartment. J. Exp. Med. 203:2419–2424. 10.1084/jem.20061254 - DOI - PMC - PubMed

Publication types

MeSH terms

Substances