. 2017 Apr 18;114(16):E3251-E3257.
doi: 10.1073/pnas.1701884114. Epub 2017 Mar 31.

Facilitated dissociation of transcription factors from single DNA binding sites

Affiliations

Facilitated dissociation of transcription factors from single DNA binding sites

Ramsey I Kamar et al. Proc Natl Acad Sci U S A. .

Abstract

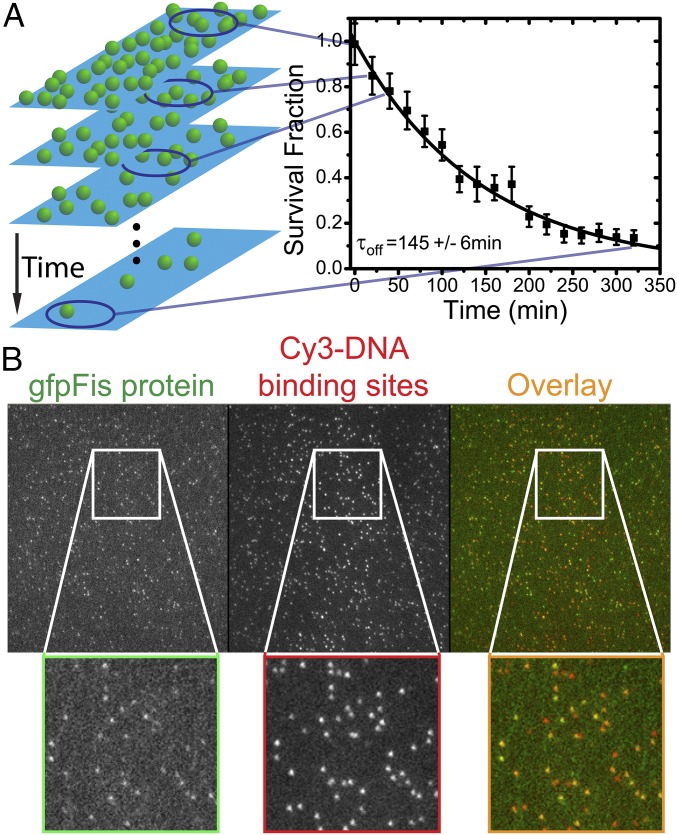
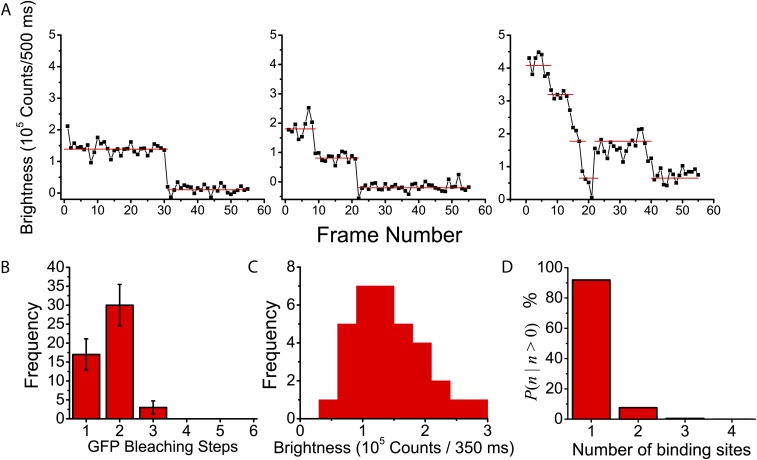
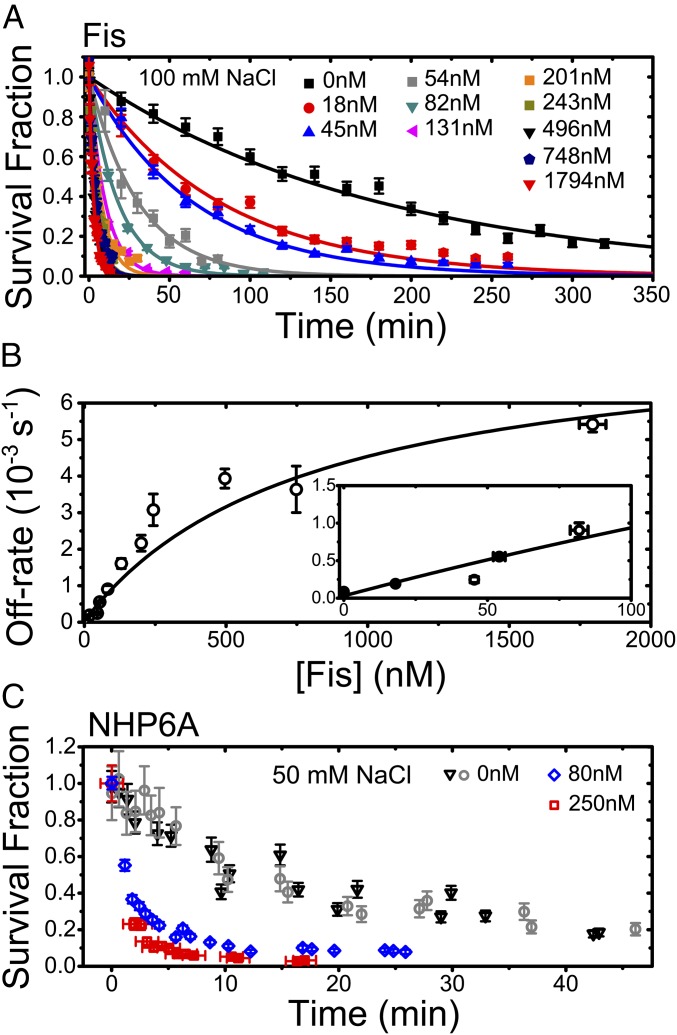
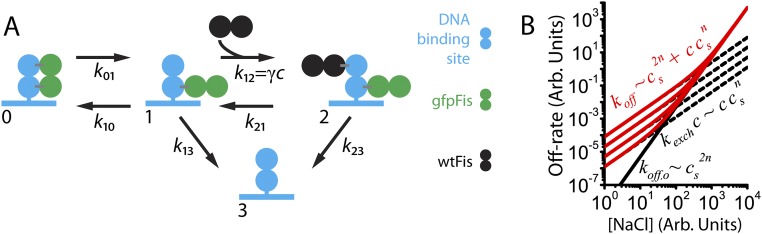
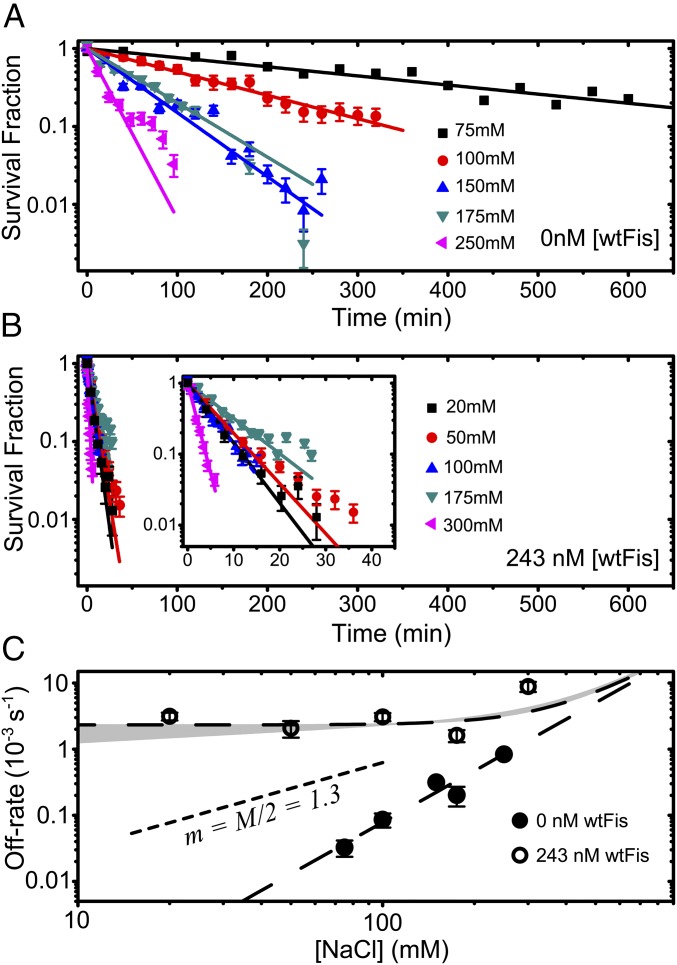
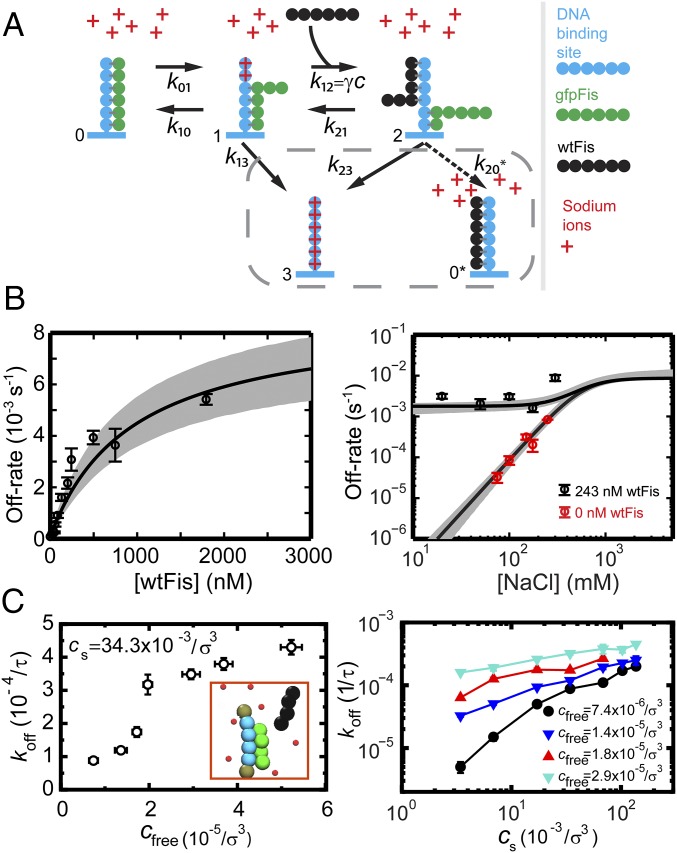
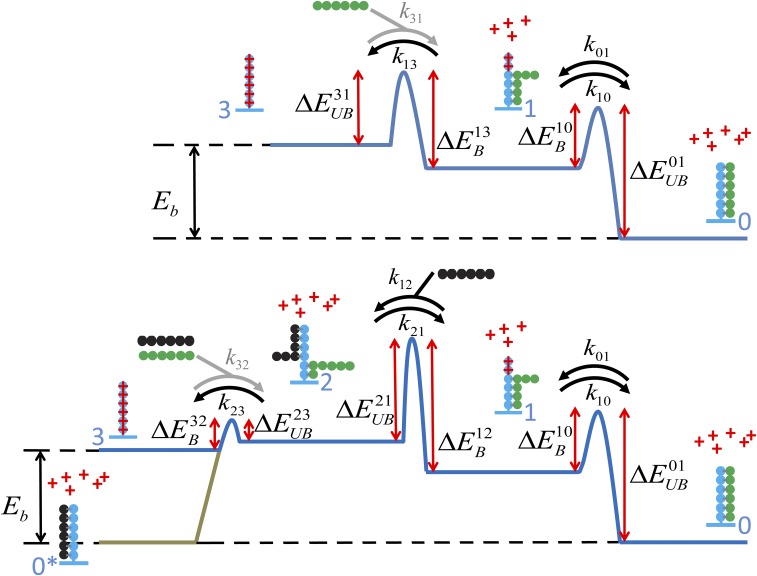
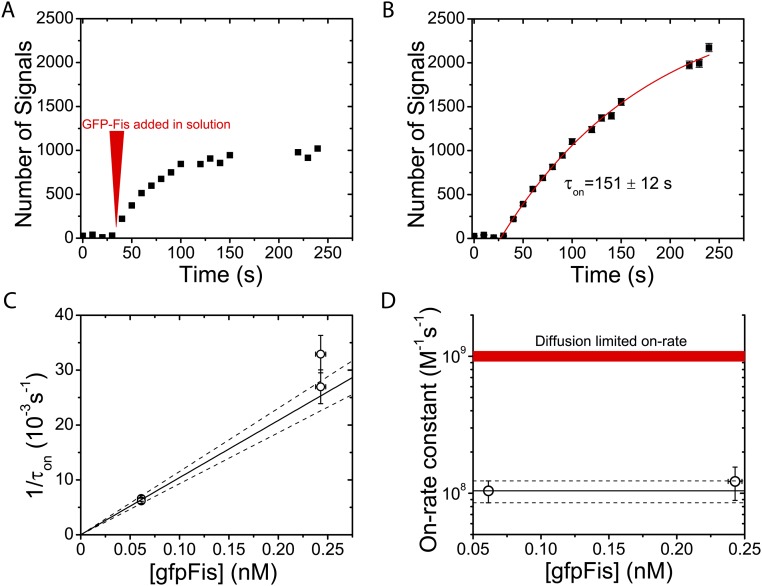
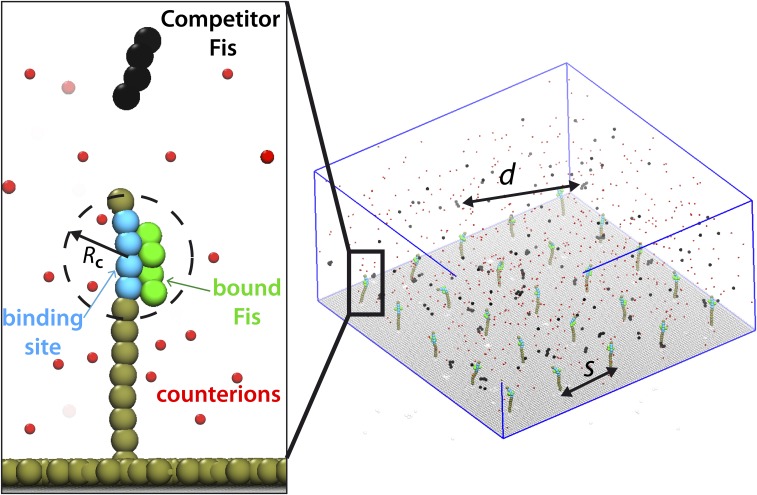
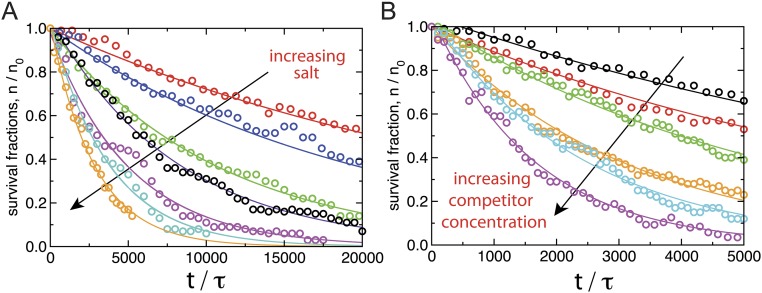
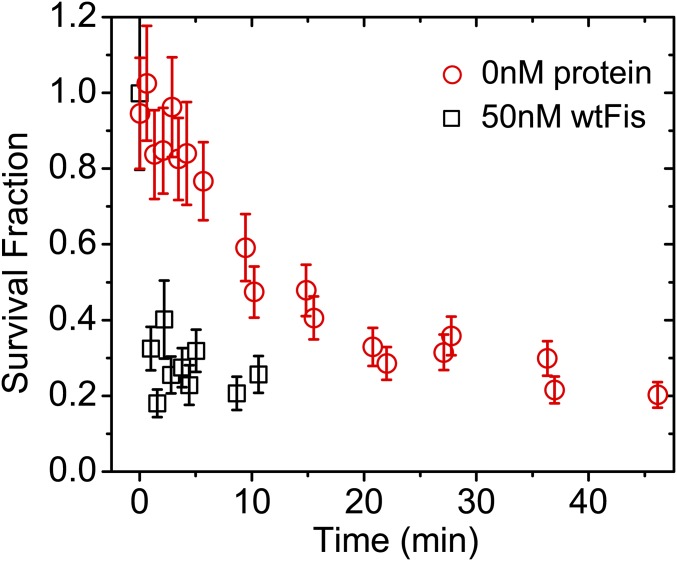
The binding of transcription factors (TFs) to DNA controls most aspects of cellular function, making the understanding of their binding kinetics imperative. The standard description of bimolecular interactions posits that TF off rates are independent of TF concentration in solution. However, recent observations have revealed that proteins in solution can accelerate the dissociation of DNA-bound proteins. To study the molecular basis of facilitated dissociation (FD), we have used single-molecule imaging to measure dissociation kinetics of Fis, a key Escherichia coli TF and major bacterial nucleoid protein, from single dsDNA binding sites. We observe a strong FD effect characterized by an exchange rate [Formula: see text], establishing that FD of Fis occurs at the single-binding site level, and we find that the off rate saturates at large Fis concentrations in solution. Although spontaneous (i.e., competitor-free) dissociation shows a strong salt dependence, we find that FD depends only weakly on salt. These results are quantitatively explained by a model in which partially dissociated bound proteins are susceptible to invasion by competitor proteins in solution. We also report FD of NHP6A, a yeast TF with structure that differs significantly from Fis. We further perform molecular dynamics simulations, which indicate that FD can occur for molecules that interact far more weakly than those that we have studied. Taken together, our results indicate that FD is a general mechanism assisting in the local removal of TFs from their binding sites and does not necessarily require cooperativity, clustering, or binding site overlap.

Keywords: DNA–protein interactions; biomolecule binding; chemical kinetics; facilitated dissociation; transcription factor.


Conflict of interest statement

The authors declare no conflict of interest.

Figures

Fig. 1.
Fig. 1.
Off-rate measurement. (A) The survival fraction is measured by counting the number of fluorescent signals (green spheres in Left) remaining in the flow cell as a function of time and normalizing by the initial number of signals. A new region along the flow cell is used for a measurement of the survival fraction at each subsequent time point. To obtain the off rate, the survival fraction decay is fit to a single decaying exponential exp(t/τoff) (Right). In the example shown, τoff=145±6min, with χ2/ν=0.34. SI Materials and Methods has details of the survival fraction calculation. (B) Camera frame showing single-molecule fluorescence images in separate channels. Each panel is the full 512 × 512-pixel array (52.5 × 52.5 µm2). Insets are magnified views of the regions contained in the white boxes. (Left) Fluorescent signals from gfpFis and (Center) signals from Cy3-labeled F1 DNA binding sites show (Right) a high degree of colocalization, indicating the specificity of gfpFis binding to F1 sequences. In Right, gfpFis signals are false-colored green, and Cy3–DNA signals are false-colored red. Regions where green false color overlaps with red false color appear orange, indicating colocalization. Only gfpFis signals that colocalize with Cy3–DNA signals are retained for inclusion in the measurement of survival fraction.
Fig. S1.
Fig. S1.
F1 sequences are binding sites for single gfpFis dimers. (A) Sample single-molecule fluorescence trajectories for gfpFis signals displaying (Left) one, (Center) two, or (Right) three bleach steps. Horizontal red lines represent gfpFis brightness at each fluorescence level. (B) Histogram of the number of bleach steps observed from each of a total of 50 observed gfpFis trajectories. Error bars are the square roots of the number of trajectories in each bin. (C) Histogram of measured bleach step sizes from a total of 30 Cy3–F1 DNA signal trajectories. The total number of bleach steps is 33 (a minority of Cy3 signals had multiple bleach steps). The mean of the distribution is Bsm= 141,700 ± 9,800 countspersignalper350ms. (D) Overall probability P(n|n>0) to observe n binding sites in a diffraction-limited region given that there is at least one binding site. P(n|n>0) combines the probability for a streptavidin molecule to be occupied by o binding sites with the probability for ns streptavidin molecules to be colocalized to a diffraction-limited area.
Fig. 2.
Fig. 2.
TF dissociation measurements from single binding sites. (A) Sample survival fraction time course measurements (symbols) for gfpFis at each concentration of wtFis in solution that was tested. Error bars are estimates of the statistical uncertainty in the data points from various sources (SI Materials and Methods). At each concentration, the early portion of the survival fraction decay is well-fit to a single exponential decay to obtain the off rate (curves; typically χ2/ν1). (B) Off rate vs. concentration of wtFis in solution. Vertical error bars are a weighted SD of two to four measurements, except for the measurement at 54 nM, which contains a single measurement (SI Materials and Methods). Sizes of the horizontal error bars are smaller than the symbols (except for data point at 1,794 nM) and represent statistical error in [wtFis]. (Inset) Low-concentration behavior. Solid curve is a fit to Eq. 1. The exchange rate kexch and saturation rate ksat are estimated from the fit and given by B1DA/B2=(1.0±0.2)×104 M−1 s−1 and A1=(8.1±1.5)×103 s−1, respectively; D is within 0–8 nM, and χ2/ν9. Errors are scaled by χ2/ν. If the ratio D/B is fixed to the measured value [D/B=ko=(9±2)×105s1], B and A change by 16.9 and 7.6%, respectively, which are within error. (C) NHP6A survival fraction time courses showing that NHP6Agfp also displays FD from single binding sites using wtNHP6A as a competitor. Experiments performed in protein-free 50 mM NaCl buffer are shown for two duplicate trials (gray and black symbols). Vertical error bars are estimated as in A. The datasets corresponding to 80 and 250 nM [wtNHP6A] are normalized to the number of signals measured after the survival fraction has already decayed by reincubating the flow cell with NHP6Agfp and counting the number of signals under protein-free buffer conditions.
Fig. S2.
Fig. S2.
Simple model of FD. (A) Kinetic diagram of FD. In a simple version of the kinetic scheme depicted in Eq. S6 (27), the protein molecules and DNA binding sites are each represented by a dimer of identical subunits. Because of the twofold symmetry implicit in this scenario, the TF partially unbinds by breaking exactly one-half of the total number of contacts made with the DNA. Note that we do not intend this figure to depict the actual structure of the Fis–DNA–Fis ternary complex or suggest that one Fis subunit actually completely dissociates from DNA in state 1. (B) Red curves show the predicted salt dependence of the off rate in the FD kinetic scheme using arbitrary parameters. Red curves are parameterized by different protein concentrations. The solid black curve represents the salt dependence of the spontaneous dissociation pathway, which does not depend on the concentration of TFs in solution, and shows the asymptotic behavior at high salt concentrations. Dashed black curves are parameterized by the protein concentration and show the asymptotic behavior of the off rate at low salt concentrations where the protein-dependent pathway is dominant.
Fig. 3.
Fig. 3.
Salt dependence of off rate. (A) gfpFis decay curves measured in protein-free buffer at multiple NaCl concentrations. (B) gfpFis decay curves measured in buffer containing 243 nM [wtFis] at multiple NaCl concentrations. (Inset) Same data shown on a zoomed in scale to show detail. In both A and B, the early portions of the survival fraction curves are fit to a single exponential decay to obtain the dissociation rate, and the error bars are estimated just like in Fig. 2A. (C) Off rate of gfpFis as a function of NaCl concentration in protein-free buffer (black symbols) and buffer containing 243 nM [wtFis] (white symbols). Error bars are estimated as in Fig. 2B. Long dashed curves are power-law fits. The protein-free off rate is fit to a single power law (koff=acSM), giving M=2.6±0.3. The 243 nM off rate is fit to a sum of power laws (koff=acSM+bcSmc) (Eq. 2), with M and a fixed to the values obtained by fitting the protein-free data. The gray band is a range of fits to the 243 nM data obtained by allowing joint variation in m and b while still allowing for a plausible fit. In these fits, m ranged from 0 to 0.25, beyond which the slope of the power law did not allow for reasonable agreement with the data. A single power-law exponent equal to M/2 is shown for comparison (short dashed curve).
Fig. 4.
Fig. 4.
Global fit to kinetic model and simulations. (A) Schematic representation of a kinetic model of FD. Schematic depicts the multivalency of Fis–DNA interactions by drawing Fis as a multipartite object. However, this sketch should not be interpreted as Fis taking a linear form. The model explicitly includes positive Na+ ions in solution, which can condense on DNA and compete with binding locations on Fis for contacts to the DNA. Going from state 1 to state 2, the original TF (green) is shown with fewer contacts to the DNA to depict the possibility that the competitor could destabilize the binding of the original TF. The gray box encircles the two possible final states of the ternary complex; however, this study considers the left-pointing solid arrow. SI Materials and Methods has a detailed derivation of the mean reaction time, including the salt and protein concentration dependence with this kinetic model. (B) [wtFis] (Left) and [NaCl] (Right) dependence measurements of the off rate are globally fit to extended kinetic model (solid curves). Bimolecular on-rate constant γ=1.04±0.19×10⁸ M−1 s−1 is fixed by experiment (SI Materials and Methods) in the fitting. Gray bands represent 68.3% confidence intervals of the fit (SI Materials and Methods). (C) Coarse-grained simulations correspond to an extended kinetic model where protein and DNA molecules are represented by chains of reactive beads as illustrated in Inset (SI Materials and Methods). (Left) Protein concentration dependence of the off rate obtained from the simulations. Off rate is plotted in units of the inverse self-diffusion time τ of a bead (SI Materials and Methods). (Right) Salt concentration dependence of the off rate at multiple protein concentrations.
Fig. S3.
Fig. S3.
Energy diagram of the FD model including multivalency of TF–DNA interactions and salt ions. Upper corresponds to the spontaneous dissociation pathway. Lower corresponds to the protein concentration-dependent pathway. TFs (green and black strings of beads) are composed of multiple identical subunits, each of which binds a part of the DNA binding site (blue strings of beads). Salt ions (red crosses) are explicitly included and allowed to compete with TFs for making contacts with the DNA binding site. The overall binding energy of a TF is given by Eb. Transition barrier heights are labeled with either B (to indicate that part or all of a TF is binding DNA) or UB (to indicate that part or all of a TF is unbinding DNA). Black arrows represent microscopic kinetic rates between states. Gray arrows are auxiliary rates used in calculating the salt dependence of the kinetic rates kij that go in the off-rate calculation.
Fig. S4.
Fig. S4.
Measurement of on-rate constant. (A) On-rate measurement uncorrected for bleaching. The red marker designates when gfpFis is added into solution. The concentration of gfpFis added in solution is 61 ± 1 pM. (B) On-rate measurement corrected for bleaching. Data are fit to an exponential recovery function (red curve) of the form a+A(1exp((tto)/τon)), with a fixed to 26.25 signals, giving an exponential recovery time of τon=151±12s. (C) On rate τon1 shows expected linear scaling with gfpFis concentration c. Data points are on-rate measurements at 61 ± 1 and 243 ± 5 pM. Error bars represent statistical error in on rate from fitting to an exponential recovery. The solid line has a slope equal to the measured bimolecular on-rate constant γ estimated from the 61 pM measurement. Dashed lines represent the total statistical error in γ. Systematic error in the on rate, caused by error in the bleaching rate, is represented by duplicate data points at each concentration. (D) Bimolecular on-rate constant γ estimated from 243 pM data is consistent with the estimate from 61 pM data. Data points at each concentration are weighted averages of data points in C. Error bars include all statistical and systematic errors combined. The red line represents a typical estimate of a diffusion-limited bimolecular on-rate constant (56).
Fig. S5.
Fig. S5.
Illustration of the single-binding site model used in the simulations. A small portion of the 3D simulation box is shown in Right; d is the average distance between competitor protein in solution, and s is the distance between two grafted chains. In the simulations, the full number of binding sites is 100.
Fig. S6.
Fig. S6.
Survival fraction curves in simulations. (A) Survival fraction of bound proteins as a function of simulation time for various salt concentrations in the presence of competitor Fis. The volume fraction of competitors is on the order of 10−5σ−3. (B) Survival fraction for various competitor protein concentrations at cs=34×103σ3. The simulation time is in the units of LJ time; no=100. All curves are single exponential fits.
Fig. S7.
Fig. S7.
Heterotypic FD of NHP6A. Survival fraction curve (red) of NHP6Agfp using wtFis as competitor showing that wtFis is able to cause FD of NHP6A. A survival fraction curve of NHP6Agfp with no competitor is reproduced from Fig. 2C for comparison.

Similar articles

Cited by

References

    1. Christmann M, Kaina B. Transcriptional regulation of human DNA repair genes following genotoxic stress: Trigger mechanisms, inducible responses and genotoxic adaptation. Nucleic Acids Res. 2013;41:8403–8420. - PMC - PubMed
    1. Dominguez-Sola D, et al. Non-transcriptional control of DNA replication by c-Myc. Nature. 2007;448:445–451. - PubMed
    1. Ganapathi M, et al. Extensive role of the general regulatory factors, Abf1 and Rap1, in determining genome-wide chromatin structure in budding yeast. Nucleic Acids Res. 2011;39:2032–2044. - PMC - PubMed
    1. Guerra RF, Imperadori L, Mantovani R, Dunlap DD, Finzi L. DNA compaction by the nuclear factor-Y. Biophys J. 2007;93:176–182. - PMC - PubMed
    1. Ong CT, Corces VG. CTCF: An architectural protein bridging genome topology and function. Nat Rev Genet. 2014;15:234–246. - PMC - PubMed

Publication types

MeSH terms